How Bitcoin Climbed From Below $75,000 to Over $87,000 in Just Six Days
Bitcoin surged nearly 17% in under a week, but the rally had almost nothing to do with steady buying pressure. Two explosive sessions tell the real story, and the forces behind them reveal whether this move has any staying power.

This post may contain links from our sponsors and affiliates, and Flywheel Publishing may receive compensation for actions taken through them.

Bitcoin (CRYPTO:BTC) soared by nearly $12,500 over six trading sessions, starting from an intraday low of $74,912 on September 16, 2026, and reaching a high of $87,397 on September 21—an almost 17% gain. Most people notice only the two extremes, but the days in between show how this Bitcoin price move happened.
The key jumps on September 18 and September 21 accounted for about 95% of the total gain from the September 16 close to the September 21 close. The other four sessions saw little price movement, prompting the question: what triggered those two significant days, and will the same buyers participate in the next price surge?
Bitcoin Found Support Near $75,000 Twice Before Stalling

Buyers stepped in to defend the same support level twice. Bitcoin dipped to $74,888 on September 15, the day the Senate rejected a crucial crypto market structure bill. It fell to $74,912 on September 16, as the Federal Reserve raised interest rates to a range of 3.75% to 4.00%. On both occasions, buyers pushed the price back above $75,000 by the end of the sessions.
However, the following session showed almost no progress, with Bitcoin closing at $76,145 on September 16 and $76,349 on September 17—an overall increase of only about $200. Bitcoin seemed to have found a stable floor but lacked direction, which often marks how a selloff concludes before buyers return.
September 18 and September 21 Delivered 95% of Bitcoin’s Gain

A breakout occurred on September 18, with Bitcoin opening at $76,349, climbing to a high of $81,388, and closing at $80,875—an impressive gain of about $4,500 in just one day. This surge lifted Bitcoin out of the mid-$76,000s and into the low $80,000s.
However, momentum stalled again, with closes of $81,234 on September 19 and $81,160 on September 20, up only about $300 from the September 18 close.
The true spike came on September 21, when Bitcoin opened at $81,160, peaked at $87,397, and closed at $86,595—adding around $5,400 in that single session. Together, these two significant days contributed nearly $10,000 of the overall $10,450 gain from the September 16 close to the September 21 close, with the three quieter sessions in between accounting for the remainder.
Short Sellers Fueled Bitcoin’s Final Leg, and $999 Million of Fund Money Joined In
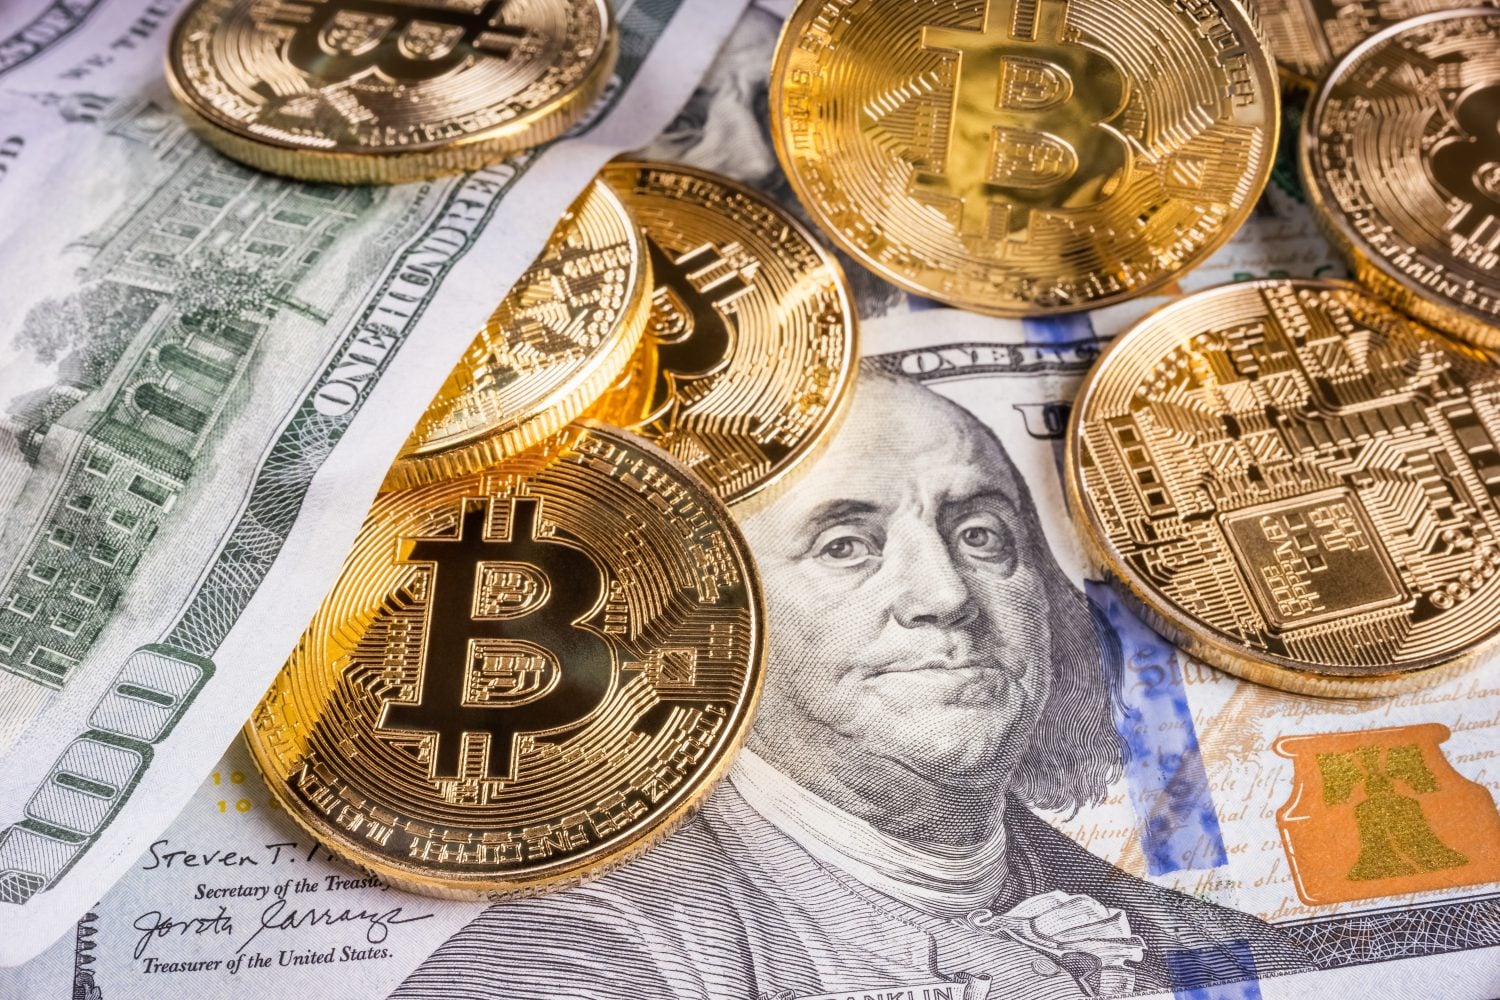
On September 21, two forms of buying contributed to the price surge. The first was forced buying from short liquidations. Short sellers bet against Bitcoin by borrowing and selling it, hoping to buy it back at a lower price. When the price rises too high, their positions close automatically, forcing them to buy Bitcoin at market prices to cover their losses.
This buying pressure pushed the price higher and triggered further short liquidations in a chain reaction. In just 24 hours leading into the rally, exchanges liquidated over $800 million in crypto positions, predominantly short positions. However, this buying effect stops once the last short seller exits, so it can only push the price up a limited number of times.
The second type of buying came from voluntary fund investments. On September 21, U.S. spot Bitcoin funds attracted $999 million, marking their best day in nearly a year. This figure represents new inflows minus exits, providing a clear picture of fresh investment. Spot Ethereum funds saw a net inflow of around $270 million on the same day, contributing to a total crypto market valuation that surpassed $3 trillion.
How Did the Bitcoin Price Jump $12,500 in Six Days?
Bitcoin made its impressive leap in just two major sessions, rather than spreading it across six days. It broke out of its established range on September 18 and drove through a wave of short sellers on September 21, with $999 million in inflows from funds the same day. The four quieter sessions in between only contributed about $1,000 to the overall gain. Understanding this dynamic is crucial. The price surge was driven by triggers rather than consistent, steady buying, which could mislead observers into thinking the price was climbing steadily.
Bitcoin held a tighter range on September 22, with a low of $86,279, suggesting that the fund money remained even after the shorts were cleared out. The key level to watch is the September 18 close of $80,875, because a close below it could mean the gains were only temporary. In contrast, holding above it, along with approaching the $87,498 opening level from the year, could extend the upward trend.
Contact [email protected] for any questions or corrections.
Sam Daodu is a crypto analyst who's spent nearly a decade making blockchain understandable—no easy task when most whitepapers read like fever dreams. He writes for 24/7 Wall St., covering Bitcoin, altcoins, and crypto market analysis for investors. Before crypto, he was a tech writer (back when explaining "the cloud" was peak innovation). Since 2018, he's written for CoinTelegraph, Yahoo Finance, The Block, Cryptonews, Zypto, Rain, and more—basically anywhere people want crypto news without the headache. Sam runs MacLabs Marketing, a content agency for crypto brands tired of sounding like AI wrote their website. He also publishes free crypto education on his site for Web3 enthusiasts who think "gas fees" is a typo. When he's not writing or staring at charts, Sam's either: - Watching anime (currently convinced One Piece has better tokenomics than most altcoins) - At the gym sculpting himself into a Greek god - Listening to the music your mum warned you only bad boys listen to Connect: LinkedIn | Email | MacLabs Marketing