Bitcoin Analysis: BTC Is Clinging to Its 50-Day Average. How Low Could It Go if That Breaks?
Bitcoin is the last major cryptocurrency still clinging to its 50-day moving average, but short-term holders are flooding exchanges with coins at a pace not seen in a year. History shows what happens next ranges from a minor pullback to…

This post may contain links from our sponsors and affiliates, and Flywheel Publishing may receive compensation for actions taken through them.

Bitcoin (CRYPTO:BTC) is currently hovering around its 50-day average, a key measure that traders use to assess medium-term trends. On October 18, 2026, BTC closed 0.8% above this important line, which was at $81,396. Notably, it was the only major cryptocurrency still above its 50-day average.
Bitcoin trades at $81,511, slightly below the updated 50-day average of $81,538. In the last 24 hours, Bitcoin fell 0.7% and is down 2% over the past week, trading 35.4% below its all-time high.
Between October 12 and 18, Bitcoin fluctuated between $79,676 and $84,262, and as of October 19, it was down 2.1% for the month. If the 50-day average fails to hold, where could Bitcoin possibly go from here?
Why Bitcoin Keeps Drifting Back to Its 50-Day Average

The recent downturn in Bitcoin’s price is largely driven by short-term holders, or recent buyers, who are taking profits. Data from on-chain analytics firm Glassnode indicates these profit-takers have driven significant inflows into exchanges, marking the largest movement onto trading platforms in a year—typically a sign that coins are about to be sold.
However, Glassnode also notes that this profit-taking activity has slowed to its yearly average, which might explain Bitcoin’s steady decline. Still, this stability has not attracted substantial new buyers.
Buyer interest has been inconsistent. U.S. spot Bitcoin ETFs, which hold actual Bitcoin and operate like stocks, saw a net inflow of $527 million on October 19 after experiencing $82 million in outflows on October 16. The biggest selling occurred on October 7, when $487 million exited the funds, the largest single-day outflow recorded between September 21 and October 19.
The broader crypto market appears weaker compared to Bitcoin. Total cryptocurrency market value fell 3.2% in the last 24 hours, and the Crypto Fear and Greed Index read 44, placing it in “Fear” territory.
Russell Thompson, the Chief Investment Officer at Hilbert Group, turned short-term bearish on Bitcoin on October 9 and reiterated his stance in his weekly report. Nonetheless, he remains optimistic about Bitcoin’s medium-term outlook, suggesting it may be a good opportunity to buy during dips.
What Happened the Last Four Times Bitcoin Lost Its 50-Day Average

Bitcoin has lost its 50-day average four times in 2026.
| Date BTC Lost the 50-Day | Close That Day | Following Low | Drop |
|---|---|---|---|
| March 19 | $69,918 | $64,939 (March 29) | 7.1% |
| May 22 | $75,444 | $59,073 (June 5) | 21.7% |
| July 16 | $63,771 | $62,210 (August 1) | 2.4% |
| August 14 | $62,975 | August 16 low | 0.5% |
The worst drop came after the May break, when Bitcoin fell from $75,444 to $59,073, a 21.7% decline. However, the declines following the July and August breaks were much milder, with drops of 2.4% and 0.5%, respectively, before Bitcoin rebounded to close at $77,054 on August 22.
With four instances of breaking the 50-day average this year, it’s hard to predict outcomes from such a small sample.
Bitcoin Is Holding Up Better Than Ethereum, Solana and XRP
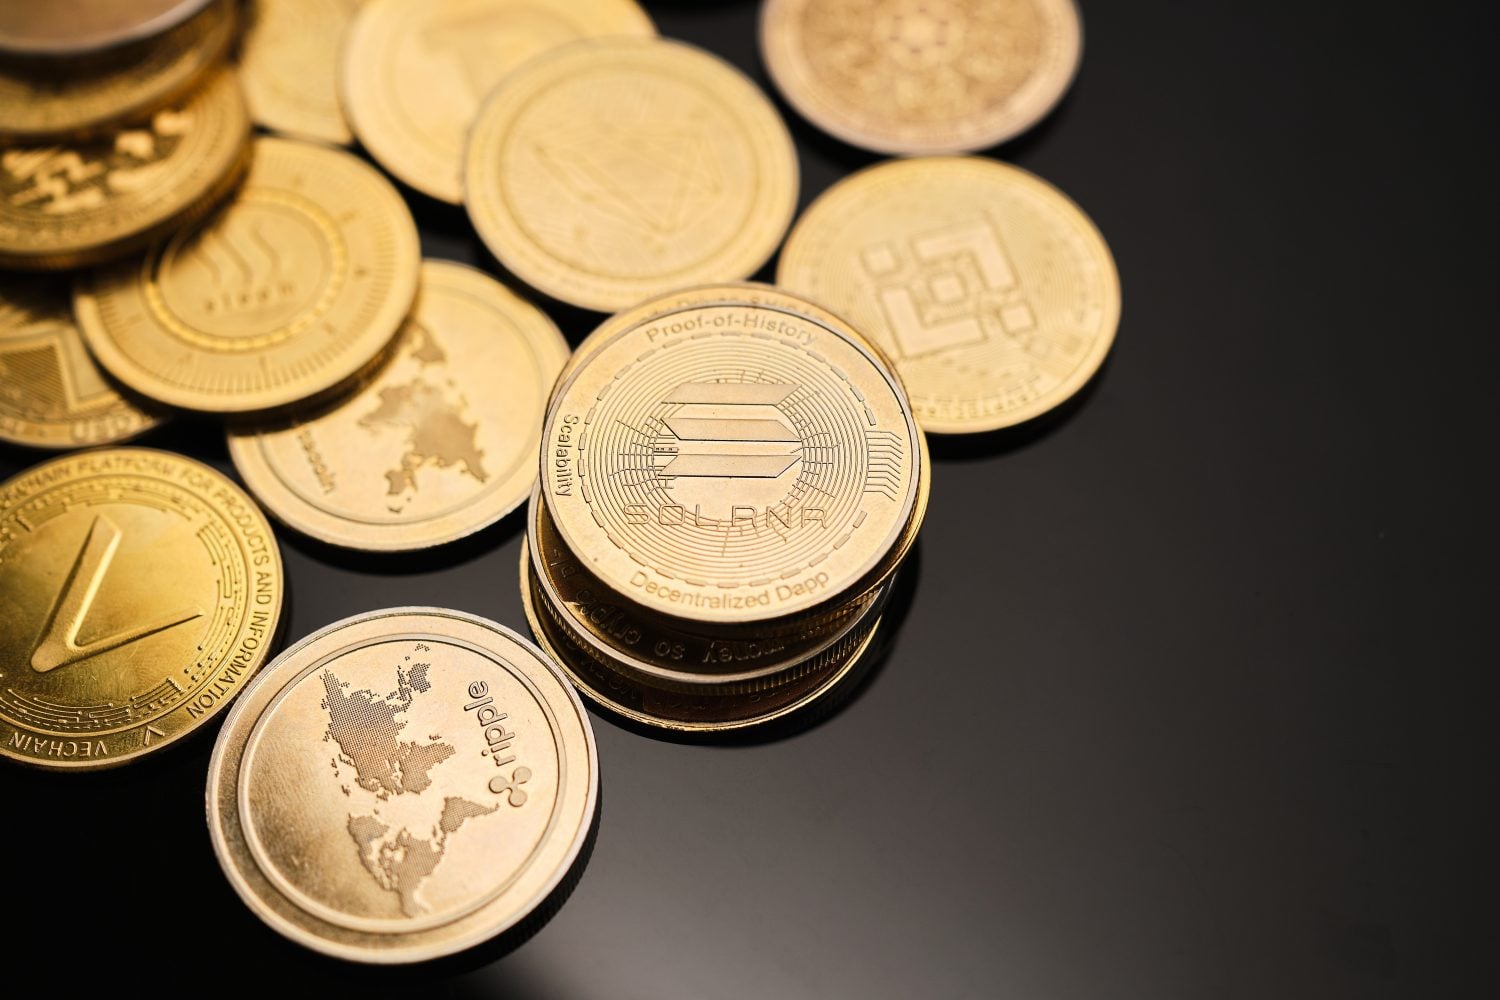
Over the past month, Bitcoin gained 0.4%, while Ethereum (CRYPTO:ETH) fell 9.5%, Solana (CRYPTO:SOL) dropped 6%, and XRP (CRYPTO:XRP) lost 8.1%. Over the past year, Bitcoin remains ahead, down 26.3%, compared to Ethereum’s 39.9%, Solana’s 44.9%, and XRP’s 48.1% decline.
Bitcoin’s market dominance currently stands at 59.6%. When investor sentiment turns cautious, money typically flows out of smaller cryptocurrencies and into Bitcoin, which benefits from deeper trading markets and steady demand from spot ETFs. This trend likely explains why Bitcoin has held above its 50-day average longer than other major coins.
Trading activity has also decreased, with total crypto trading volume down by 1.5% in the last 24 hours. Bitcoin’s most active trading session recently occurred on September 21, when the price rose from a close of $81,160 the previous day to $86,595. When Bitcoin declines on low trading volume, it signals calm among sellers, but buyers appear hesitant.
Hilbert Marks Bitcoin Support at $79,000, $77,000 and $72,000

Hilbert identifies several crucial support levels for Bitcoin: the immediate 50-day average at $81,538, followed by $79,000, which represents the max pain level as options expiry approaches. The “max pain” level is the price point at which the most options contracts expire worthless, causing the biggest losses for option buyers. Prices sometimes gravitate toward this level as expiry nears, with BTC touching $79,676 on October 15.
Below that, Thompson notes trend-line support at $77,000, and Hilbert mentions a moving-average support band that extends down to $72,000. Even $72,000 is considerably higher than the $59,073 low from June 5.
Options traders appear to be adopting a defensive approach. According to Hilbert, put options—contracts that gain value when prices drop—trade at a 16-point premium over call options, which gain value when prices rise. Additionally, implied volatility, which estimates potential price swings, is 35, above the realized volatility of 32.5, suggesting traders are pricing in more volatility than the market has delivered recently.
How Low Could Bitcoin Drop if It Breaks the 50-Day Average?
We believe Bitcoin is likely to close below its 50-day average soon; however, the support levels beneath it appear stronger than they did in May. A drop below this average alone wouldn’t be a strong signal, especially given the mixed signals we’ve seen from Bitcoin’s movements in 2026.
A daily close below $77,000 would be a more concerning indicator, as it would break Hilbert’s trend line and bring the $72,000 support level into focus.
On the upside, Hilbert suggests that if Bitcoin breaks and holds above $88,000, it could pave the way for prices in the mid-$90,000s. Bitcoin’s recent high was $87,397 on September 21, just short of that crucial level. Thompson’s medium-term outlook depends on this breakout, accompanied by a surge in inflows like those seen on October 19. A daily close above $88,000 would contradict the current short-term bearish outlook.
Contact [email protected] for any questions or corrections.
Sam Daodu is a crypto analyst who's spent nearly a decade making blockchain understandable—no easy task when most whitepapers read like fever dreams. He writes for 24/7 Wall St., covering Bitcoin, altcoins, and crypto market analysis for investors. Before crypto, he was a tech writer (back when explaining "the cloud" was peak innovation). Since 2018, he's written for CoinTelegraph, Yahoo Finance, The Block, Cryptonews, Zypto, Rain, and more—basically anywhere people want crypto news without the headache. Sam runs MacLabs Marketing, a content agency for crypto brands tired of sounding like AI wrote their website. He also publishes free crypto education on his site for Web3 enthusiasts who think "gas fees" is a typo. When he's not writing or staring at charts, Sam's either: - Watching anime (currently convinced One Piece has better tokenomics than most altcoins) - At the gym sculpting himself into a Greek god - Listening to the music your mum warned you only bad boys listen to Connect: LinkedIn | Email | MacLabs Marketing