Bitcoin Under $76,000 After $430M ETF Outflows. Has It Bottomed?
A rare 4-sigma stock market rout dragged Bitcoin down while every spot ETF issuer watched cash walk out the door. One small bounce has traders split on whether the worst is over, and a single price line may settle it.

This post may contain links from our sponsors and affiliates, and Flywheel Publishing may receive compensation for actions taken through them.

Bitcoin (CRYPTO: BTC) is trading at $75,773, remaining below the critical $76,000 mark it lost on November 5, 2026. This decline follows a significant net outflow of $430.2 million from US spot Bitcoin ETFs on that same day, as reported by Farside. This outflow starkly reverses the previous session’s $74.6 million inflow.
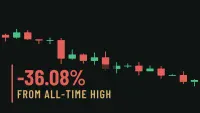
Bitcoin fell roughly 6% to about $75,700 and ultimately closed at its lowest price in the past month on November 5. It now trades 39.9% below its all-time high of $126,080, which was reached on October 6, 2025; a 66.39% rally from the current price would be needed to recover this level. Year to date, Bitcoin is down 13.48%.
After touching a low of approximately $75,200, Bitcoin rebounded slightly and has increased by 0.27% in the past 24 hours. So did that bounce signal a bottom, or is it just a pause before further declines?
Wall Street’s Severe ‘4-Sigma Day’ Affects Bitcoin

Bitcoin’s sharp drop coincided with a major stock market sell-off: the Nasdaq fell 5.52%, the S&P 500 dropped 4.36%, and the Dow Jones fell 3.44% on November 5. Spot ETFs let investors hold Bitcoin in the same brokerage accounts as their stocks, and as risk-taking declined, investors sold everything en masse, including Bitcoin.
During this turmoil, the CBOE Volatility Index, or VIX, surged from 16.61 to 28.18. Traders treat readings above 30 as a sign of high fear, so the move showed heavy stress just short of outright panic.
Michael Saylor, co-founder of Strategy Inc. (NASDAQ: MSTR | MSTR Price Prediction), labeled November 5 a ‘4-sigma day’ for equities on social media, noting that such a drastic move is statistically unusual. Both shares of Strategy, the largest corporate holder of Bitcoin, and Coinbase (NASDAQ: COIN) fell about 10%.
Despite the downturn, Saylor pointed out that STRC, Strategy’s variable-rate preferred stock, finished the day at $99.56, just below the face value that its dividend supports. This suggests that investors remained confident in an instrument used to fund Bitcoin purchases. The sell-off was exacerbated by leverage, leading to roughly $879.92 million in forced liquidations within four hours, with $818.90 million coming from long positions and only $61.02 million from shorts.
All Spot Bitcoin ETFs Experience Outflows on November 5

Data from Farside indicated that no spot Bitcoin fund gained any money on November 5, as all experienced outflows. A net outflow suggests more investors redeemed shares than purchased them, prompting the issuer to sell Bitcoin to cover these redemptions.
| Fund | Net Flow on November 5 (Farside) |
|---|---|
| Fidelity’s Bitcoin ETF | -$199.9 million |
| iShares Bitcoin Trust | -$105.0 million |
| Grayscale Bitcoin Trust | -$49.9 million |
| Franklin Bitcoin ETF | -$32.9 million |
| VanEck Bitcoin ETF | -$23.6 million |
| ARK 21Shares Bitcoin ETF | -$18.9 million |
| Total | -$430.2 million |
Fidelity’s fund faced the biggest losses, with BlackRock’s iShares fund closely following. Nevertheless, total inflows across Bitcoin ETFs since launch have reached $56.18 billion, so one negative session is unlikely to significantly affect the overall funds. However, simultaneous outflows from all issuers indicate a broader trend of risk reduction across the market.
Bitcoin Holds Up Better Than Ethereum and Solana Recently

Bitcoin is trading below its 20-day average of $79,956 and its 50-day average of $82,003, indicating that most buyers from the last month or two are currently facing losses. However, it remains above its 200-day average of $73,197, a key threshold traders use to distinguish corrections from bear markets.
In the last 24 hours, total crypto trading volume increased by 13.16%, according to CoinGecko. The Crypto Fear and Greed Index, ranging from 0 to 100, registered a fear level of 41. Over the past month, Bitcoin has lost 9.02%, Ethereum (CRYPTO: ETH) has declined 13.59%, and Solana (CRYPTO: SOL) has plummeted 22.35%. In the last 24 hours, Ethereum fell 2.11% to $2,223.45, and Solana fell 0.4% to $90.25, while Bitcoin edged up slightly.
Bitcoin typically sees smaller declines during sell-offs because of its large base of institutional holders, including ETFs and corporate treasuries like Strategy. It currently represents 59.14% of the entire crypto market’s value, making it a safer choice for traders looking to cut risk. In contrast, Ethereum and Solana rely more heavily on speculative traders, which can lead to greater price swings in both directions.
Key Levels to Watch for Bitcoin’s Next Move

Support levels indicate where buyers have historically stepped in, while resistance levels show where sellers have taken action. Here’s a breakdown of important levels and their distance from Bitcoin’s current price of $75,773
| Level | Description | Distance From $75,773 |
|---|---|---|
| $80,000 | Round-number resistance | +5.58% ($4,227 above) |
| $76,000 | Key level Bitcoin lost on November 5 | +0.30% ($227 above) |
| $75,200 | Recent rebound low | -0.76% ($573 below) |
| $75,000 | Round-number support | -1.02% ($773 below) |
| $73,197 | 200-day simple moving average | -3.40% |
For Bitcoin to mount a recovery towards $80,000, it must first overcome the $76,000 hurdle and then break through the 20-day average, where sellers previously made their moves.
Can Bitcoin Maintain Above $75,000?
Bitcoin’s ability to hold above the psychologically significant $75,000 mark remains in question.
Contact [email protected] for any questions or corrections.
Sam Daodu is a crypto analyst and the editor of 24/7 Wall St.'s Crypto Desk, where he covers Bitcoin, XRP, Ethereum, Solana and the altcoins investors search for most. His work focuses on price levels, spot ETF flows, on-chain data and the regulatory decisions that move crypto markets, written so a first-time buyer and a seasoned trader can both use it.
Sam has written about crypto professionally since 2019 and has published more than 2,000 articles. Before joining 24/7 Wall St., he wrote for crypto media outlets and Web3 companies and ghostwrote for crypto founders and token launches. His analysis is syndicated on Yahoo Finance, MSN and AOL and has been cited by other crypto news sites. He also founded MacLabs Marketing, a content and personal branding agency for crypto founders and executives.
When he isn't reading charts, Sam is usually at the gym or watching One Piece, a series he maintains has better tokenomics than most altcoins.