XRP Fell 7% This Week and Ethereum Less Than 1%. Why Is XRP the Weakest of the Top Five Cryptos?
While Bitcoin, Ethereum, Solana, and BNB all hold a key long-term trend line, XRP has slipped under it alone. Missing support from fund buyers and a habit of overreacting to Bitcoin may explain why, and two signals could show whether…

This post may contain links from our sponsors and affiliates, and Flywheel Publishing may receive compensation for actions taken through them.

XRP (CRYPTO: XRP) fell 7.1% over the week, to $1.16. In contrast, Ethereum (CRYPTO: ETH) slipped only 0.8%, settling at $2,233. That leaves traders asking why XRP is down so much more than its rivals.
Among the five largest non-stablecoin cryptocurrencies, XRP had the poorest performance. Solana (CRYPTO: SOL) fell 6.5%, Bitcoin (CRYPTO: BTC) lost 2.3%, and BNB (CRYPTO: BNB) dropped 1.4%. XRP’s price also dipped below its November 6 close, which was already its lowest in the past month.
This downturn began before November, with XRP losing around 37% so far in 2026, the largest decline among the top five cryptocurrencies. It currently ranks fifth by market value. So, why is XRP down more than its peers, and what might shift its trajectory?
XRP Is the Only Top-Five Coin Below Its 200-Day Average
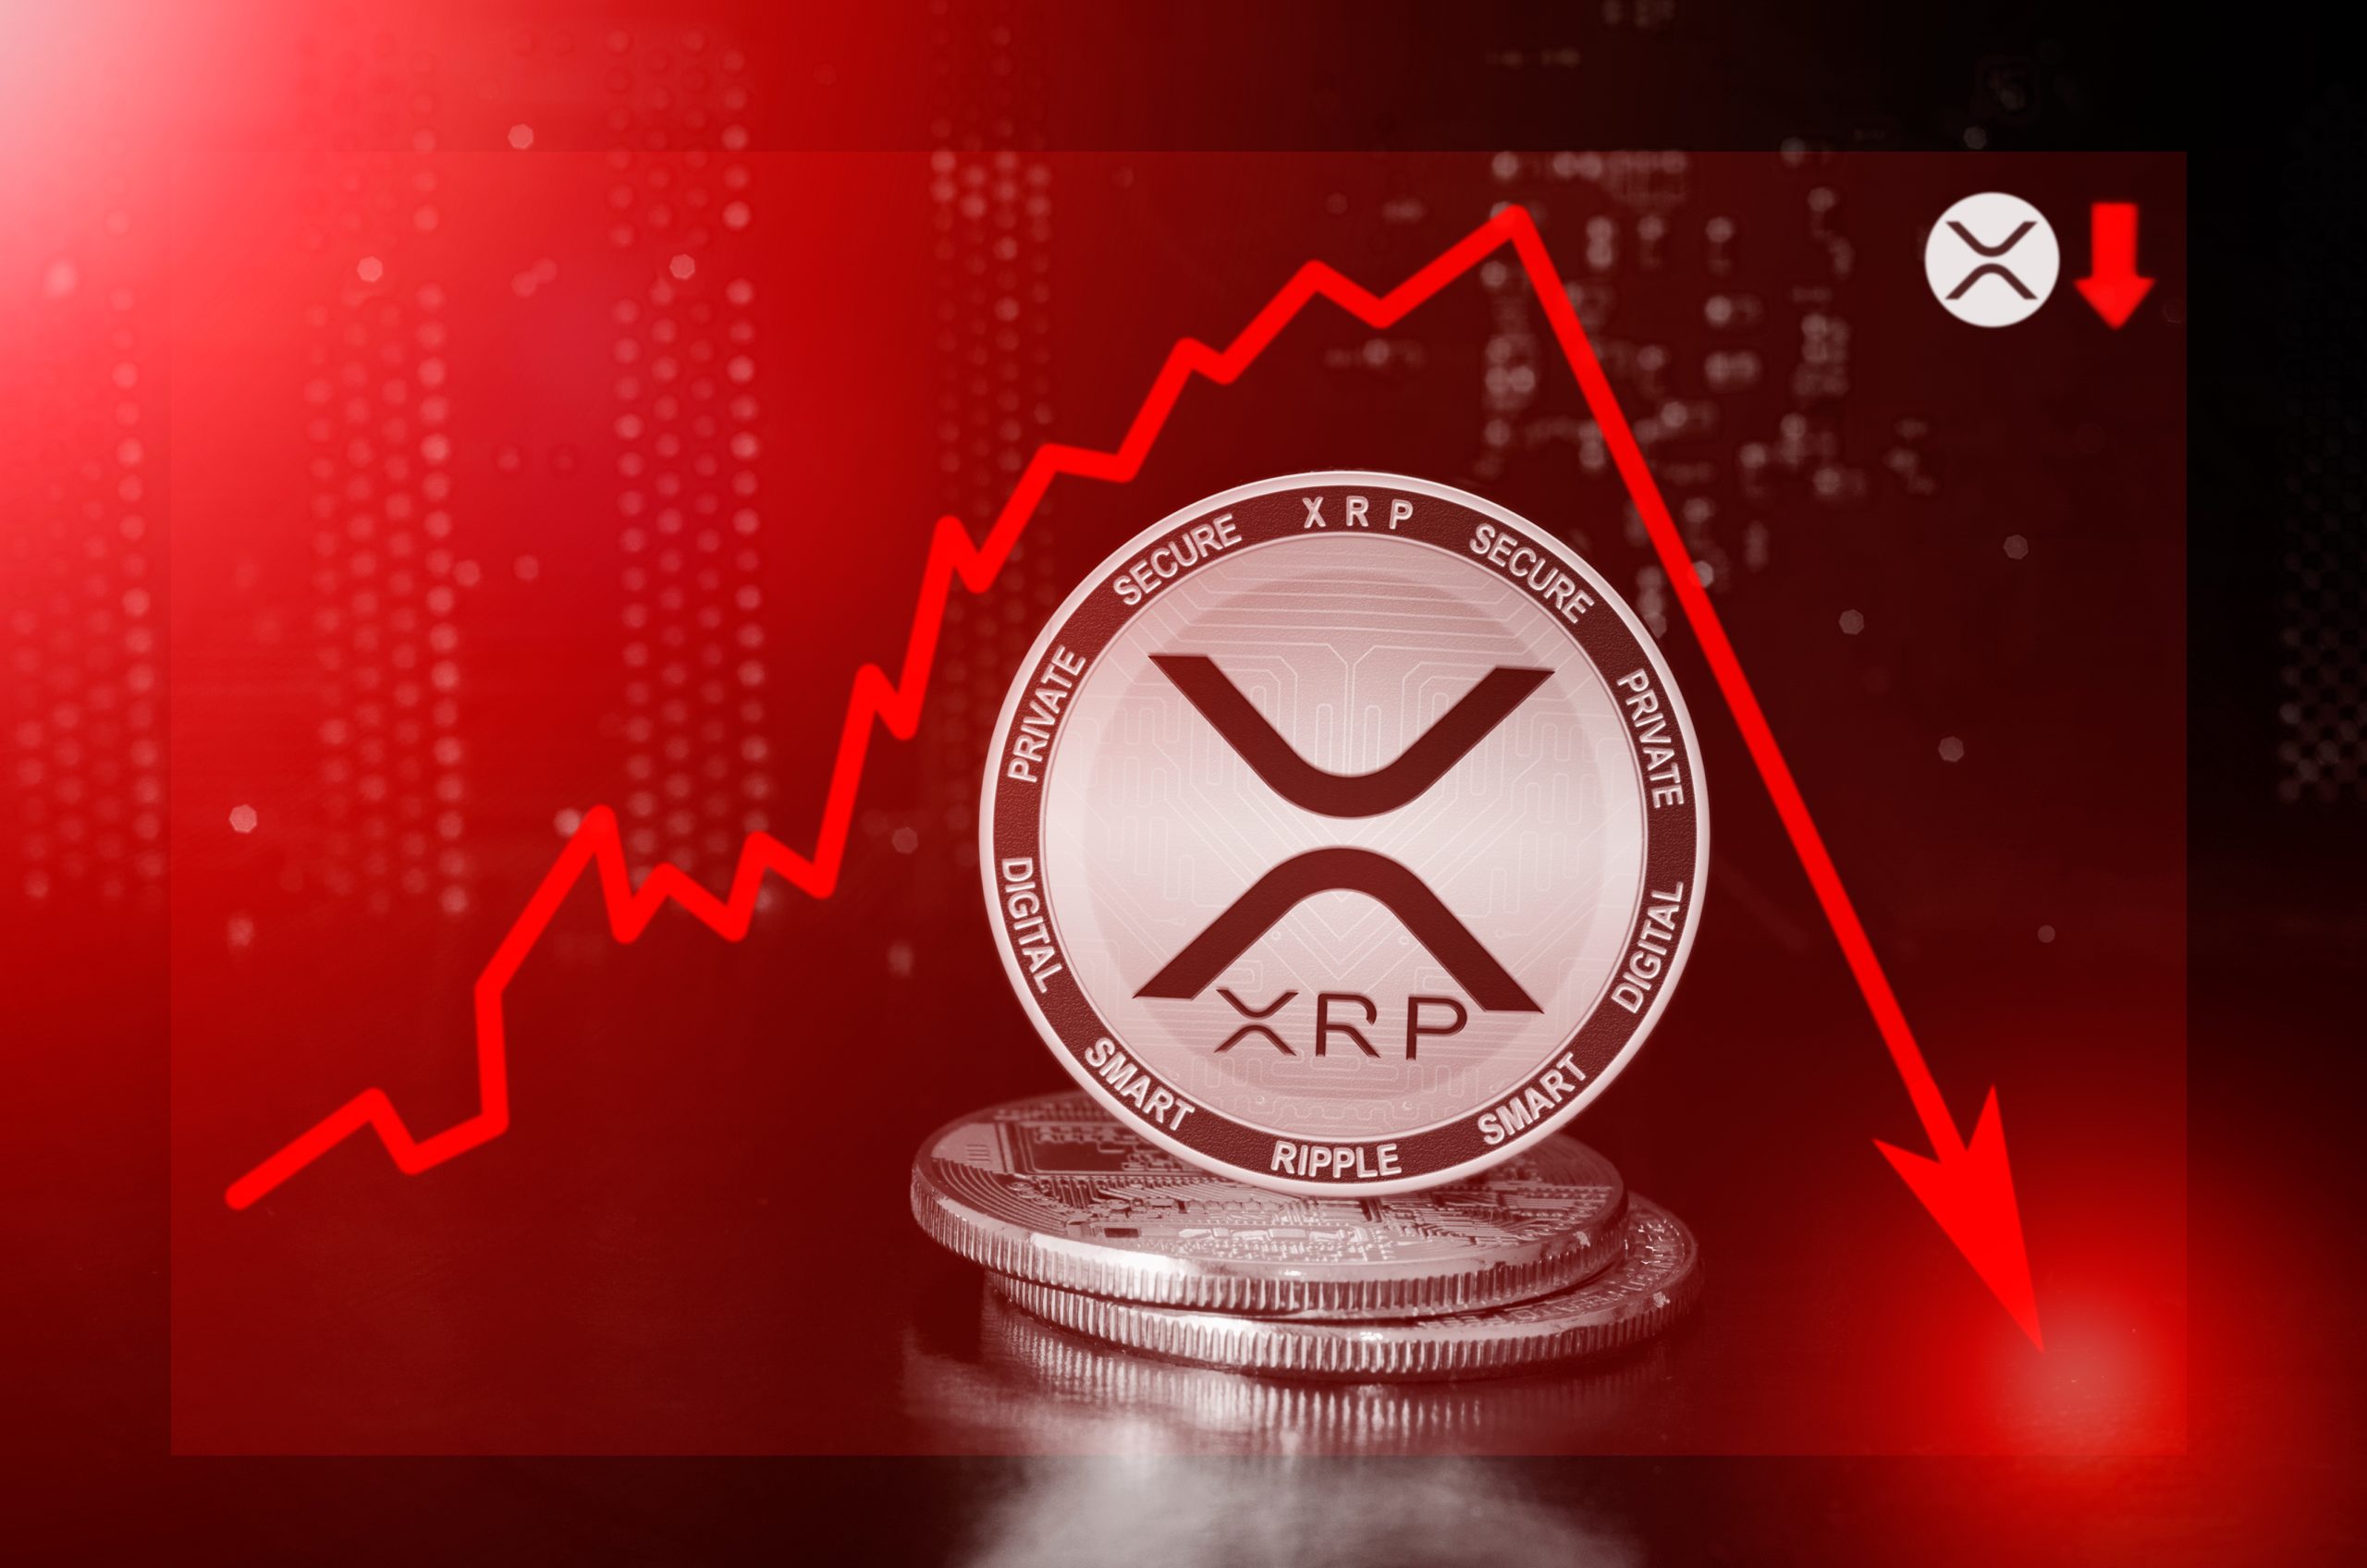
Moving averages reflect a coin’s average closing price over a certain period and are often used by traders to assess trends. XRP is currently trading below all three key moving averages, the 20-day at $1.28, the 50-day at $1.38, and the 200-day at $1.27, roughly 9% higher than its current price.
Although Ethereum is below its 20-day average of $2,333 and its 50-day average of $2,499, it remains above its 200-day average of $2,156. Bitcoin, currently at approximately $75,720, is also above its $73,197 200-day average, while Solana and BNB are faring similarly. This makes XRP the only cryptocurrency in this group showing a broken long-term trend.
XRP has fallen consistently since its 30-day closing high of $1.41 on October 11, leaving it about 68% below its all-time high of $3.65, reached on July 17, 2025. In comparison, Ethereum is roughly 55% off its peak.
Selling pressure has been relatively light. XRP’s weekly trading volume has remained far below the approximately 1 billion tokens traded in one week in late September, suggesting the token is steadily declining with minimal selling and even less buying interest. A capitulation event, a panic sell-off that usually exhausts sellers and signals a bottom, has not occurred.
XRP Lost Its Fund Buyers While Ethereum Maintained Some Support
A spot ETF directly holds the cryptocurrency and trades similarly to stocks, allowing us to track how much new investment flows into the asset. On November 2, U.S. spot XRP ETFs saw outflows of about $530,000, followed by four consecutive days of zero net flows through November 6.
Ethereum ETFs saw larger outflows, totaling $365.3 million for the week, but still attracted $53.0 million on November 4. While Ethereum benefited from some fund buying, XRP had none, making it more susceptible to downward pressure from exchange selling.
Additionally, XRP tends to decline more sharply than Bitcoin. Our October 7 analysis put XRP’s 90-day correlation with Bitcoin at 0.89, with a beta of 1.27. Later in October, these figures rose to 0.92 and 1.4, respectively, indicating that XRP moved more exaggeratedly alongside Bitcoin, especially in the absence of favorable news.
Ethereum, on the other hand, offers holders more than just price speculation. Its total value locked (TVL), the dollar amount of cryptocurrencies deposited in various lending and trading applications, stands at $43.5 billion out of a total of $81.2 billion across all blockchain networks, making up about 54%. Ethereum also hosts a significant share of stablecoins, giving users added utility.
XRP Has Lagged Like This Before, With Mixed Results
Previously, on September 28, we noted XRP’s 17% year-to-date decline when Bitcoin was down about 4% and Solana around 3%. At that time, XRP traded near $1.52 and continued to fall, with its 2026 loss now at about 37%, while Bitcoin’s losses were around 13.5%.
In an earlier downturn from July 19 to August 17, XRP fell 8.2%, while Bitcoin dropped just 0.5%. XRP hit its 90-day closing low of $0.99 on August 16 and then rebounded to close at $1.57 on September 22. This recovery coincided with Bitcoin’s upswing, but XRP’s 90-day gain of 12.72% still lagged behind Bitcoin’s 16.77%.
In 2026, XRP seemed to require Bitcoin to rebound first before it could follow suit, yet it hasn’t fully caught up even during those moments.
Will XRP Bridge the Gap With Ethereum?
At this point, it seems unlikely that XRP will close the gap with Ethereum. While Ethereum has successfully attracted deposits into lending and trading apps and saw some ETF buying, XRP has lacked both. A potential rebound might hinge on regaining ETF inflows, and until that happens, XRP may continue to mirror Bitcoin’s price movements in an exaggerated manner.
To determine if a turnaround is on the horizon for XRP, we can monitor two key signals. If XRP ETFs show net inflows for consecutive days and XRP closes above its 200-day average of $1.27, we might see XRP start to recover and potentially pull closer to Ethereum.
Contact [email protected] for any questions or corrections.
Sam Daodu is a crypto analyst and the editor of 24/7 Wall St.'s Crypto Desk, where he covers Bitcoin, XRP, Ethereum, Solana and the altcoins investors search for most. His work focuses on price levels, spot ETF flows, on-chain data and the regulatory decisions that move crypto markets, written so a first-time buyer and a seasoned trader can both use it.
Sam has written about crypto professionally since 2019 and has published more than 2,000 articles. Before joining 24/7 Wall St., he wrote for crypto media outlets and Web3 companies and ghostwrote for crypto founders and token launches. His analysis is syndicated on Yahoo Finance, MSN and AOL and has been cited by other crypto news sites. He also founded MacLabs Marketing, a content and personal branding agency for crypto founders and executives.
When he isn't reading charts, Sam is usually at the gym or watching One Piece, a series he maintains has better tokenomics than most altcoins.