Zcash Dropped 6% in a Day, the Most in the Top 50. Does Its $1,030 Support Hold?
Zcash sellers hit almost alone while Bitcoin and Ethereum barely moved, and no hack or delisting explains why. A single ETF and a crowded trade may hold the answer, along with a price floor traders defended twice last month.

This post may contain links from our sponsors and affiliates, and Flywheel Publishing may receive compensation for actions taken through them.

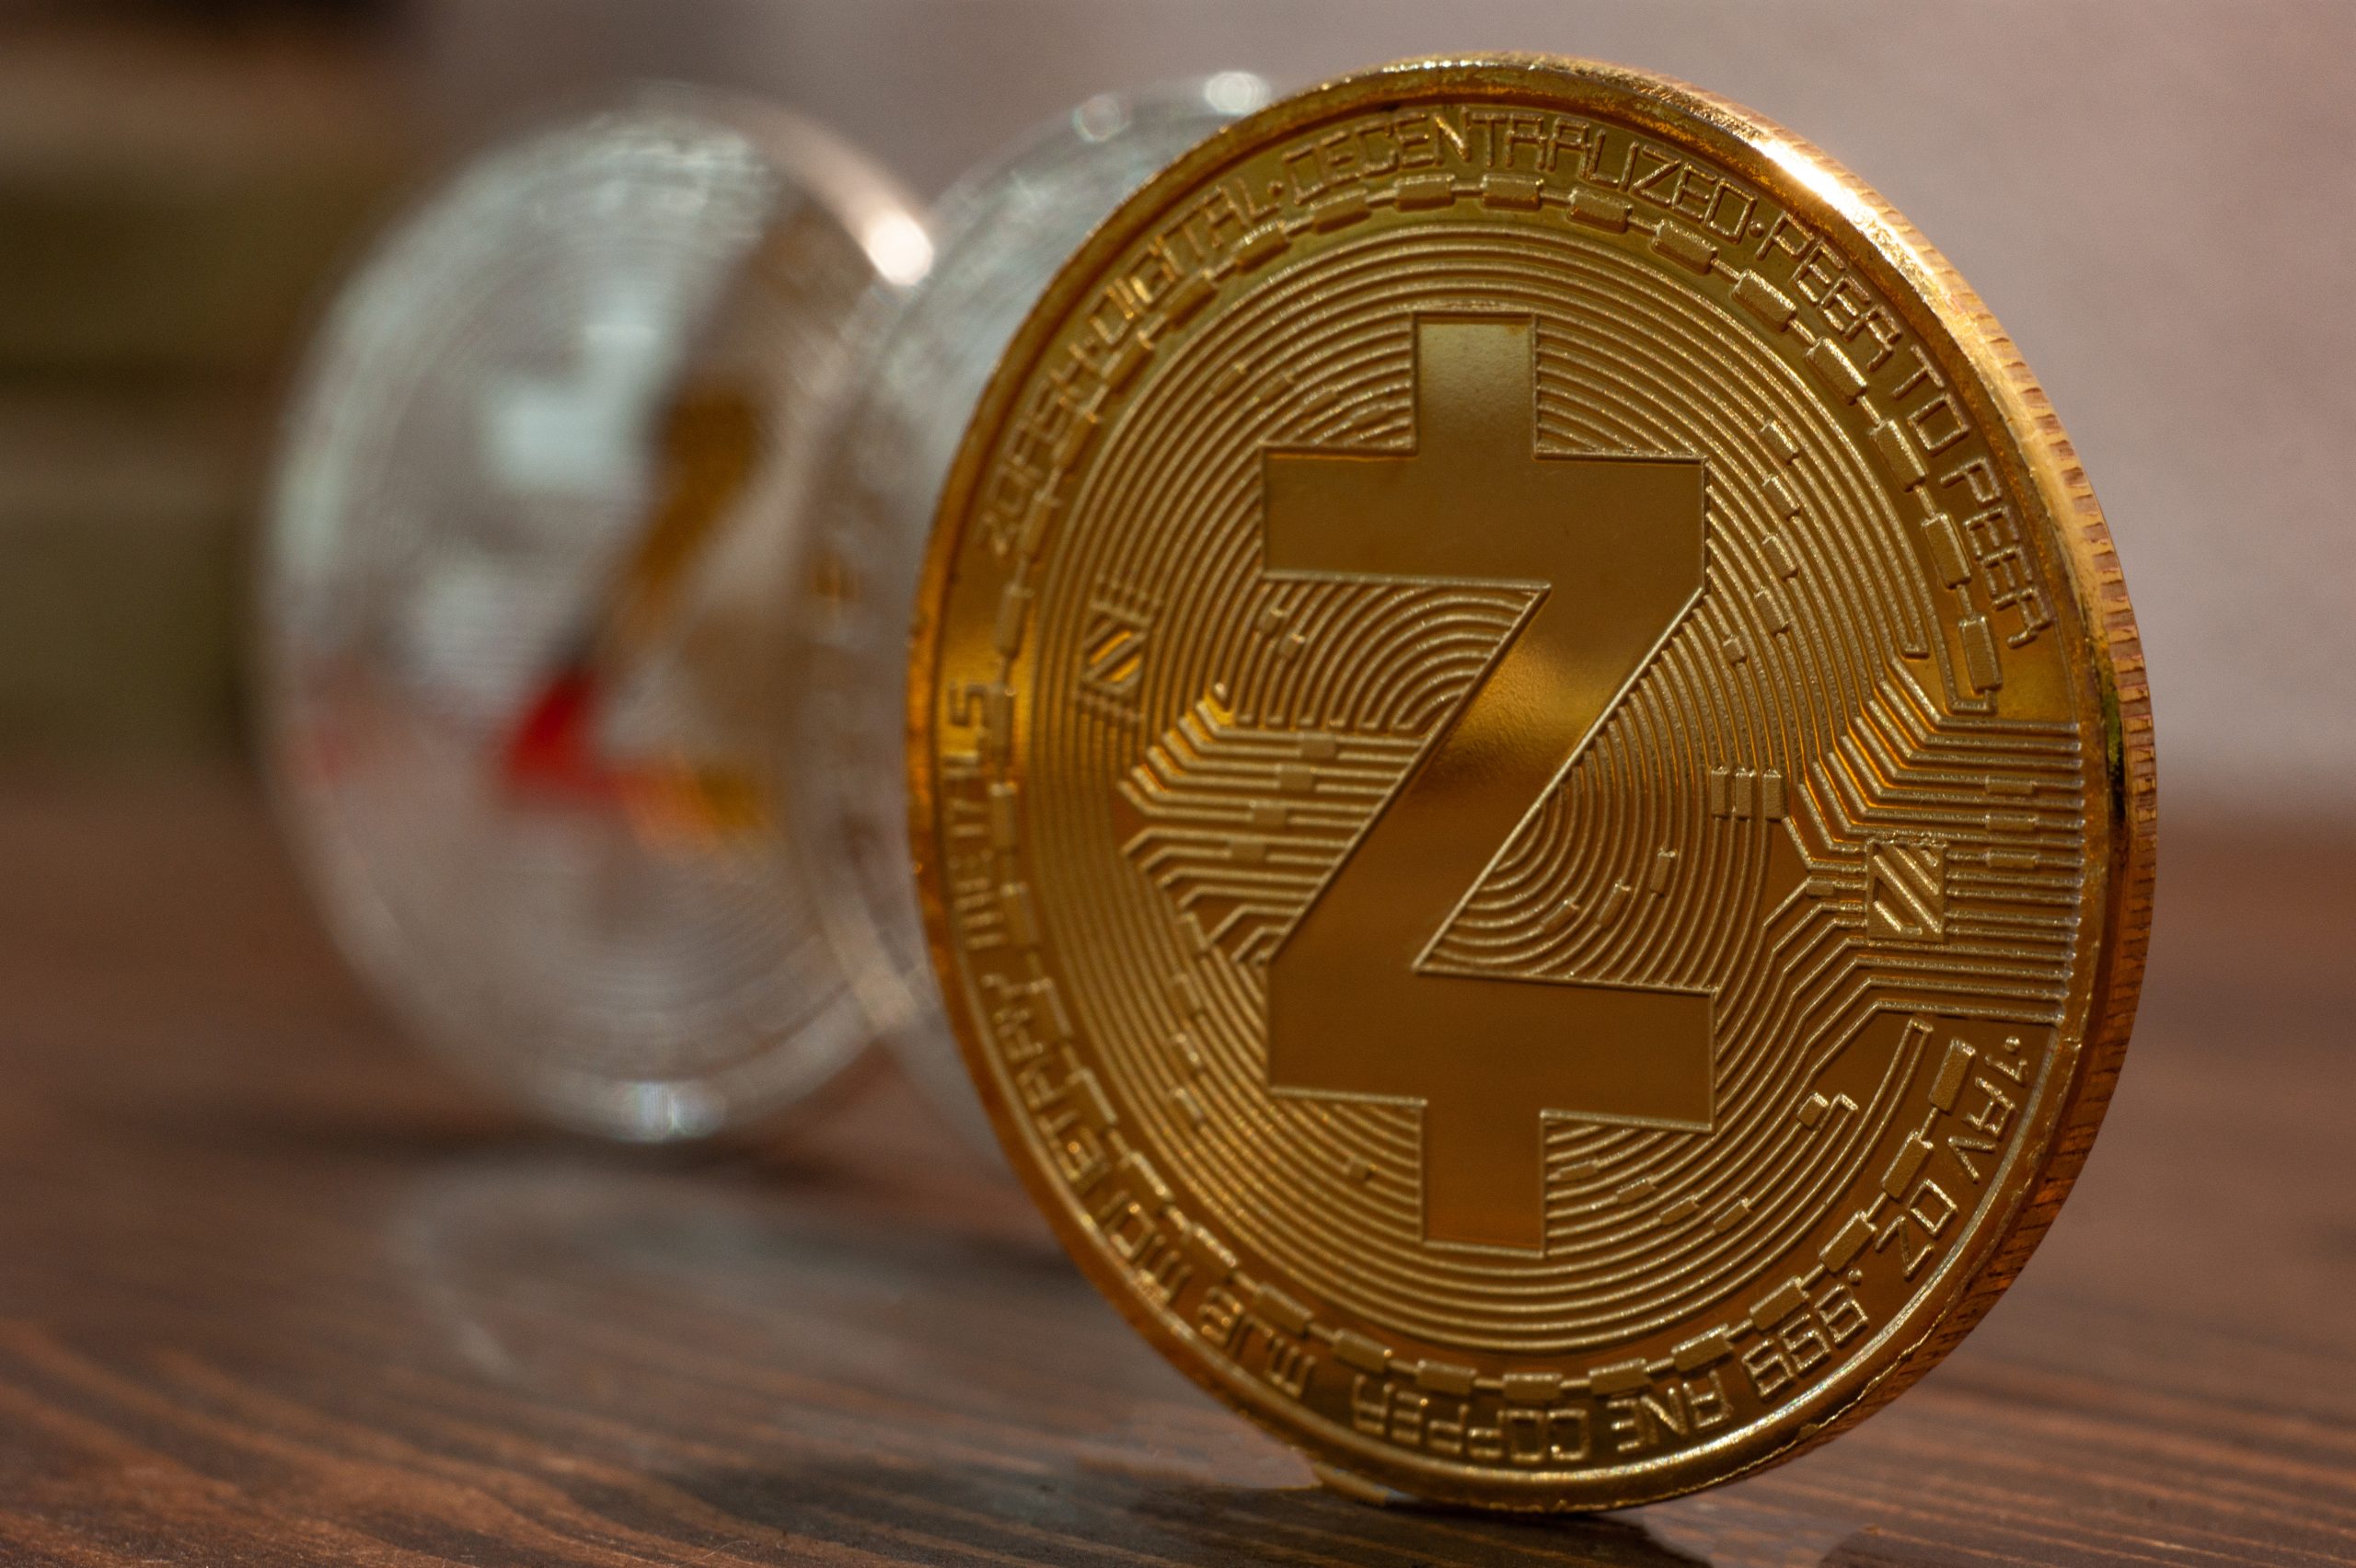
Zcash (CRYPTO:ZEC) dropped 5.6% over the past 24 hours, making it the worst-performing coin in the top 50. As a privacy-focused cryptocurrency, Zcash lets users hide who sent a payment and how much. ZEC is currently trading at $1,264 after hitting an intraday low of $1,249.
This decline marks Zcash’s steepest daily drop since November 2, when it went from an opening price of $1,233 to a closing price of $1,133. Meanwhile, Bitcoin (CRYPTO:BTC) held flat, and Ethereum (CRYPTO:ETH) rose 0.1%, so sellers went after Zcash almost alone. So what led to this drop, and can Zcash’s $1,030 support hold?
ETF Outflows and a Weak Bitcoin Pushed Zcash Lower

Zcash had no major news today, such as a hack or a delisting, to explain the drop. That points to trader positioning, meaning how much ZEC traders already own and how willing they are to sell.
The main pressure came from the Grayscale Zcash ETF (NYSEARCA:ZCSH), a U.S. fund that holds ZEC for its investors. On November 5, the fund saw $11 million in outflows, and ETF outflows like that typically force a fund to sell coins to meet withdrawals. The following day, the fund received only $1.8 million in new money, barely denting those outflows.
Bitcoin is struggling too. It closed on November 6 at its lowest price in 30 days and has dropped 6.3% over the last two weeks. Bitcoin ETFs have had heavy selling stretches before, including when they lost $731 million in two days in October. When Bitcoin falters, traders often sell riskier altcoins like Zcash first.
Profit-taking, where traders sell to lock in gains, adds to the pressure. ZEC has surged 94.6% over the past year, while Bitcoin has lost 26.6%, so Zcash holders have more gains to protect. General interest in Zcash is waning too, with weekly Wikipedia page views down 24.5%, from 1,117 to 843.
A Top Trader’s $1,030 Support Zone Held Firm Through October

Respected crypto trader Ansem (@blknoiz06) identified $1,030 to $1,100 as ZEC’s key support zone on November 6. He put resistance between $1,370 and $1,440. Support levels are areas where buyers have historically stepped in, while resistance levels are where sellers have. ZEC is trading about 13% above the upper end of this support zone.
October’s trading shows why traders are confident in this support. ZEC dipped to $1,072 on October 15 and closed at $1,220. It then hit a low of $1,048 on October 18 and closed at $1,129, so buyers defended the range twice.
Sellers have shown similar strength at resistance. ZEC peaked at $1,450 on October 1, then hit $1,397 on October 29 and $1,385 on November 6 before closing at $1,321. Currently, ZEC has reached a high of $1,362, just short of the resistance band, before sellers took charge for the rest of the session.
Moving averages show the average closing price over a set number of days. ZEC is currently below its 50-day average of $1,316 but above its 20-day average of $1,237, and far above its 200-day average of $766. During the heaviest trading hour on November 7, ZEC hit its low of $1,249, but later hourly closes stayed above it.
Why Zcash May Be the First Coin Traders Sell
Zcash tends to make bigger moves than the broader market, and riskier coins like this are often sold first when traders turn cautious. Its 94.6% gain over the past year attracted momentum buyers who can leave as quickly as they came in. In contrast, Bitcoin holders are dealing with losses, which limits their incentive to sell during tense markets.
The limited number of Zcash ETFs makes sell-offs heavier. Bitcoin and Ethereum have multiple U.S. ETFs drawing in money, so an outflow from one fund has less impact. Zcash relies solely on the Grayscale fund, which began trading in August, so the $11 million outflow carries more weight against ZEC’s lower trading volume.
With no Zcash-specific news behind this drop, it looks like traders are exiting a crowded trade, a coin that many bought at the same time, while Zcash’s network and privacy features remain intact. Sell-offs driven by crowded trades typically fade once the nervous holders are out. Our look at Zcash’s earlier parabolic run shows how quickly those crowds can form.
Will Zcash’s $1,030 Support Level Hold?
Based on recent trading, ZEC could hold above $1,030 on its first test, since buyers defended this zone twice in October and the project has not reported any issues. Even so, that resilience depends on steady inflows returning to the Grayscale fund and on Bitcoin stabilizing after its 30-day low. Bitcoin’s post-midterm jump earlier this month already faded.
The bearish view remains valid. Should the Grayscale fund see another outflow like the one on November 5 while Bitcoin keeps falling, ZEC may quickly drop below $1,100, as support zones often attract fewer buyers each time they are tested. A daily close below $1,030 would mean October’s support has failed, while a close back above the $1,316 50-day average would mark this drop as a one-day shakeout.
Contact [email protected] for any questions or corrections.
Sam Daodu is a crypto analyst and the editor of 24/7 Wall St.'s Crypto Desk, where he covers Bitcoin, XRP, Ethereum, Solana and the altcoins investors search for most. His work focuses on price levels, spot ETF flows, on-chain data and the regulatory decisions that move crypto markets, written so a first-time buyer and a seasoned trader can both use it.
Sam has written about crypto professionally since 2019 and has published more than 2,000 articles. Before joining 24/7 Wall St., he wrote for crypto media outlets and Web3 companies and ghostwrote for crypto founders and token launches. His analysis is syndicated on Yahoo Finance, MSN and AOL and has been cited by other crypto news sites. He also founded MacLabs Marketing, a content and personal branding agency for crypto founders and executives.
When he isn't reading charts, Sam is usually at the gym or watching One Piece, a series he maintains has better tokenomics than most altcoins.