70% of Altcoins Now Trade Below Their 200-Day Average After a $200 Billion Loss. Is Altcoin Season Off for 2026?
Bitcoin holds its long-term uptrend while most altcoins have lost theirs, and a handful of oddball coins keep climbing anyway. What do the survivors know, and what would it take for the rotation traders keep waiting for to begin?

This post may contain links from our sponsors and affiliates, and Flywheel Publishing may receive compensation for actions taken through them.

Altcoins have lost roughly $200 billion in market value, and 70% of the altcoins listed on Binance now trade below their 200-day moving average, according to a CryptoQuant analyst’s post on November 7, 2026. This moving average is a coin’s average closing price over the past 200 days, and traders use it to separate long-term uptrends from downtrends.
The rest of the market looks just as heavy. Total market value has fallen to $2.53 trillion after a 3.6% drop in a single day, while Bitcoin’s (CRYPTO:BTC) dominance, its share of that total, has climbed to 60%.
Bitcoin trades at $75,697, above its 200-day average of $73,194, so it has kept its long-term uptrend while most other coins have lost theirs. So does this imbalance mean the selling has run its course, or is altcoin season over for 2026?
Rising Bitcoin Dominance Points Away From Altcoin Season

Altcoin season refers to periods when most altcoins beat Bitcoin. The Altcoin Season Index tracks how many top coins outperform Bitcoin over 90 days, and traders call it altcoin season only when a large majority are ahead.
Bitcoin dominance shows the same thing from a money-flow perspective. When traders move funds from Bitcoin into altcoins, Bitcoin’s share falls, which is why a sliding dominance number is usually the first sign of altcoin season. Instead, dominance has risen to 60%, up from 59.5% in our October 28 article on whether altcoin season is still possible, after it briefly dipped below 60% in September.
Ethereum (CRYPTO:ETH) holds 10.7% of the total market, while all coins except Bitcoin make up around $1.01 trillion. These figures show money flowing into Bitcoin while the rest of the market loses value.
Traders often view washouts like this as potential bottoms, since most holders who wanted to sell have already done so, leaving fewer sellers on any rebound. However, past cycles show that this only holds when new money flows in after the selling ends.
Why the 70% Washout Signal Is Weaker Than It Looks

The CryptoQuant count gives each altcoin listed on Binance equal weight, so lightly traded tokens count the same as major coins like Ethereum. The 70% figure shows how widespread the downturn is, but it says little about how much money those coins represent.
The 200-day moving average is also slow to respond, since it averages more than six months of prices. Ethena (CRYPTO:ENA), the token behind a synthetic-dollar protocol, has dropped 28.9% over 30 days and 16.5% over the last week. Yet it trades at $0.1529, above its $0.13 200-day average, keeping it on the “healthy” side despite recent losses.
In contrast, Cardano (CRYPTO:ADA) trades at $0.1791, below its 200-day average of $0.21, after a 26.3% decline over the past month and a 46.3% drop since the start of 2026.
The $200 billion figure has limits, too. It reflects the drop in value across all coins, which isn’t the same as cash leaving the market. Like the moving-average count, it tracks price alone and can’t show who is buying.
A Few Coins Are Defying the Trend
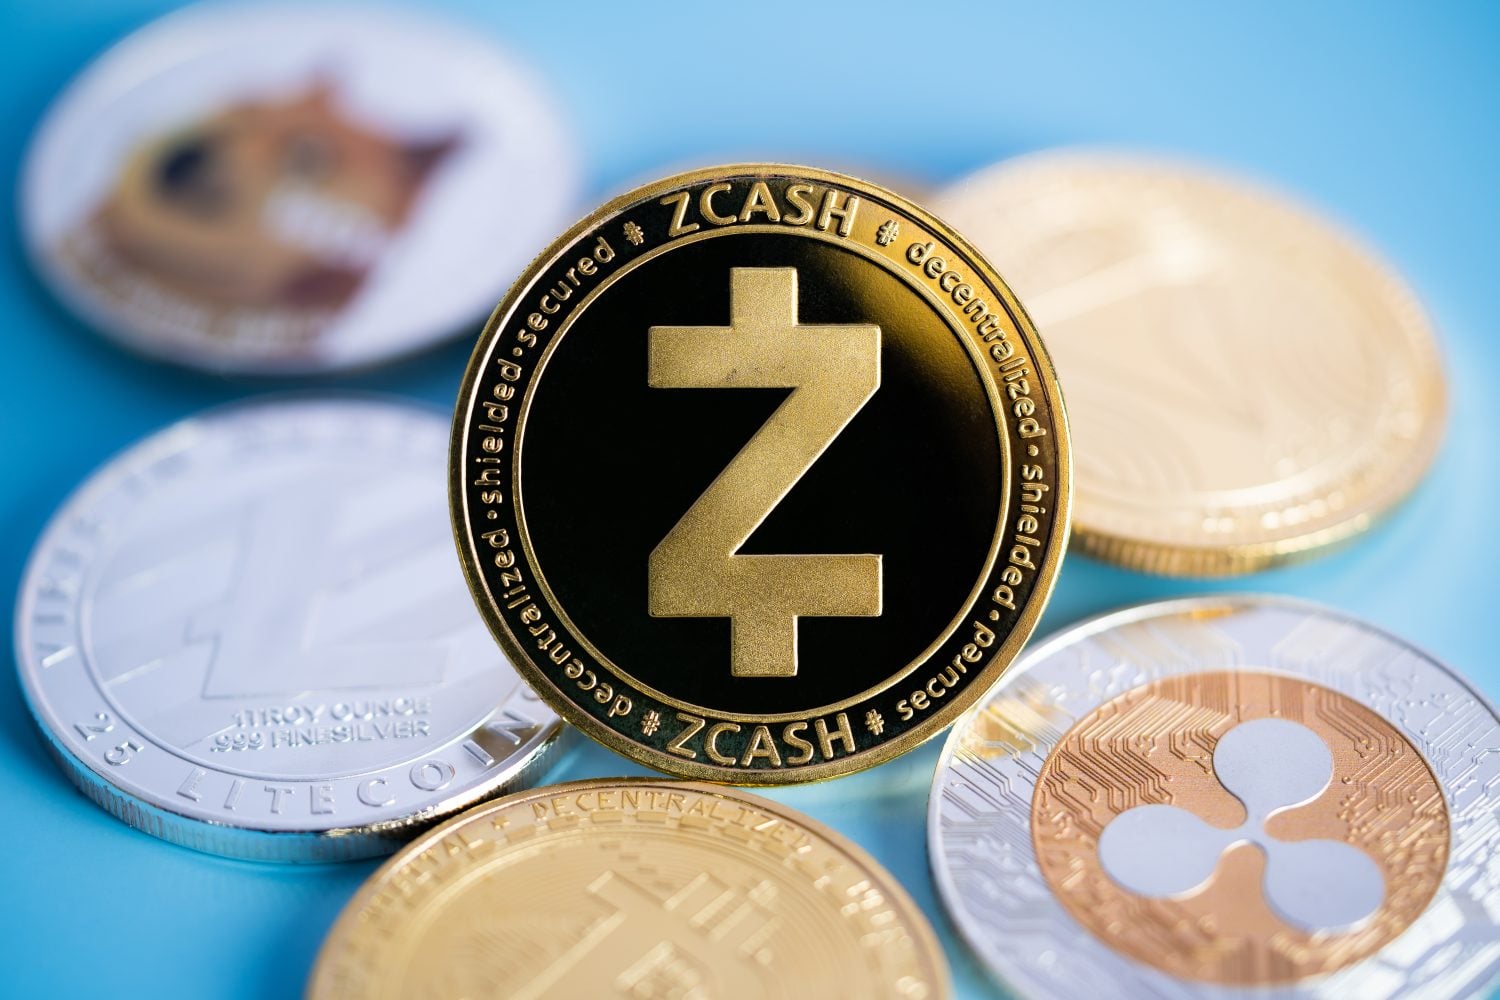
Despite the downturn, only a handful of top-50 coins gained through November 8. Pepe (CRYPTO:PEPE) rose 2.4%, TRON (CRYPTO:TRX) 2.2%, Monero (CRYPTO:XMR) 1.4% and Zcash (CRYPTO:ZEC) 1.3%, while Quant (CRYPTO:QNT) stayed nearly flat with a 1.3% dip.
Each winner has its own driver. Zcash and Monero are privacy coins, TRON carries heavy stablecoin traffic, and Pepe trades on meme momentum, as we noted when Monero and TRON were the only top-20 coins up. Only Zcash has a U.S. spot ETF. ZEC ($1,251 versus $770), Monero ($608 versus $433) and Quant ($199 versus $99) all trade above their 200-day averages, while TRON, at $0.32, remains slightly below its $0.33 average.
However, these isolated gains don’t reflect a broad market trend. The eight altcoins that surged three times more than Bitcoin in October didn’t lead to a wide upward move either.
The last full altcoin season came in 2021, and Bitcoin went first, reaching all-time highs early that year before its dominance peaked in January and money shifted to altcoins. Bitcoin now trades about 40% below its $126,080 all-time high from October 6, 2025, and under its 20-day and 50-day averages of $79,362 and $81,889, so the conditions that led to 2021’s altcoin season are absent.
Is Altcoin Season Over for 2026?
An altcoin season looks unlikely for the rest of 2026, and the 70% reading suggests the crowd has the market right. For altcoin season to start, Bitcoin dominance typically needs to decline, and Bitcoin needs to break out. The market shows the opposite, and with less than two months left in the year, a shift looks hard. Even so, altcoins can change direction quickly, since they tend to surge once a rotation begins.
On flows, Bitcoin dominance would need to fall below 59.5% while altcoins climb above $1.01 trillion, showing money moving out of Bitcoin. On price, Bitcoin must recover its $81,889 50-day average and hold it. If Bitcoin drops below its $73,194 200-day average instead, more than 70% of Binance altcoins could fall below their long-term averages, and altcoin season might slip into 2027.
Contact [email protected] for any questions or corrections.
Sam Daodu is a crypto analyst and the editor of 24/7 Wall St.'s Crypto Desk, where he covers Bitcoin, XRP, Ethereum, Solana and the altcoins investors search for most. His work focuses on price levels, spot ETF flows, on-chain data and the regulatory decisions that move crypto markets, written so a first-time buyer and a seasoned trader can both use it.
Sam has written about crypto professionally since 2019 and has published more than 2,000 articles. Before joining 24/7 Wall St., he wrote for crypto media outlets and Web3 companies and ghostwrote for crypto founders and token launches. His analysis is syndicated on Yahoo Finance, MSN and AOL and has been cited by other crypto news sites. He also founded MacLabs Marketing, a content and personal branding agency for crypto founders and executives.
When he isn't reading charts, Sam is usually at the gym or watching One Piece, a series he maintains has better tokenomics than most altcoins.