ULTY’s 1.24% Fee Quietly Drains $124 Yearly Per $10,000 Invested, Three Times More Than Its Closest Rival
ULTY's weekly paychecks and massive yield look compelling until you trace where that money actually originates and what happens to your account balance once every hidden cost gets layered in.


On December 1, 2025, holders of the YieldMax Ultra Option Income Strategy ETF (NYSEARCA:ULTY) woke up to a 1-for-10 reverse split. Ten shares became one. The share price jumped tenfold overnight, and the chart looked healthier. The money in the account did not change. That single accounting move is the cleanest tell of what this fund quietly costs its owners.
What You’re Actually Paying
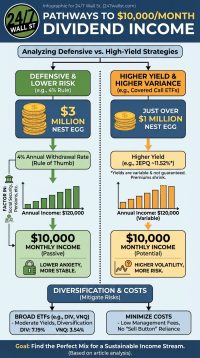
The headline fee is not subtle once you convert it. ULTY carries a gross and net expense ratio of 1.24%. On a $10,000 stake, that is $124 a year skimmed off the top before the options strategy earns a dime. A comparable options-income product like JPMorgan Nasdaq Equity Premium Income runs roughly 0.35%, or about $35 per $10,000. Over 20 years, the fee gap alone, compounded on the same underlying return, can drain thousands from a taxable account.
Now layer that on top of the fund’s actual results. Over the trailing year through July 10, 2026, ULTY’s price is down 3.12%, from $29.57 to $28.65 on a split-adjusted basis. Distributions cushioned that, but the price line tells you where the fee is coming from.
The Part the Factsheet Doesn’t Highlight
The bigger hidden cost is distribution decay. In April 2024, ULTY paid $1.4171 per share. By July 8, 2026, the weekly payment had shrunk to $0.3384. The fund also changed the payment cadence from monthly to weekly in 2026, which keeps the “paycheck” feel intact while each check gets thinner. The trailing 12-month payout totals $15.855339 per share, but the forward annualized rate has already reset to $4.0608. That gap is your run-rate cut in plain sight.
Under the hood, the machinery is expensive to operate. As of the April 30, 2026 NPORT filing, ULTY held 90 positions: 24 equities and 65 derivatives. Sixty-five options lines get rolled on a monthly or weekly cycle, which stacks bid-ask spreads and short-term gains onto every investor. Many YieldMax distributions have historically included return of capital, which is not free money. It reduces your cost basis and can produce a nasty surprise when you sell. The equity book is also a volatility cocktail: Rocket Lab at 7.6%, NuScale Power at 7.3%, Robinhood at 7.1%, Coinbase at 6.3%, CoreWeave at 5.9%, Rigetti Computing at 5.4%, and Quantum Computing at 3.9%. Selling calls against names like these caps your upside on the exact positions people buy the fund to ride.
The Cheaper Mirror
If the goal is options-income exposure to large-cap tech and growth, JPMorgan Nasdaq Equity Premium Income (NASDAQ:JEPQ) delivers a comparable covered-call profile against the Nasdaq-100 at roughly a quarter of ULTY’s fee, with monthly distributions and far deeper liquidity. For a broader equity-income tilt, JPMorgan Equity Premium Income (NYSEARCA:JEPI) runs a similar structure against a lower-volatility U.S. equity book. Neither will chase quantum computing names or crypto proxies, so the trade-off is clear: you give up the concentrated speculative exposure and the eye-catching headline yield, and you keep more of what the strategy actually produces. (For readers pulling income from ETFs, our research briefing Dividend Traps walks through the payout patterns that tend to hide NAV erosion.)
What This Means for You
ULTY has paid, and $2.48 billion in net assets says plenty of investors like the checks. The real question is what the check costs after the 1.24% fee, the option-roll spreads, the tax treatment of return-of-capital distributions, and the reverse-split-adjusted price line. Compare the total return of your ULTY position, distributions reinvested, against a plain covered-call fund and the underlying stocks themselves over the same window. If the gap is uncomfortable, the fund is telling you where the money went.
Contact [email protected] for any questions or corrections.
I am a long time investor and student of business, and believe finding good companies that can become great investments is the best game on earth. After 20 years of writing and researching the public markets it is clear that individuals have never had more tools and information to take control of their financial lives. From ETFs and $0 commissions to cryptos and prediction markets there has never been a greater democratization of access to investing.
I write to help people understand the investments available to them so they can make the best choice for their portfolio, whether they're starting out or looking for income in retirement.