XNTK vs. QQQ: Does a 35-Stock Tech ETF Beat Just Buying the Nasdaq-100?
A 35-stock equal-weight fund has been quietly outrunning the Nasdaq-100 for years, and the structural reason behind that gap changes how you think about building a tech position.

This post may contain links from our sponsors and affiliates, and Flywheel Publishing may receive compensation for actions taken through them.

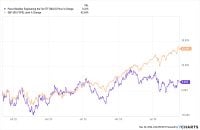
The SPDR NYSE Technology ETF (NYSEARCA:XNTK) and the Invesco QQQ Trust (NASDAQ:QQQ) look like two flavors of the same trade. Both live near the front of the AI rally. Both charge institutional-grade fees. Yet XNTK has returned 51.65% over the past year against QQQ’s 28.43%, and 808.69% over ten years against QQQ’s 536.62%. A 35-stock equal-weight portfolio is beating the Nasdaq-100 badly. The reason matters more than the gap.
What Each Fund Is Actually Betting On
QQQ tracks the Nasdaq-100 and lets market cap decide everything. When Apple grows, its weight grows. When NVIDIA melts up, so does its slice. That mechanic is a bet on mega-cap dominance persisting: the biggest names keep compounding faster than the rest of the index. It also means QQQ carries meaningful non-tech exposure. Costco (NASDAQ:COST | COST Price Prediction) is classified as Consumer Defensive, not technology, and sits inside QQQ alongside healthcare and staples names.
XNTK tracks the NYSE Technology Index: roughly 35 US-listed tech leaders, equal-dollar-weighted and rebalanced quarterly. That structure is two bets stacked. First, pure tech only, no consumer or healthcare drag. Second, breadth over dominance. A mid-tier holding matters as much as the largest holding, and every rebalance trims winners and adds to laggards. In an environment where AI leadership rotates across semis, software, and hyperscalers, that reset has captured more of the move than cap-weighting has.
Where The Divergence Shows Up
The AI beneficiaries prove the point. NVIDIA (NASDAQ:NVDA) sits at a $5.1 trillion market cap and has run 929% over five years. QQQ owns it heavily by design. XNTK owns it at roughly the same weight as everything else, and pairs it with Broadcom (NASDAQ:AVGO), up 775.99% over five years, and Palantir (NASDAQ:PLTR), up 503.15%. Equal-weighting gives those winners real portfolio impact.
The trade-off shows in stress. During 2022, XNTK fell 41.78% while QQQ dropped 33.71%. Concentrated tech gets hit harder when rates spike. And single names can still hurt XNTK: Microsoft (NASDAQ:MSFT) is down 21.69% over the past year even as most of tech surged.
The Practical Comparison
| Metric | XNTK | QQQ |
|---|---|---|
| Expense ratio | 0.35% | ~0.20% (industry standard) |
| Holdings | ~35, equal-weight | ~100, cap-weight |
| YTD 2026 return | +28.94% | +15.86% |
| 2022 drawdown | -41.78% | -33.71% |
| Forward annual dividend | $0.81 | $3.25 |
QQQ costs less, distributes more income, and includes ballast from names like Costco that soften pure-tech shocks. XNTK costs more, yields almost nothing, and delivers a purer, more concentrated tech bet with a forced quarterly rebalance.
The Verdict
XNTK fits an investor who already believes tech will keep leading, wants that thesis expressed cleanly, and can stomach a deeper 2022-style drawdown when tech breaks. The equal-weight reset is the real edge: it monetizes rotation inside tech instead of letting one or two mega-caps dictate returns. QQQ fits an investor who wants low-cost exposure to the largest Nasdaq names with some non-tech diversification and better tax and income characteristics. If leadership narrows back to a handful of trillion-dollar names, QQQ’s cap-weight will start winning again. Until then, XNTK’s structure is doing more work.
Contact [email protected] for any questions or corrections.
After 15 years on Wall Street with 7 of them as Director of Corporate and Municipal Bond Trading for a NYSE member firm, I started my own project and corporate finance consultancy. Much of the work involves writing business plans, presentations, white papers and marketing materials for companies seeking budgetary allocations for spinoffs and new initiatives or for raising capital for expansion or startup companies and entrepreneurs. On financial topics, I have been published under my own byline at The Motley Fool, 247wallst.com, DealFlow Events’ Healthcare Services Investment Newsletter and The Microcap Newsletter, among others. Additionally, I have done freelance ghostwriting writing and editing for several financial websites, such as Seeking Alpha and Shmoop Financial. I have also written and been published on a variety of other topics from music, audiophile sound and film to musical instrument history, martial arts, and current events. Publications include Copper Magazine, Fidelity (Germany), Blasting News, Inside Kung-Fu, and other periodicals.