FBT and IBB Are Not the Same Biotech Bet, and 5 Years of Returns Prove It
Most biotech investors treat FBT and IBB as two names for the same trade, but the structural differences buried in their index methodologies have produced shockingly different outcomes depending on where the market's momentum actually lives.

This post may contain links from our sponsors and affiliates, and Flywheel Publishing may receive compensation for actions taken through them.

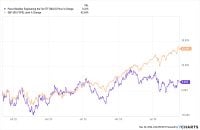
Biotech investors picking between the First Trust NYSE Arca Biotechnology Index Fund (NYSEARCA:FBT) and the iShares Biotechnology ETF (NASDAQ:IBB) often treat them as interchangeable proxies for the same sector. In practice, they behave very differently. One equal-weights roughly 30 biotech names and rebalances quarterly. The other concentrates almost 30% of its assets in four mega-cap drugmakers. That single design choice has driven a return gap of more than 34 percentage points over the past five years.
What Each Fund Is Actually Betting On
FBT tracks the NYSE Arca Biotechnology Index, an equal-dollar-weighted basket rebalanced quarterly. Every constituent gets roughly the same slice on rebalance day, which means a $2 billion clinical-stage name carries the same weight as a $150 billion cash-flow machine. The implicit bet is that innovation and pipeline breakouts, not incumbent scale, drive biotech returns. FBT wins when small and mid-cap biotech participates broadly and when M&A premiums flow to the middle of the market.
IBB takes the opposite view. Its cap-weighted index puts 8.1% in Vertex Pharmaceuticals, 7.8% in Amgen, 6.8% in Gilead Sciences, and 4.9% in Regeneron. That is a bet on scale: durable cash flows, approved franchises, and the balance-sheet firepower to acquire pipelines rather than build them. IBB behaves more like a defensive healthcare fund with biotech branding, while FBT behaves like a leveraged bet on the discovery cycle.
Where the Difference Shows Up
Recent performance shows the equal-weight design paying off. Year to date through July 24, 2026, FBT has returned 18.0% versus 11.5% for IBB. Over one year, FBT is up 49.2% against 38.9% for IBB.
The gap widens dramatically at longer horizons. Over five years, FBT returned 47.1% while IBB managed just 12.9%. Over 10 years, FBT delivered 146.8% versus 95.0% for IBB. IBB’s mega-cap tilt cushioned the 2021 to 2023 biotech drawdown, but it also muted the recovery. FBT’s equal-weight construction was punished harder on the way down and rewarded much more on the way back up.
The Practical Comparison
| Metric | FBT | IBB |
|---|---|---|
| Methodology | Equal-weight, quarterly rebalance | Modified market-cap weighted |
| Top holding weight | Roughly equal across constituents | Vertex at 8.1% |
| Expense ratio | Higher (First Trust indexed funds typically near 0.55%) | 0.44% |
| YTD 2026 | 18.0% | 11.5% |
| 5-year return | 47.1% | 12.9% |
| 10-year return | 146.8% | 95.0% |
The Verdict
For a retirement-focused investor who wants biotech exposure without wild swings, IBB is the cleaner fit. Its lower 44-basis-point fee, mega-cap ballast, and lower drawdown profile behave more like a healthcare sleeve than a venture bet. Investors willing to accept sharper volatility in exchange for exposure to the full biotech innovation cycle have been rewarded meaningfully more by FBT across every time window measured here.
What would flip the call: a sustained rotation back into large-cap defensives, a pricing-reform shock that punishes clinical-stage names, or an FDA slowdown. In any of those environments, IBB’s concentration in profitable incumbents becomes the feature rather than the bug.
Contact [email protected] for any questions or corrections.
Trey has been an editor and author at 24/7 Wall St. for more than a decade, where he has published thousands of articles analyzing corporate earnings, dividend stocks, short interest, insider buying, private equity, and market trends. His comprehensive coverage spans the full spectrum of financial markets, from blue-chip stalwarts to emerging growth companies.
Beyond 24/7 Wall St., Trey has created and edited financial content for Benzinga and AOL's BloggingStocks, contributing additional hundreds of articles to the investment community.
Trey's editorial expertise extends across multiple publishing environments. He served as production editor at Dearborn Financial Publishing and development editor at Kaplan, where he helped shape financial education materials. Earlier in his career, he worked as a writer-producer at SVE. His freelance editing portfolio includes work for prestigious clients such as Sage Publications, Rand McNally, the Institute for Supply Management, the American Library Association, Eggplant Literary Productions, and Spiegel.
Outside of financial journalism, Trey writes fiction and has been an active member of the writing community for years, moderating workshop sessions at regional conventions.