This 0.06%-Fee Dividend ETF Is Beating the S&P 500 by 16% YTD Without Owning a Single Magnificent Seven Stock
A dirt-cheap dividend ETF built around profitable, cash-generating companies has quietly turned 2026's market narrative upside down, and its secret has nothing to do with chasing yield.

This post may contain links from our sponsors and affiliates, and Flywheel Publishing may receive compensation for actions taken through them.
Investors have spent much of 2026 talking about a potential style rotation. Large-cap growth stocks are still positive year to date, but their leadership has weakened as small-cap and, increasingly, value stocks have taken over more of the market’s momentum.
One major beneficiary has been the Schwab U.S. Dividend Equity ETF (SCHD). The name says “dividend,” but I think that undersells what the ETF actually does. Its screening methodology provides multifaceted exposure to both quality and value factors, with dividends serving as the starting point rather than the entire strategy.
The results this year have been impressive. According to Testfolio’s backtesting tool, SCHD had generated a 28.99% cumulative return through Sept. 1. The SPDR S&P 500 ETF Trust (SPY) returned 12.31% over the same period. That’s a performance gap of nearly 17 percentage points.
Importantly, SCHD accomplished this without owning a single Magnificent Seven stock. That’s a useful reminder of how quickly market leadership can change. For years, investors were rewarded for concentrating more heavily in the largest growth companies.
In 2026, a portfolio built around profitable, dividend-paying companies trading at more modest valuations has been rewarded instead. So let’s break down how SCHD selects those companies, where its portfolio differs most dramatically from the S&P 500, and which sector exposures have helped drive this year’s outperformance.
What Is SCHD?
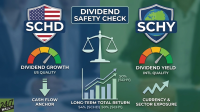
SCHD tracks the Dow Jones U.S. Dividend 100 Index. The process begins by requiring eligible stocks to have at least 10 consecutive years of dividend payments. From there, the heavier lifting comes from a composite score based on four fundamental variables:
- Free cash flow to total debt: Measures how much cash a company generates relative to its debt burden. Higher free cash flow and lower leverage can provide more room to maintain dividends through difficult economic environments.
- Return on equity: Measures how effectively a company generates profits from shareholders’ equity. Higher return on equity can indicate a more profitable, capital-efficient business.
- Dividend yield: Measures annual dividends relative to the stock price. This gives SCHD its explicit income tilt while allowing the other quality screens to help avoid simply buying the highest-yielding stocks available.
- Five-year dividend growth rate: Rewards companies that have consistently increased their payouts rather than merely maintaining a high current yield.
The 100 highest-ranked stocks ultimately form the index. SCHD rebalances quarterly, but the more consequential event is its annual reconstitution, when companies can enter and exit based on the latest screening results. That can result in surprisingly high turnover for a passive dividend ETF. SCHD’s turnover recently stood at 48.88%. Fortunately, the ETF structure can use in-kind creations and redemptions to limit the realization and distribution of taxable capital gains, making that turnover less problematic for shareholders than it might be inside a traditional mutual fund.
The strategy is also remarkably inexpensive. SCHD charges a 0.06% expense ratio, considerably less than many brand-name factor ETFs attempting to provide similar quality or value exposure. You get a decent income boost as well. SCHD currently has a 3.15% 30-day SEC yield. Its methodology also excludes real estate investment trusts (REITs), whose distributions frequently contain income taxed at ordinary rates, helping SCHD maintain relatively favorable tax characteristics for a dividend strategy.
SCHD vs. the S&P 500
The most interesting thing about SCHD in 2026 is how little it resembles the market it has been beating. According to ETF Research Center, SCHD has just 8% overlap by weight with SPY, with 46 stocks appearing in both portfolios. And SCHD owns none of the Magnificent Seven companies that have driven so much of the S&P 500’s performance in recent years.
The sector allocations help explain the difference. SPY has approximately 28 percentage points more exposure to technology than SCHD. Meanwhile, SCHD has substantial allocations to areas including consumer staples at 14.9%, healthcare at 12.2%, and energy at 12.1%. Those sectors tend to contain mature businesses generating substantial free cash flow while trading at lower valuations than the largest technology and growth companies. That’s precisely the type of exposure that becomes valuable when market leadership rotates away from expensive growth.
It’s also why I wouldn’t dismiss dividend ETFs simply because total return ultimately matters more than yield. That’s absolutely true, but a dividend screen can serve a second purpose. When combined with profitability, leverage, and dividend-growth metrics, as SCHD does, it becomes a relatively inexpensive way of obtaining systematic exposure to quality and value. At 0.06% annually, SCHD provides that factor exposure for considerably less than many specialized smart-beta ETFs, while its 3.15% SEC yield provides some additional income along the way.
Whether this year’s rotation continues is impossible to know. Factor leadership can reverse quickly, and SCHD will inevitably experience periods when growth-heavy benchmarks outperform it again. But 2026 has provided a good example of why maintaining exposure to fundamentally different parts of the market can pay off.
Contact [email protected] for any questions or corrections.
Tony Dong is the founder of ETF Portfolio Blueprint. He also serves as Lead ETF Analyst for ETF Central, a partnership between Trackinsight and the NYSE.
Tony’s work focuses on ETF strategy, portfolio construction, and risk management, with an emphasis on making complex investment concepts accessible to everyday investors. His insights and analysis have also appeared in U.S. News & World Report, Kiplinger, MoneySense, and The Motley Fool.
Tony holds a Master of Science degree in enterprise risk management from Columbia University and the Certified ETF Advisor (CETF) designation from The ETF Institute.