Two Dividend ETFs Quietly Beating SCHD on Total Return Since 2022
SCHD earns its reputation as a dividend investor favorite, but two lesser-known ETFs have quietly left it behind since 2022, and their outperformance comes from a source most dividend investors tend to avoid.

This post may contain links from our sponsors and affiliates, and Flywheel Publishing may receive compensation for actions taken through them.

The Schwab U.S. Dividend Equity ETF (SCHD) continues to be one of my favorite dividend ETFs. For an expense ratio of just 0.06%, investors get a portfolio of 100 companies that have paid regular dividends for at least 10 consecutive years. Those companies are then ranked using quality metrics including free cash flow to total debt, return on equity, dividend yield, and five-year dividend growth before being weighted into the portfolio.
SCHD isn’t perfect, though. Its underlying index has a few quirks. Portfolio turnover is fairly high, with roughly 42% of holdings changing each year as companies enter and leave the index. While its current 30-day SEC yield of 3.33% remains attractive and tax efficient thanks in part to excluding REITs, total returns can be somewhat boom or bust depending on whether the value factor is in favor or not.
If you’re looking for a dividend ETF that’s a bit more all-weather, there are two funds that have outperformed SCHD since early 2022. According to testfolio, over the 4.35-year period from February 2022 through July 2, 2026, SCHD delivered a cumulative total return of 52.21%. Over that same period, one alternative from Fidelity returned 83.72%, while the other from Capital Group gained 112.63%. Past performance never guarantees future results, but they’re both worth considering.
Fidelity High Dividend ETF (FDVV)
The Fidelity High Dividend ETF (FDVV) tracks the Fidelity High Dividend Index, a proprietary benchmark that emphasizes companies expected to continue paying and growing their dividends rather than simply screening for today’s highest yields.
Top holdings include Nvidia, Apple, Microsoft, Broadcom, and Alphabet. Although these companies generally have modest dividend yields, their strong earnings growth and substantial cash generation have translated into meaningful dividend growth alongside significant share price appreciation.
The result is a portfolio that still provides a respectable 2.73% 30-day SEC yield while maintaining much greater exposure to large-cap technology companies than SCHD. That exposure has been a major driver behind FDVV’s stronger total return versus SCHD, even after accounting for its higher 0.15% expense ratio.
Capital Group Dividend Value ETF (CGDV)
The Capital Group Dividend Value ETF (CGDV) takes a completely different approach. Rather than tracking an index, it is actively managed using Capital Group’s multi-manager system, where several portfolio managers independently oversee portions of the portfolio.
The fund’s objective is intentionally flexible. Rather than maximizing current yield, managers seek companies offering above-average dividend income alongside attractive valuations. The portfolio may also invest up to 10% in large-cap international companies.
One interesting characteristic is that despite being actively managed, turnover sits at just 24%, well below SCHD’s nearly 42%. The portfolio is also considerably more concentrated, holding only 52 stocks. Morningstar classifies CGDV as a large-blend fund rather than the large-value style occupied by SCHD.
That flexibility has allowed managers to own lower-yielding but faster-growing dividend payers such as Microsoft, Nvidia, Broadcom, Alphabet, and Meta Platforms. Those holdings have contributed meaningfully to the fund’s stronger total return since 2022.
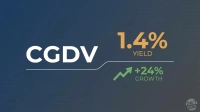
The trade-off is cost and income. At 0.33%, CGDV carries the highest expense ratio of the three funds, although that remains reasonable for an actively managed ETF. It’s 30-day SEC yield of 1.32% is also the lowest of this trio, but again, total return matters more.
Contact [email protected] for any questions or corrections.
Tony Dong is the founder of ETF Portfolio Blueprint. He also serves as Lead ETF Analyst for ETF Central, a partnership between Trackinsight and the NYSE.
Tony’s work focuses on ETF strategy, portfolio construction, and risk management, with an emphasis on making complex investment concepts accessible to everyday investors. His insights and analysis have also appeared in U.S. News & World Report, Kiplinger, MoneySense, and The Motley Fool.
Tony holds a Master of Science degree in enterprise risk management from Columbia University and the Certified ETF Advisor (CETF) designation from The ETF Institute.