JEPQ Held Up Better in All 9 Down Months and Trailed in 11 of 15 Up Months. The Two-Year Score: 39.97% vs. 53.25%
Month by month scoring of two years reveals that covered call funds keep their promise on the downside, but the upside tells a story the standard pitch glosses over entirely.

This post may contain links from our sponsors and affiliates, and Flywheel Publishing may receive compensation for actions taken through them.

Covered call funds come with a simple promise. You exchange some potential upside for option income that can cushion losses. Most coverage repeats that promise. We scored it month by month for two years. Both parts held up, but the record shows a hidden cost the pitch leaves out.
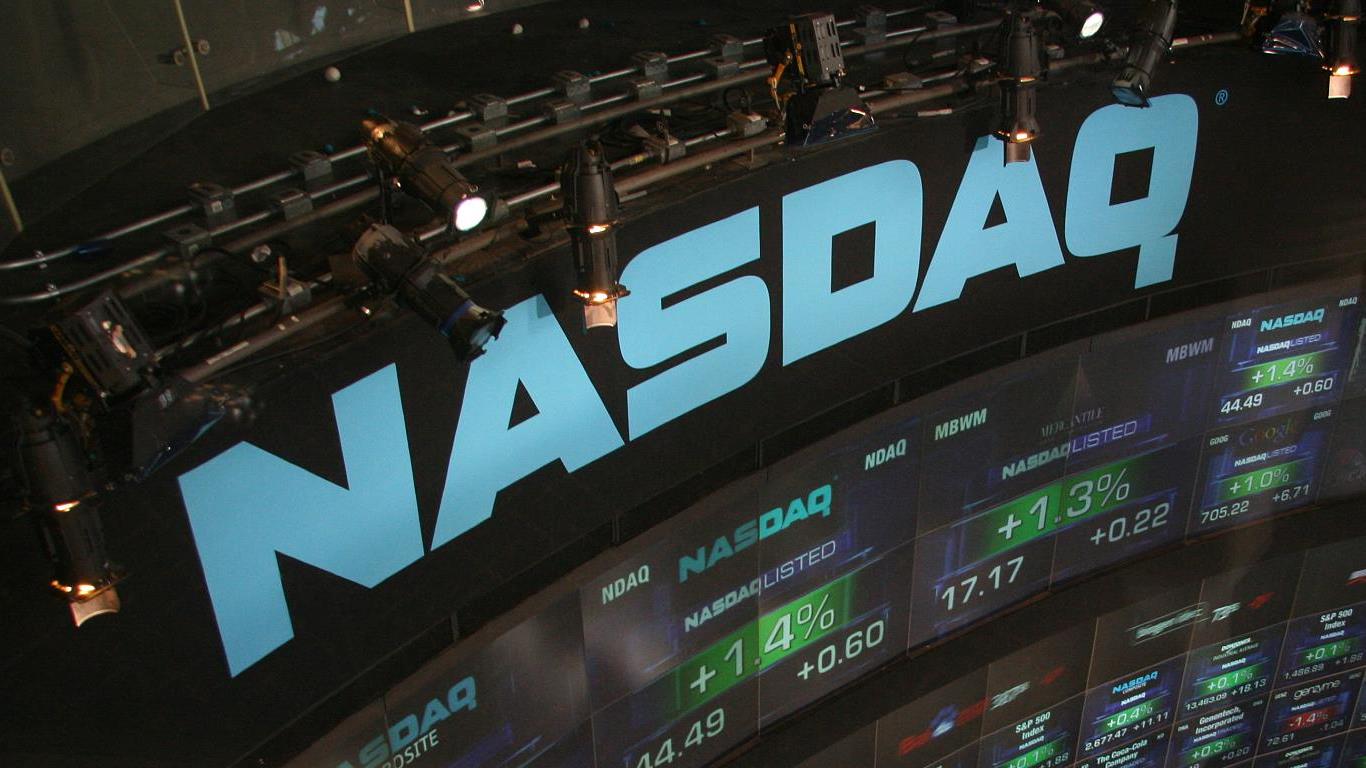
Over the 24 complete months from September 30, 2024 to September 30, 2026, the Invesco NASDAQ 100 ETF (NASDAQ:QQQM) rose in 15 months and fell in 9. The JPMorgan Nasdaq Equity Premium Income ETF (NASDAQ:JEPQ) held up better than QQQM in all 9 down months. However, it trailed QQQM in 11 of the 15 up months. Compounded over the full stretch, JEPQ returned 39.97%. QQQM returned 53.25%.
How We Scored Every Month
QQQM is a fund that tracks the Nasdaq-100 Index, so it serves as the proxy here. Every monthly figure runs from one month-end close to the next on a dividend-adjusted basis. That means each of JEPQ’s monthly distributions already counts in its return. The two-year totals compound those monthly returns. The monthly income check is fully in the score.
JEPQ’s Cushion Held in Every Down Month
The downside protection was real. JEPQ’s biggest save came in July 2026, when QQQM fell 6.5%, and JEPQ slipped 4.22%. That was a 2.28-point advantage. Every time the Nasdaq-100 fund fell in this window, JEPQ fell less.
Upside Cap Took More Than the Cushion Gave Back
In April 2026, QQQM gained 15.69%. JEPQ gained 7.83%. That 7.86-point shortfall was JEPQ’s largest up-month miss of the window.
The biggest save on the downside was 2.28 points. The biggest miss on the upside was 7.86 points. Both the buffer and the cap showed up. They differed in size, and over two years the buffer failed to make up for what the cap took.
JEPQ generates income by selling away part of the upside on its Nasdaq-100 exposure. In falling months, that income cushions the decline. In strong rising months, the fund keeps the income but loses much of the rally. A buffer can only be as large as the income collected, while the gains given up in a sharp rally can run far greater.
Two quieter costs sit on top. JEPQ charges a net expense ratio of 0.35%, according to its October 20, 2026 prospectus data. Option premiums paid out to shareholders are also generally taxed as ordinary income, which can drag on returns in a taxable account. Every figure in this summary is pre-tax.
September 2026 Fit the Pattern
September 2026, the latest complete month, added one more data point. QQQM returned 3.31%. JEPQ returned 2.90%, a figure that includes its $0.68255 per-share distribution with an ex-dividend date of September 1, 2026. It was an up month with a modest trail, the most common result in the record.
Where This Record Could Look Very Different
A two-year stretch in which the Nasdaq-100 fund rose in 15 of 24 months is the setting where this trade-off looks worst. A period with more down months, or more flat months, could score very differently. An investor who values steadier monthly results and income over maximum growth is getting what they paid for. This record makes no forecast about how either fund does from here.
For the same gap measured in dollars over a single year, see our companion one-year comparison of JEPQ and the Nasdaq-100.
Who JEPQ Suits Based on This Scorecard
Simply put, the buffer works. The useful question is which kind of month you expect more of. In months like July 2026, JEPQ came out ahead. In months like April 2026, QQQM won by a much wider margin. The answer depends on which of those months an investor’s plan relies on.
Based on this record, JEPQ fits a retiree who takes monthly income, wants smaller monthly declines, and accepts a lower total return (we laid out how to turn a lump sum into a monthly paycheck, including the mix and the payout calendar, here: The Paycheck Portfolio Method). The record is less favorable for investors counting on Nasdaq-100 growth to build wealth. Over these two years, the cap cost more than the buffer saved.
Contact [email protected] for any questions or corrections.
Ryne Mauck is an investment writer covering exchange-traded funds, retirement planning, and portfolio strategy. Through his work at 24/7 Wall St. and other investment platforms, including Seeking Alpha, he aims to provide clear, research-driven insights that help investors make more informed decisions while maintaining a long-term approach to investing.
Ryne holds a B.Sc. in Finance and an M.A. in Political Science. He is a formerly registered Municipal Advisor Representative and has passed the Series 50, Series 63, and Series 65 exams. His articles are not intended to be, nor should they be interpreted as, financial advice.