The S&P 500 Has a “Pure Value” Version. RPV Gives Its Cheapest Stocks the Biggest Weights

This post may contain links from our sponsors and affiliates, and Flywheel Publishing may receive compensation for actions taken through them.
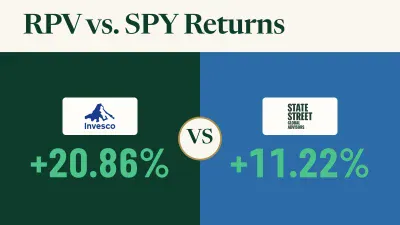
If you own an S&P 500 index fund, your largest positions are the companies that have grown the most. In SPDR S&P 500 ETF Trust (NYSEARCA:SPY), the top holding alone takes 7.58% of assets, and large technology and communications companies fill most of the top 10. A lesser-known version of the same index works the other way around. Invesco S&P 500 Pure Value ETF (NYSEARCA:RPV) picks from the same 500 companies and gives the cheapest ones the biggest weights. This year, that has paid off. RPV is up 20.86% year-to-date, while SPY is up 11.22%.
How Pure Value Turns the S&P 500 Upside Down
The S&P 500 Pure Value Index draws only from S&P 500 members, keeps the stocks with the strongest value characteristics, and weights them by value score rather than by company size. In practice, that means stocks trading at low pricing multiples. The deeper the discount, the larger the position.
The best-known value alternative works differently. iShares S&P 500 Value ETF (NYSEARCA:IVE) mirrors a benchmark of large-capitalization U.S. equities that exhibit value characteristics, but it weights those stocks by market cap. The biggest value companies still lead IVE. In RPV, the cheapest ones lead.
What RPV Owns Right Now
In RPV’s most recent holdings report, dated July 31, 2026, the largest position was Centene (NYSE:CNC | CNC Price Prediction) at 2.53% of net assets. Archer-Daniels-Midland (NYSE:ADM) came next at 2.20%. After those two came another health insurance company at 2.17%, a crop trader at 2.09%, a pharmacy chain at 2.07%, and two Detroit automakers at 2.02% and 1.89%. Further down the list are oil refiners, chemical makers, insurance companies, airlines and utilities.
None of SPY’s tech leaders show up near the top. RPV’s largest position is only about a third the size of SPY’s, so the money is spread across many less-popular companies rather than concentrated in a few giants. The fund held $1.68 billion in net assets.
A Strong Year That Masks a Mixed Decade
| Period | RPV | IVE | SPY |
|---|---|---|---|
| Year to date | 20.86% | 15.29% | 11.22% |
| One year | 24.56% | 15.83% | 10.98% |
| Five years | 69.39% | 71.95% | 62.31% |
| Ten years | 178.45% | 206.22% | 250.16% |
RPV and IVE figures are adjusted for distributions. SPY figures reflect price change only, which understates its total return. Over the past year, RPV led clearly. Over a decade, it trailed both funds.
On cost, IVE charges 0.18%, and SPY charges 0.0945%. RPV is more expensive at 0.35%. RPV pays distributions quarterly, totaling $2.52623 per share over the trailing 12 months, which works out to a yield of about 2.06% at the latest price of $122.73. Payments change from quarter to quarter. In 2025, they ran from $0.54696 to $0.81563.
Risks Retirees Should Weigh Before Going Pure Value
- Sector concentration: Health insurance companies, refiners, chemicals, automakers, and financial firms carry the largest weight, and these groups can stay out of favor for years.
- Value traps: Some stocks are cheap for a reason, such as shrinking profits or legal pressure. A score-weighted index puts more money into the most deeply discounted names, which can include troubled ones.
- Long periods of lagging: The ten-year gap against SPY shows how long a growth-led market can leave pure value behind.
- Uneven income: Distributions change every quarter, so the fund is a poor fit for anyone who needs a fixed payment.
Why Most Investors Have Never Heard of RPV
With $1.68 billion in net assets, RPV is a smaller fund next to the top S&P 500 trackers. Its returns can drift far from the index both ways, so advisors who are measured against the S&P 500 tend to avoid it. Score-based weighting is also harder to explain than market-cap weighting, and most retirement plans offer only the standard value and blend funds.
Who RPV Could Suit
RPV could fit retirees whose portfolios are already heavily invested in the S&P 500’s tech leaders and who want a balance tied to cheap valuations, quarterly income, and an index they already understand. It is a poor fit for investors who cannot stand years of trailing the market or who want a fixed payout. Things to track next: whether the gap in RPV’s favor this year holds up, how its sector mix changes at the next rebalance, and how its expense ratio compares with IVE’s.
Contact [email protected] for any questions or corrections.
Ryne Mauck is an investment writer covering exchange-traded funds, retirement planning, and portfolio strategy. Through his work at 24/7 Wall St. and other investment platforms, including Seeking Alpha, he aims to provide clear, research-driven insights that help investors make more informed decisions while maintaining a long-term approach to investing.
Ryne holds a B.Sc. in Finance and an M.A. in Political Science. He is a formerly registered Municipal Advisor Representative and has passed the Series 50, Series 63, and Series 65 exams. His articles are not intended to be, nor should they be interpreted as, financial advice.