Most Small-Cap Value Funds Weight by Size. RZV Puts the Most Money in the Cheapest Stocks in the S&P 600

This post may contain links from our sponsors and affiliates, and Flywheel Publishing may receive compensation for actions taken through them.
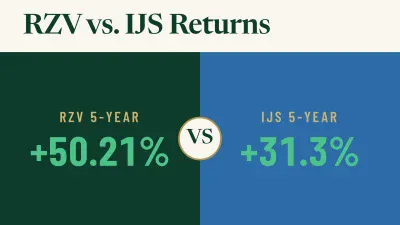
A mainstream small-cap value ETF typically gives its biggest positions to the biggest companies in its value group. The Invesco S&P SmallCap 600 Pure Value ETF (NYSEARCA:RZV) does the opposite. It puts the most money in the cheapest stocks in the S&P SmallCap 600. Over the past five years, that approach returned 50.21%, compared with 31.3% for the much better-known iShares S&P Small-Cap 600 Value ETF (NYSEARCA:IJS).
How RZV Decides Which Stocks Get the Most Money
RZV tracks the S&P SmallCap 600 Pure Value Index. That index draws only from members of the S&P SmallCap 600, keeps the stocks with strong value characteristics, and weights them using a value score. A cheaper stock gets a bigger weight, regardless of the company’s size.
IJS follows the standard S&P SmallCap 600 Value Index, which picks stocks using metrics such as book value and earnings. S&P Dow Jones Indices’ methodology says its regular style indices are float-adjusted market capitalization-weighted or capped market capitalization-weighted, while the Pure Style indices are weighted by style score. S&P research adds that in pure indices, stocks are identified as either pure value or pure growth, so no stock is split between the two camps. In IJS, the largest companies get the most money. That’s how most small-cap value funds work.
What the Cheapness Tilt Puts in Your Portfolio
As of July 31, 2026, RZV’s largest position was Ichor Holdings (NASDAQ:ICHR), a semiconductor equipment supplier, at 2.03%[1] of net assets. Next came ManpowerGroup (NYSE:MAN | MAN Price Prediction) at 1.92%[1] and Acadia Healthcare (NASDAQ:ACHC) at 1.85%.
Further down the top 20, the portfolio tends toward consumer cyclicals: a home products maker, a casual-dining chain, a boat retailer, a used-car retailer, a timeshare operator, and an apparel company. Health care services, oilfield services and exploration companies, and tech hardware distributors fill out much of the rest. These are the corners of the small-cap market where investors can be most pessimistic, and the index weights them heavily because they screen the cheapest.
RZV vs. IJS: Returns, Swings and Cost
| Period | RZV | IJS |
|---|---|---|
| Year to date | 20.57% | 16.83% |
| One year | 24.43% | 21.15% |
| Five years | 50.21% | 31.3% |
| Ten years | 130.73% | 129.69% |
The ten-year figures are close to a tie. RZV built its lead in the last five years, which means it trailed IJS during the first half of that decade. Its moves also run larger. Over the past week, RZV fell 2.29% while IJS dropped 1.77%.
IJS charges a net expense ratio of 0.18%[2]. RZV’s current fee is 0.35%. Over long holding periods, that cost difference can compound.
For income, RZV pays quarterly. Distributions over the trailing 12 months totaled $2.04283 per share, and the latest payment was $0.54464, with an ex-dividend date of September 21, 2026. Recent quarterly payments have ranged from $0.38168 to $0.579, so retirees should expect the checks to vary in size.
Risks to Weigh Before Adding
- Volatility: Small companies tend to swing harder than large ones, and leaning on the cheapest of them can make the moves bigger.
- Value traps: A low price can reflect shrinking earnings or a stretched balance sheet. While some of these companies recover, others stay cheap or get cheaper.
- Sector concentration: Heavy allocation toward consumer cyclicals, energy, and health care services ties results to the economy and consumer spending.
- Long dry periods: As the ten-year numbers show, value can trail for years before it pays off.
Why So Few Investors Have Heard of RZV
RZV had net assets of about $295.7 million as of its July filing[3], which is small by ETF standards. Big platforms and model portfolios usually stick with main funds that have bigger asset bases and heavier trading. The “pure value” label also takes some explaining, and the fund’s sharper moves keep it out of most core allocations.
Who RZV Could Suit as a Satellite Holding
RZV could fit as a small add-on for a retiree who already owns a diversified core portfolio and wants a deeper value tilt than IJS provides. That investor should be comfortable with larger drawdowns and uneven quarterly income. It fits poorly as someone’s only small-cap fund, or for anyone seeking regular payouts and smooth returns. Watch whether RZV keeps its five-year lead if the economy slows, since a downturn would test its deep-value holdings hardest.
Contact [email protected] for any questions or corrections.
Ryne Mauck is an investment writer covering exchange-traded funds, retirement planning, and portfolio strategy. Through his work at 24/7 Wall St. and other investment platforms, including Seeking Alpha, he aims to provide clear, research-driven insights that help investors make more informed decisions while maintaining a long-term approach to investing.
Ryne holds a B.Sc. in Finance and an M.A. in Political Science. He is a formerly registered Municipal Advisor Representative and has passed the Series 50, Series 63, and Series 65 exams. His articles are not intended to be, nor should they be interpreted as, financial advice.