Over the past half-century, U.S. military spending has skyrocketed to levels unimaginable in earlier generations. The amount of money spent on our nation’s military has risen nearly tenfold as global conflicts, technological advancements, and evolving political priorities influence defense strategy. Our national military is now defined as a sprawling, high-cost system backed by cutting-edge weapons, mass deployments, and a constant priority to maintain dominance. Understanding how and why this dramatic growth occurred offers important insight into America’s role globally. It also raises questions about huge budgets, national security, and the long-term effects of maintaining such an enormous military.
24/7 Wall St. identified what the U.S. spent on the military each year over the last 50 years by reviewing data on U.S. military spending from the Stockholm International Peace Research Institute Military Expenditure Database, listing the years 1973-2022. Figures are in current U.S. dollars. We also calculated the percentage change in military spending from the previous year and the spending as a percent of GDP.
This post was updated on December 5, 2025 to provide a brief overview of military spending throughout American history, as well as highlight why this information is important.
Why Are We Covering This?

It’s important to explore the dramatic rise in U.S. military spending because it directly affects everything from national priorities, global influence, and the everyday lives of American citizens. Understanding where trillions of dollars go and how this massive sum contributes to our defense helps the public feel secure. Citizens can evaluate whether current defense spending aligns with today’s security challenges or seems unnecessary and outdated. Increased military spending also influences federal budgets, which dictates what is available for healthcare, education, infrastructure, and social programs. By examining how and why defense costs have grown so much, we can better understand the trade-offs associated with the most expensive military in the world.
Here is a look at U.S. military expenditures over the last 50 years:
1973: $ 81.47 billion
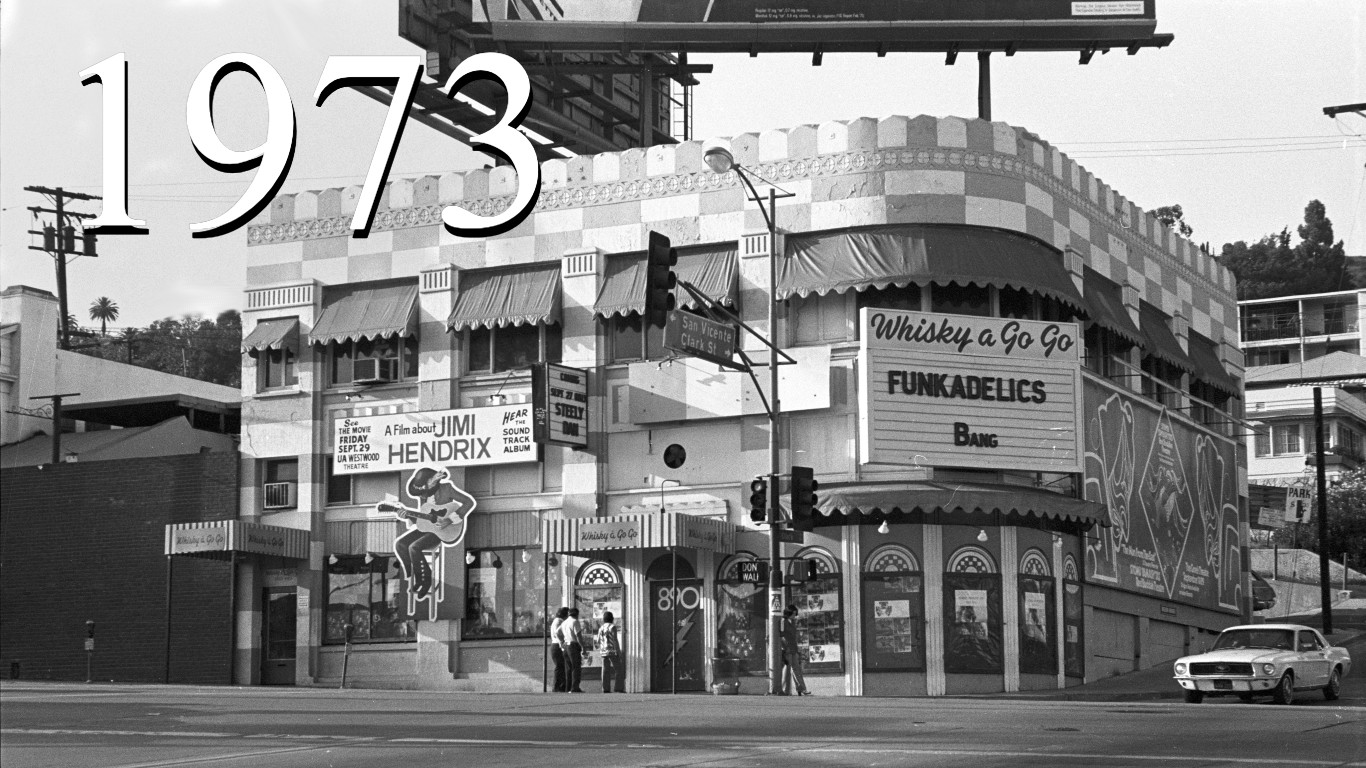
- Percent change in spending: 0.94% – #39 largest year-over-year increase
- Spending as a percent of GDP: 5.89%
1974: $ 89.28 billion
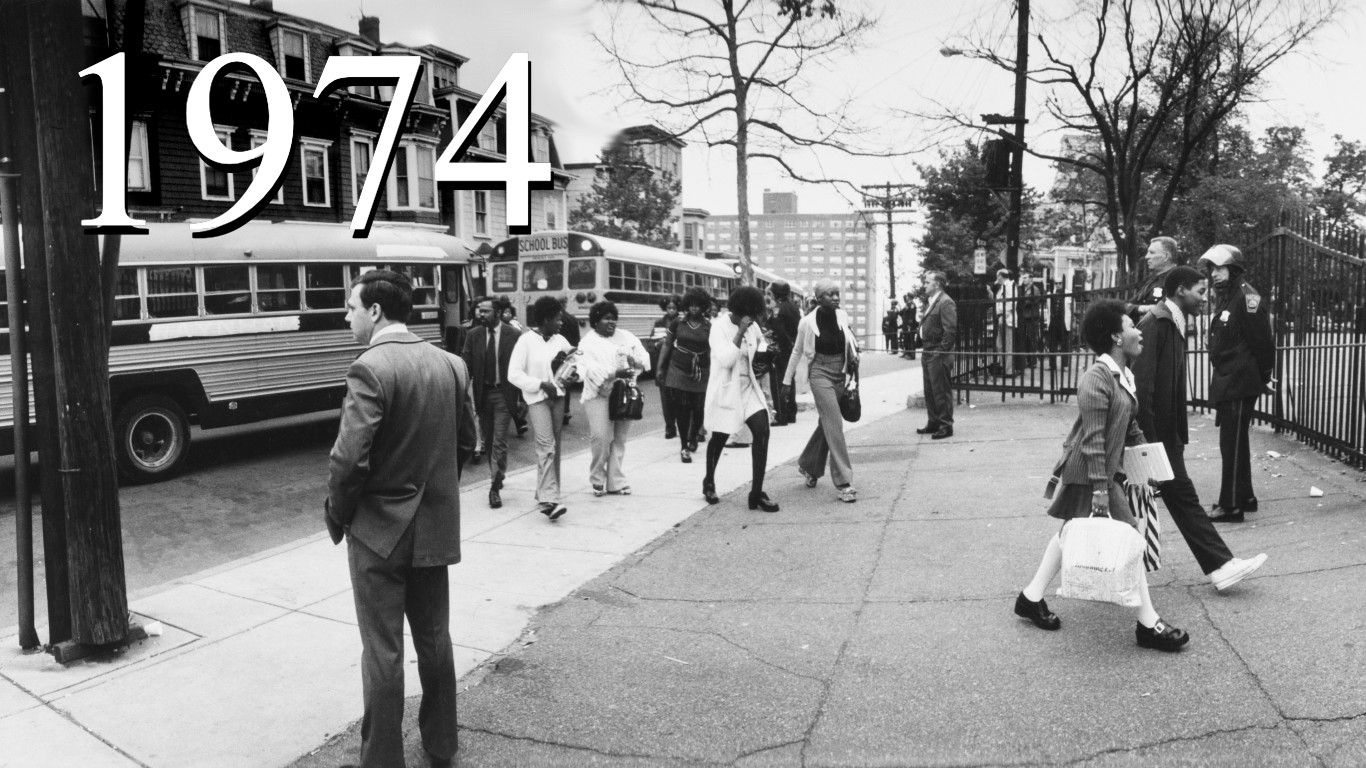
- Percent change in spending: 9.59% – #12 largest year-over-year increase
- Spending as a percent of GDP: 5.95%
1975: $ 92.08 billion
- Percent change in spending: 3.14% – #29 largest year-over-year increase
- Spending as a percent of GDP: 5.62%
1976: $ 94.72 billion
- Percent change in spending: 2.86% – #31 largest year-over-year increase
- Spending as a percent of GDP: 5.19%
1977: $ 104.67 billion
- Percent change in spending: 10.51% – #10 largest year-over-year increase
- Spending as a percent of GDP: 5.16%
1978: $ 113.38 billion
- Percent change in spending: 8.33% – #16 largest year-over-year increase
- Spending as a percent of GDP: 4.94%
1979: $ 126.88 billion

- Percent change in spending: 11.90% – #7 largest year-over-year increase
- Spending as a percent of GDP: 4.95%
1980: $ 143.69 billion
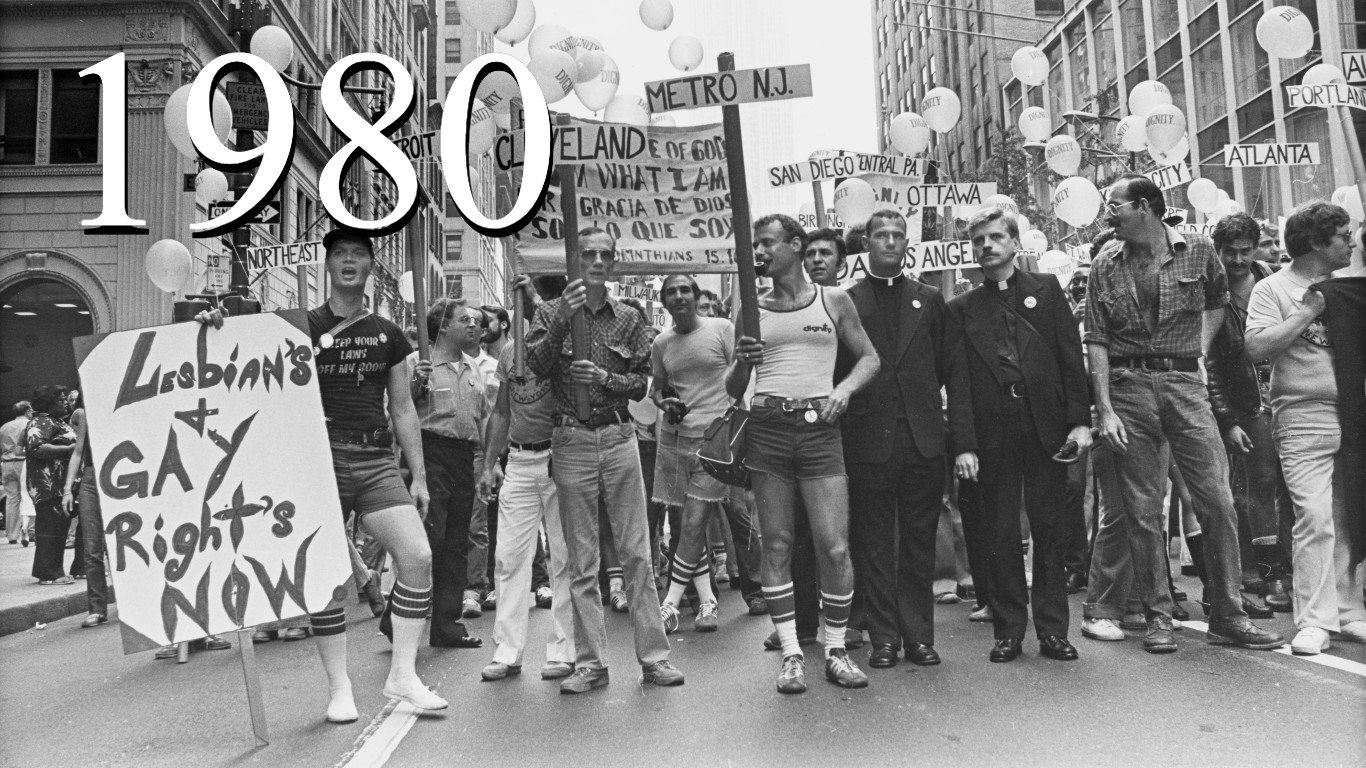
- Percent change in spending: 13.25% – #5 largest year-over-year increase
- Spending as a percent of GDP: 5.15%
1981: $ 176.56 billion
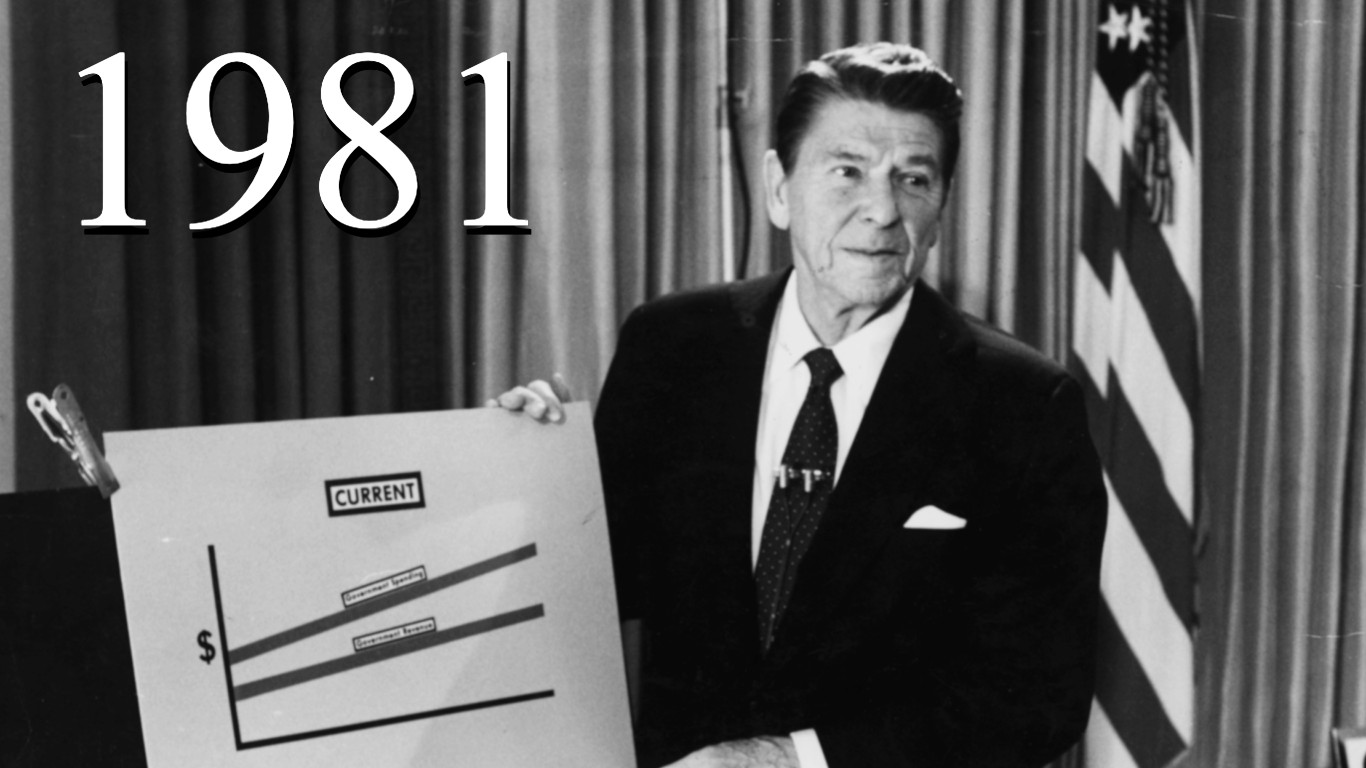
- Percent change in spending: 22.88% – #2 largest year-over-year increase
- Spending as a percent of GDP: 5.65%
1982: $ 221.67 billion
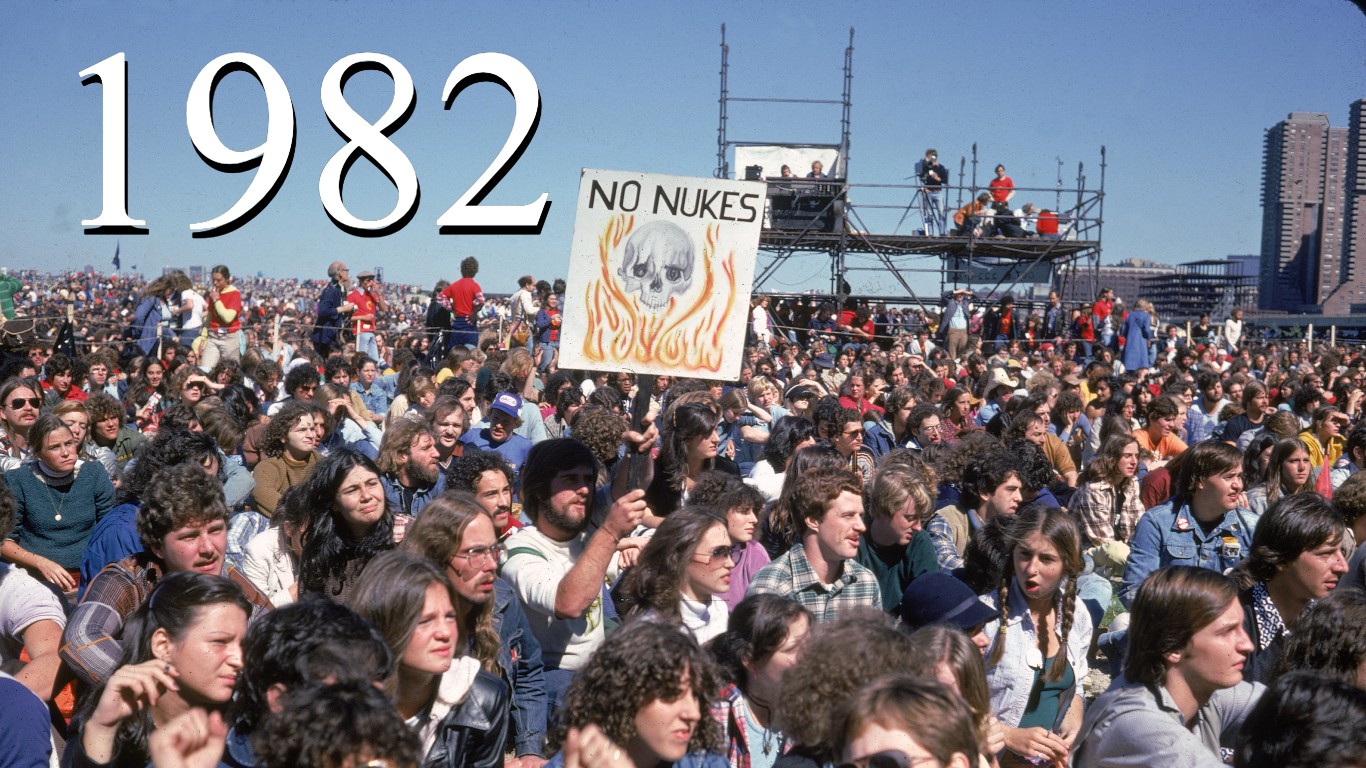
- Percent change in spending: 25.55% – #1 largest year-over-year increase
- Spending as a percent of GDP: 6.81%
1983: $ 223.43 billion
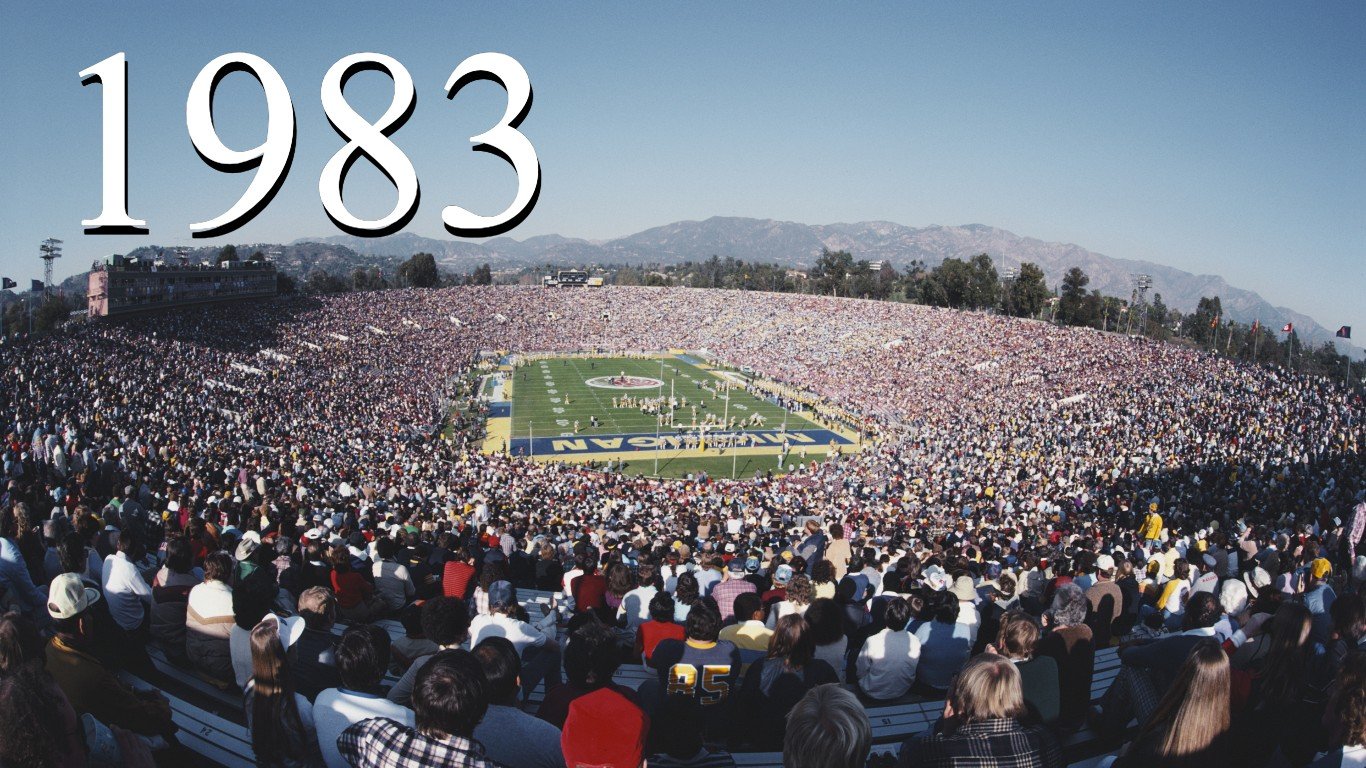
- Percent change in spending: 0.79% – #40 largest year-over-year increase
- Spending as a percent of GDP: 6.32%
1984: $ 245.15 billion
- Percent change in spending: 9.72% – #11 largest year-over-year increase
- Spending as a percent of GDP: 6.24%
1985: $ 272.16 billion
- Percent change in spending: 11.02% – #9 largest year-over-year increase
- Spending as a percent of GDP: 6.45%
1986: $ 295.55 billion
- Percent change in spending: 8.59% – #14 largest year-over-year increase
- Spending as a percent of GDP: 6.63%
1987: $ 304.09 billion
- Percent change in spending: 2.89% – #30 largest year-over-year increase
- Spending as a percent of GDP: 6.42%
1988: $ 309.66 billion
- Percent change in spending: 1.83% – #34 largest year-over-year increase
- Spending as a percent of GDP: 6.07%
1989: $ 321.87 billion
- Percent change in spending: 3.94% – #26 largest year-over-year increase
- Spending as a percent of GDP: 5.87%
1990: $ 325.13 billion
- Percent change in spending: 1.01% – #37 largest year-over-year increase
- Spending as a percent of GDP: 5.61%
1991: $ 299.37 billion
- Percent change in spending: -7.92% – #1 largest year over year decrease
- Spending as a percent of GDP: 4.88%
1992: $ 325.03 billion
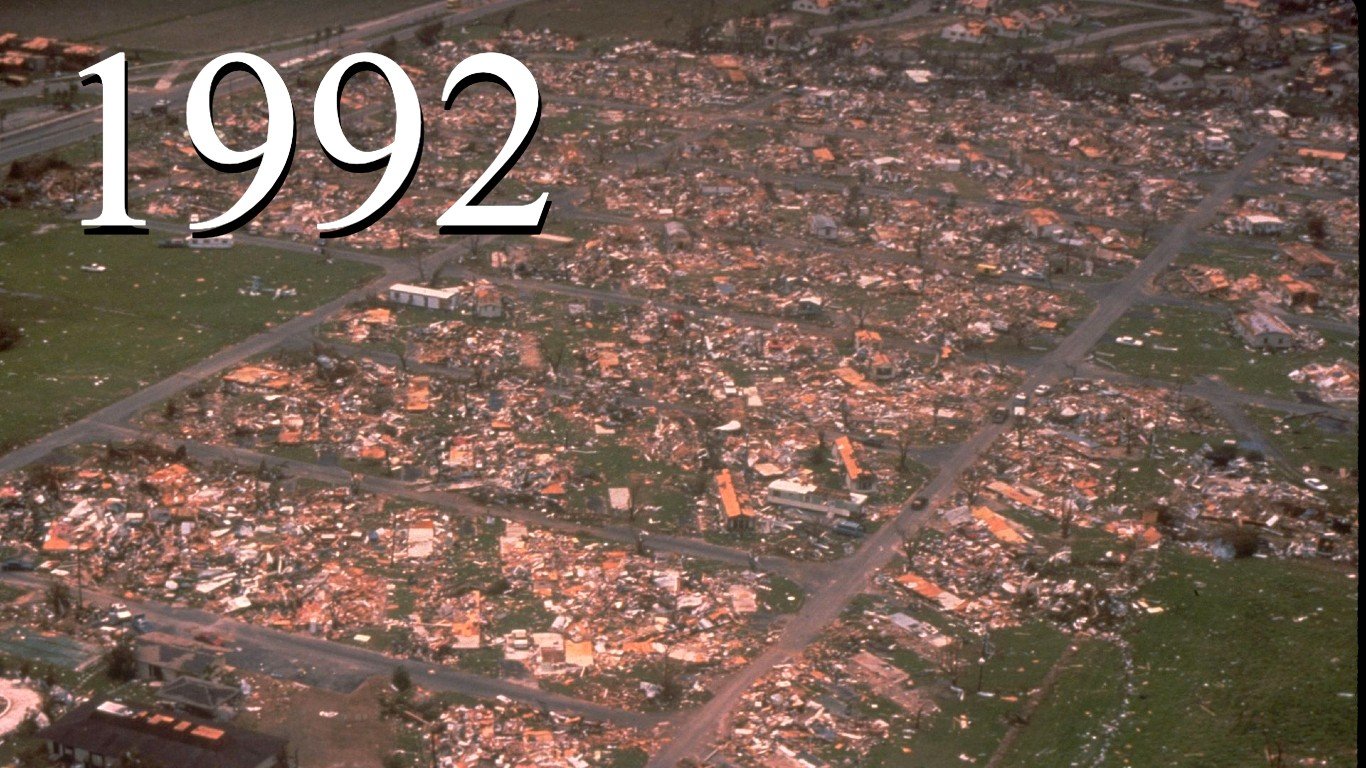
- Percent change in spending: 8.57% – #15 largest year-over-year increase
- Spending as a percent of GDP: 4.97%
1993: $ 316.72 billion

- Percent change in spending: -2.56% – #8 largest year over year decrease
- Spending as a percent of GDP: 4.60%
1994: $ 308.08 billion

- Percent change in spending: -2.73% – #6 largest year over year decrease
- Spending as a percent of GDP: 4.22%
1995: $ 295.85 billion
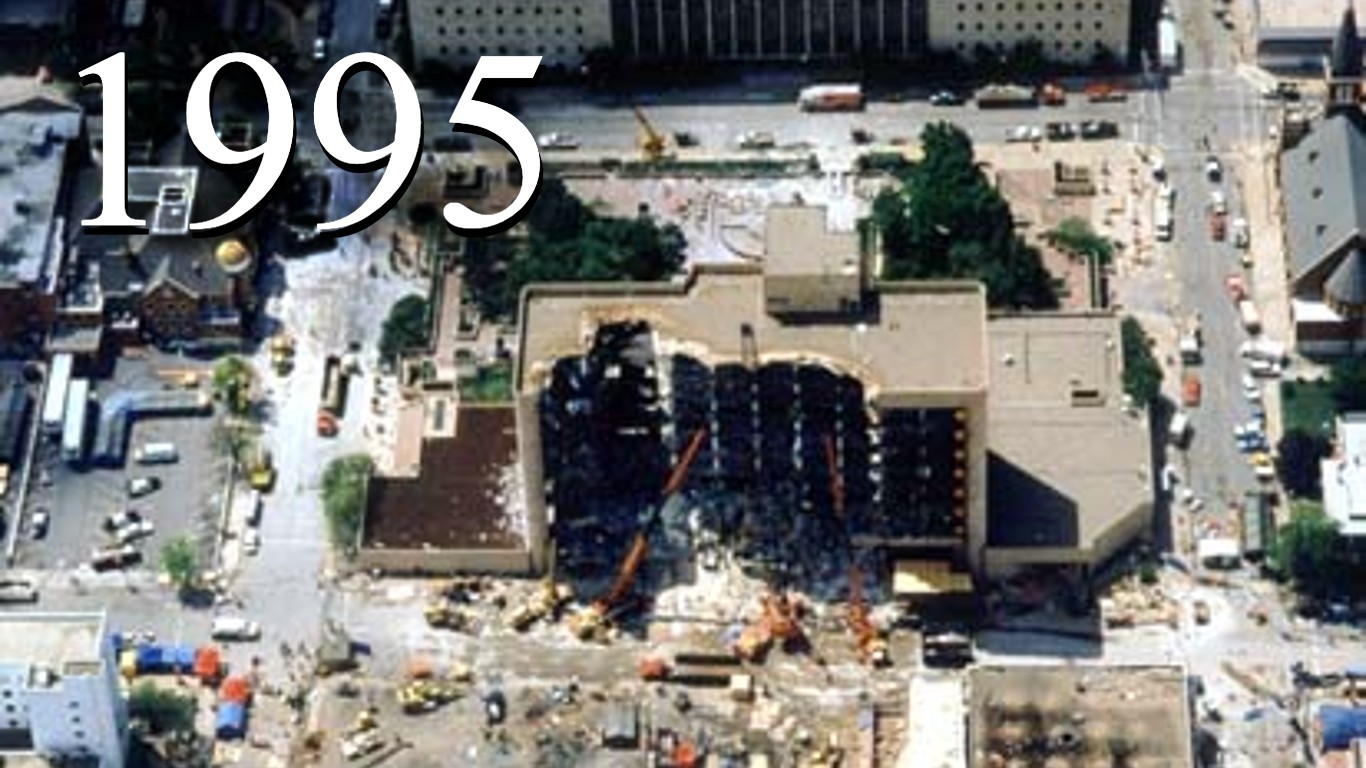
- Percent change in spending: -3.97% – #4 largest year over year decrease
- Spending as a percent of GDP: 3.86%
1996: $ 287.96 billion
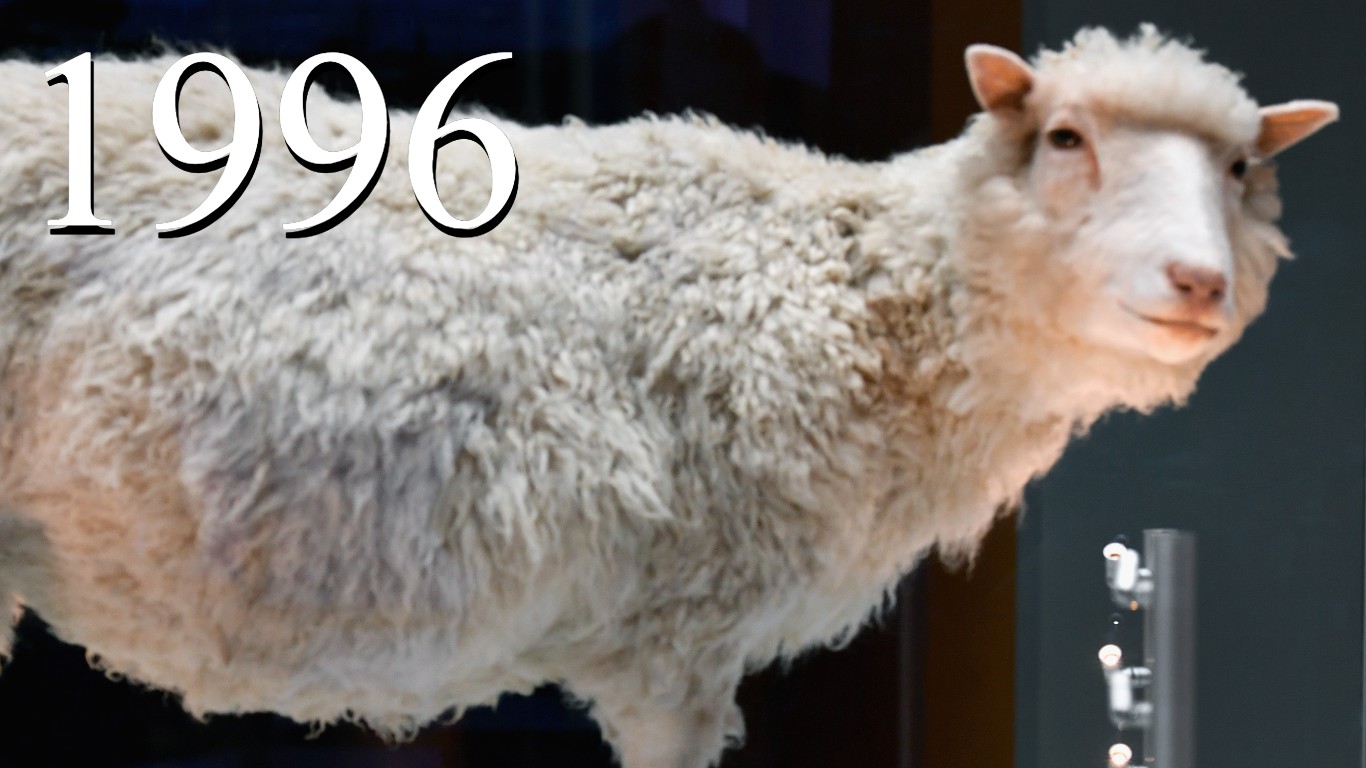
- Percent change in spending: -2.67% – #7 largest year over year decrease
- Spending as a percent of GDP: 3.55%
1997: $ 293.17 billion
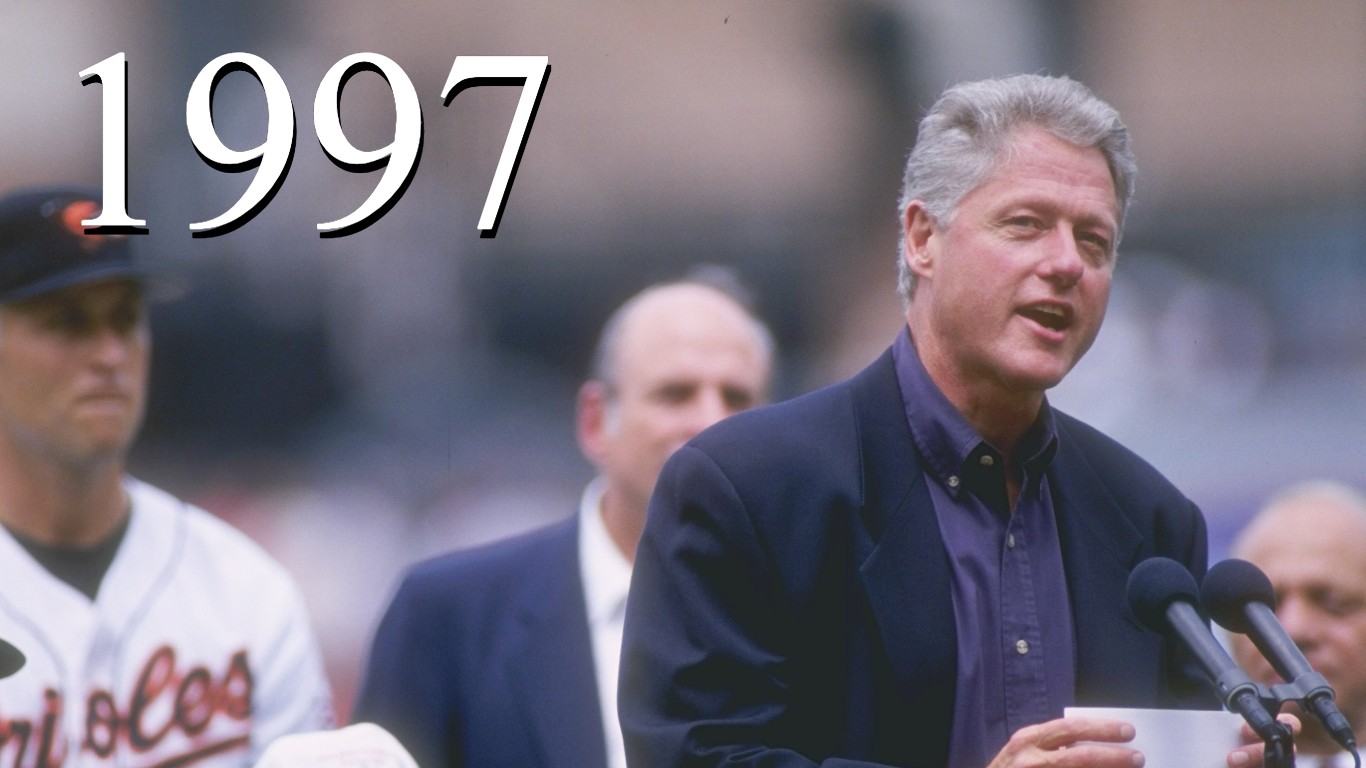
- Percent change in spending: 1.81% – #35 largest year-over-year increase
- Spending as a percent of GDP: 3.41%
1998: $ 291.00 billion
- Percent change in spending: -0.74% – #10 largest year over year decrease
- Spending as a percent of GDP: 3.20%
1999: $ 298.09 billion
- Percent change in spending: 2.44% – #32 largest year-over-year increase
- Spending as a percent of GDP: 3.09%
2000: $ 320.09 billion
- Percent change in spending: 7.38% – #20 largest year-over-year increase
- Spending as a percent of GDP: 3.11%
2001: $ 331.81 billion
- Percent change in spending: 3.66% – #27 largest year-over-year increase
- Spending as a percent of GDP: 3.12%
2002: $ 378.46 billion
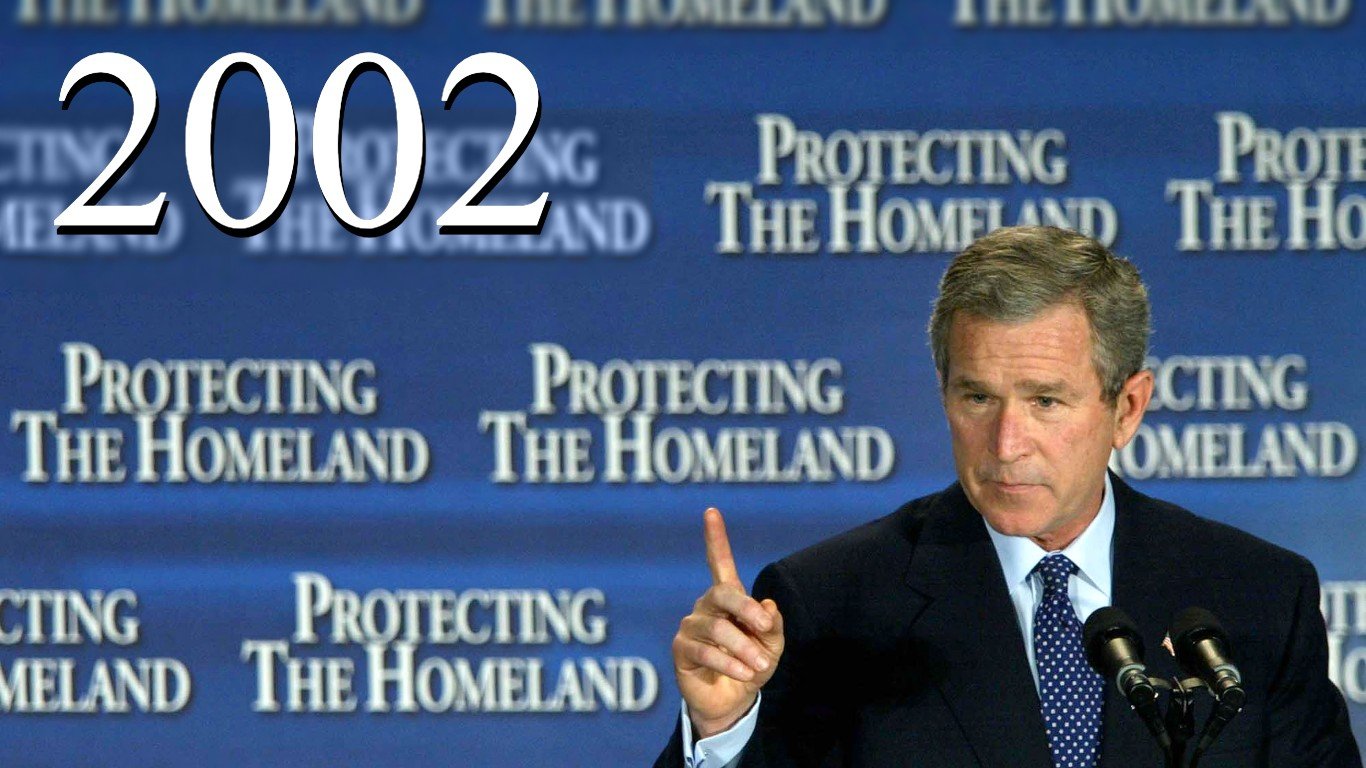
- Percent change in spending: 14.06% – #4 largest year-over-year increase
- Spending as a percent of GDP: 3.45%
2003: $ 440.53 billion
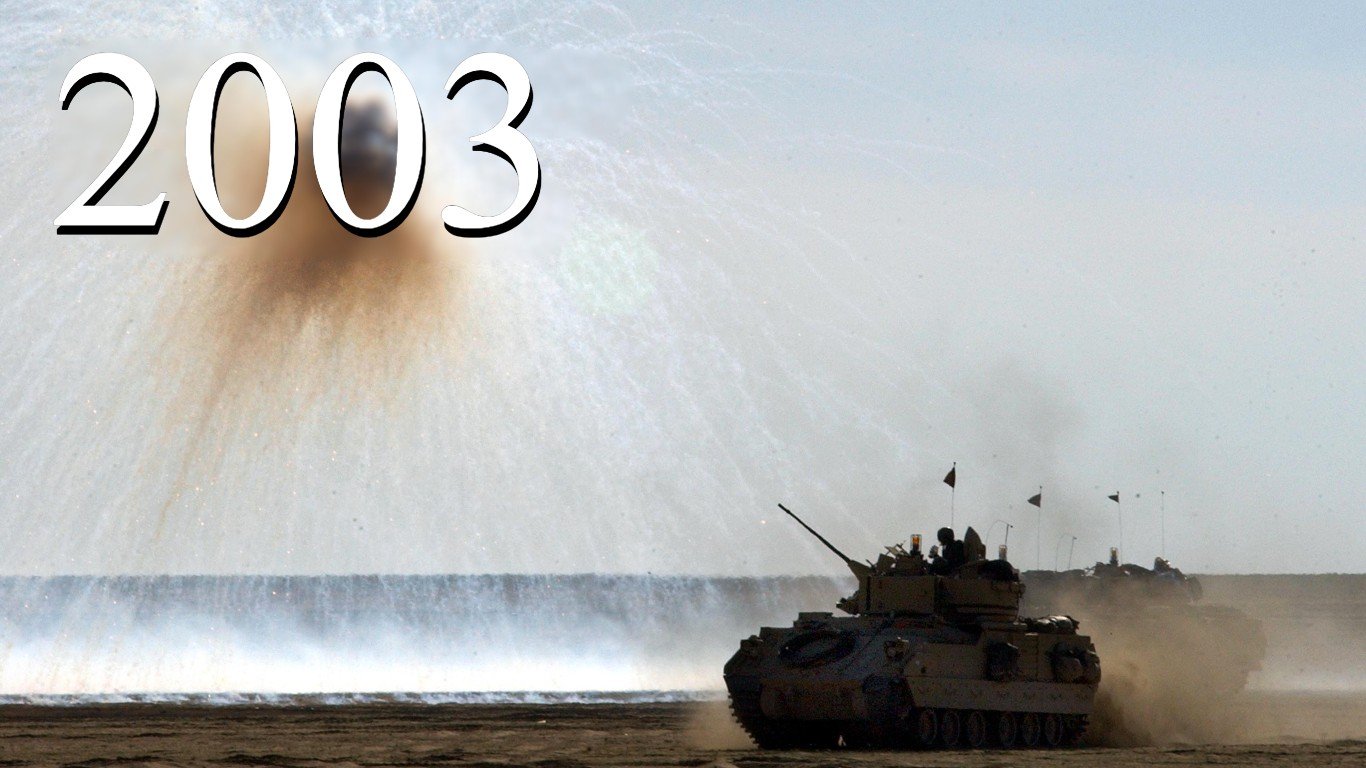
- Percent change in spending: 16.40% – #3 largest year-over-year increase
- Spending as a percent of GDP: 3.83%
2004: $ 493.00 billion
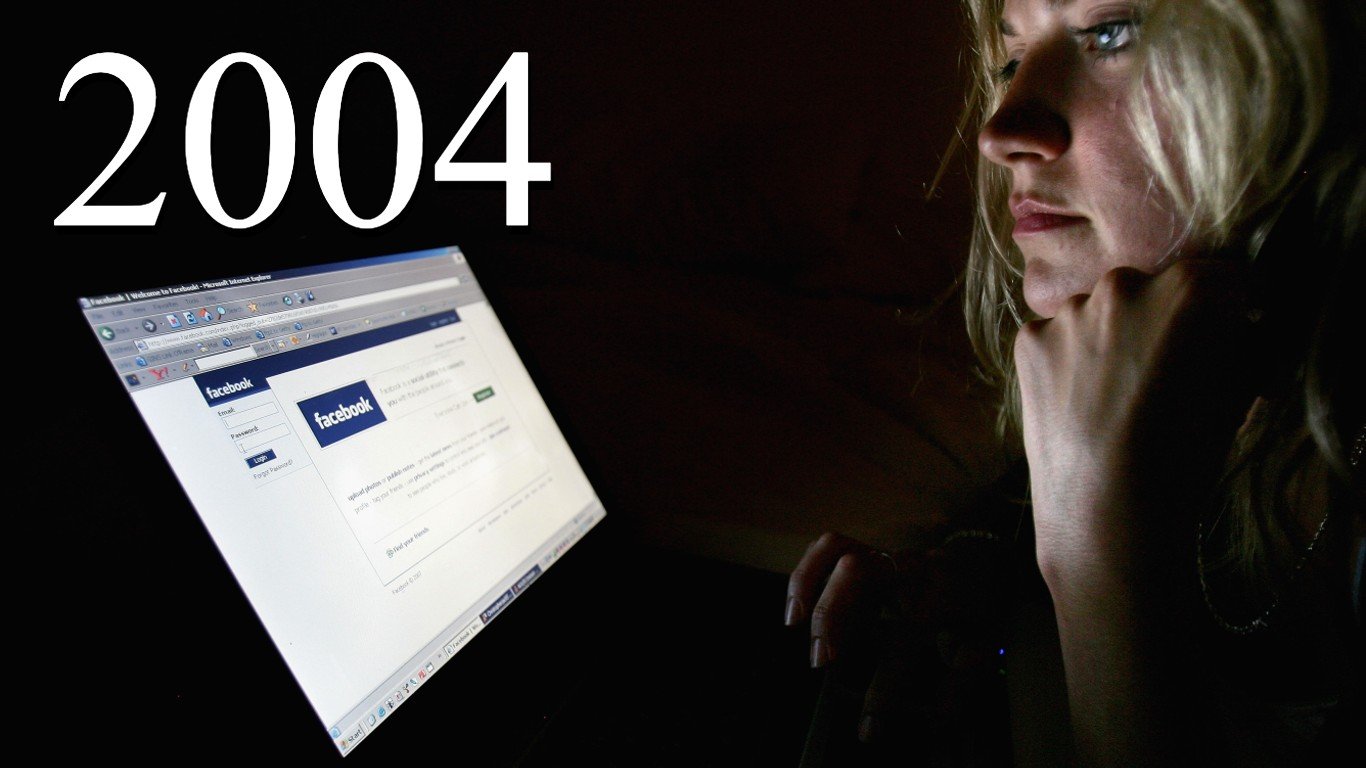
- Percent change in spending: 11.91% – #6 largest year-over-year increase
- Spending as a percent of GDP: 4.02%
2005: $ 533.20 billion
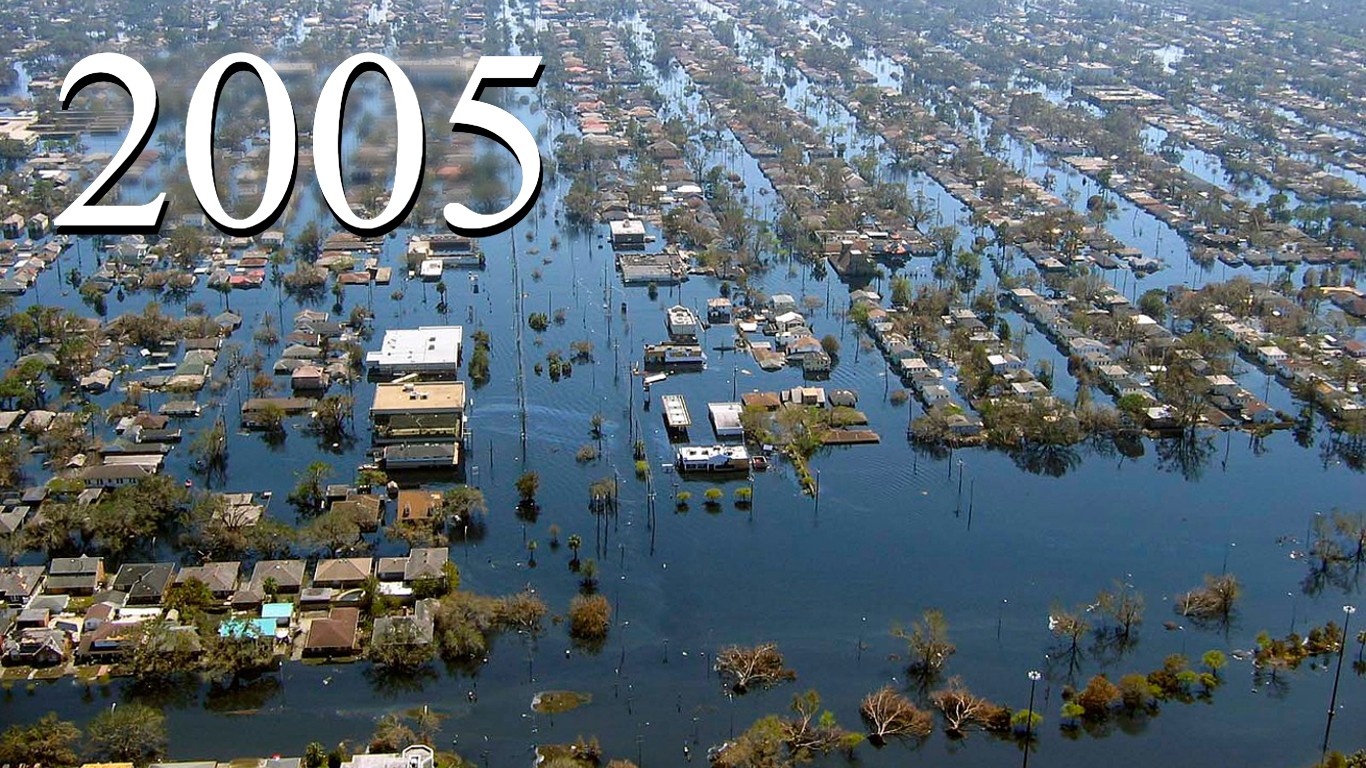
- Percent change in spending: 8.15% – #17 largest year-over-year increase
- Spending as a percent of GDP: 4.09%
2006: $ 558.34 billion
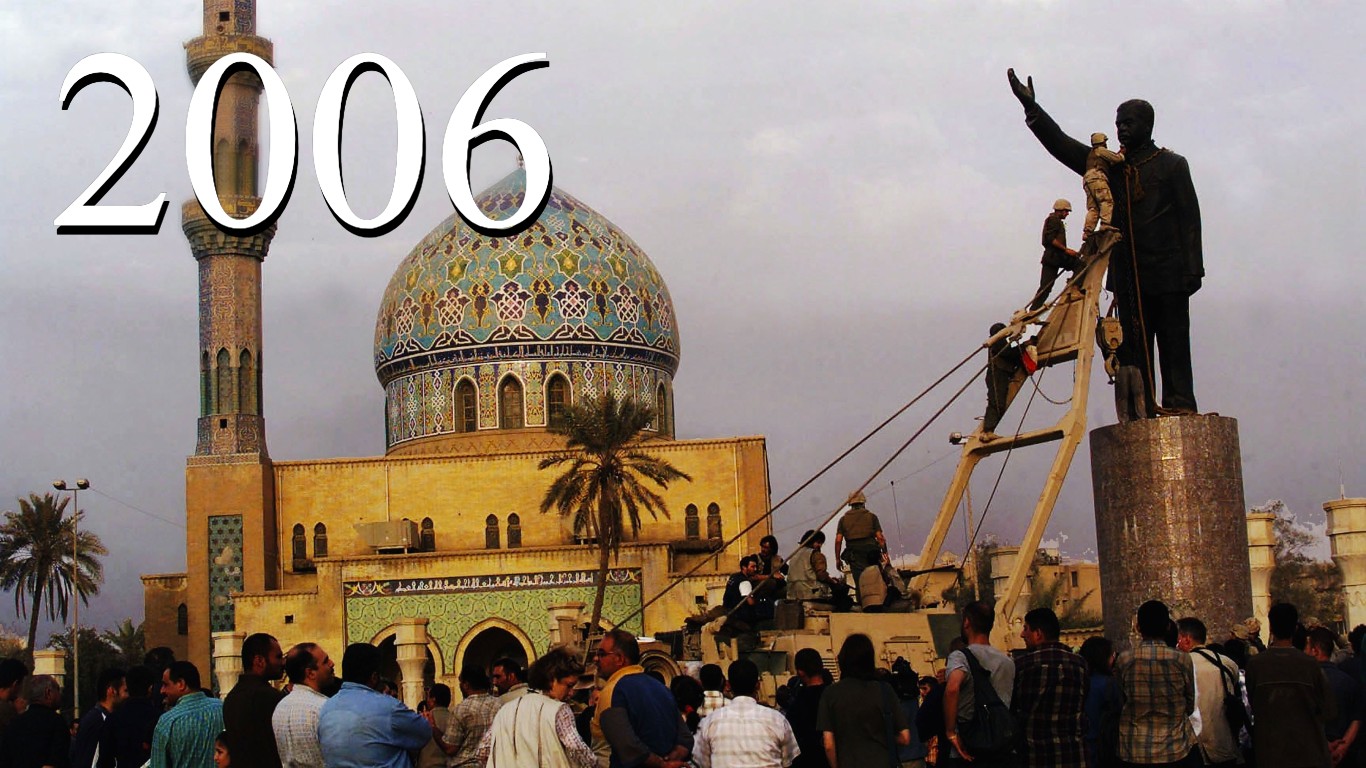
- Percent change in spending: 4.71% – #24 largest year-over-year increase
- Spending as a percent of GDP: 4.04%
2007: $ 589.59 billion
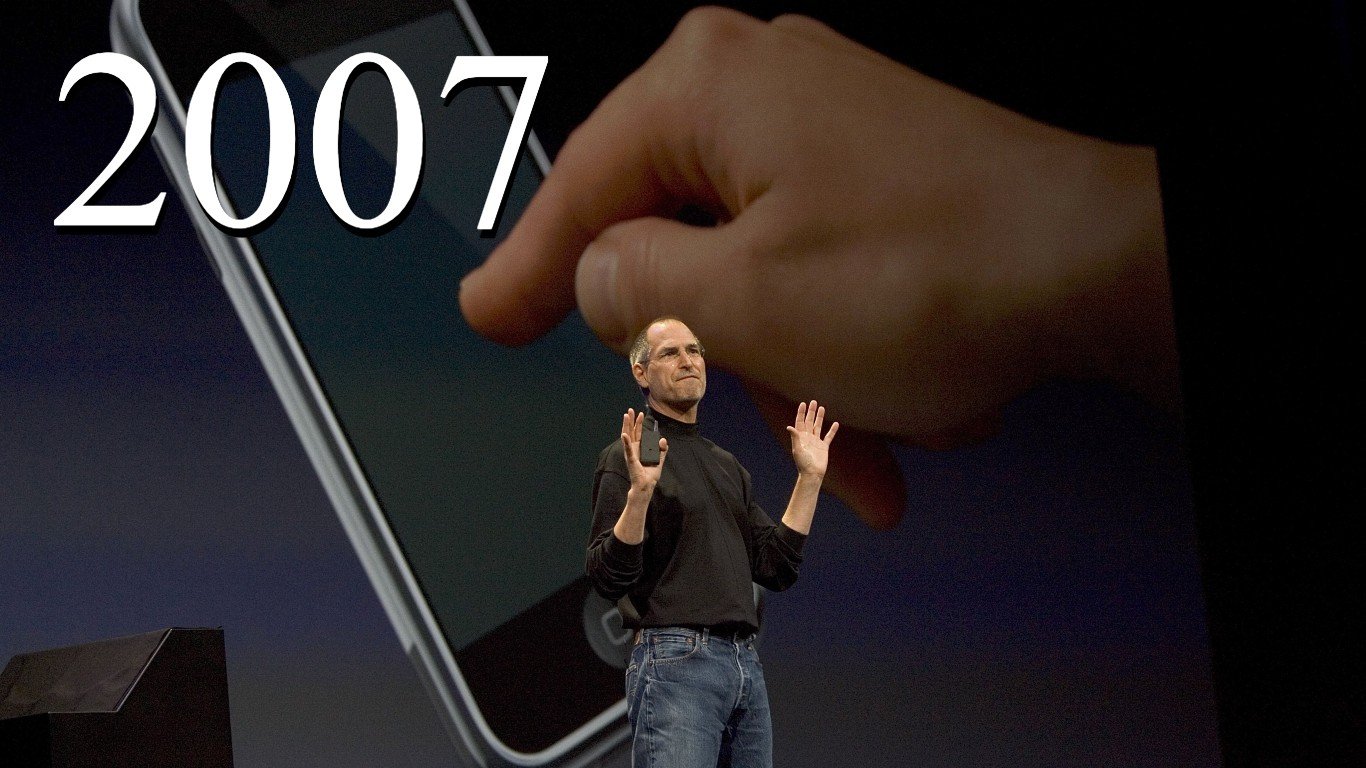
- Percent change in spending: 5.60% – #22 largest year-over-year increase
- Spending as a percent of GDP: 4.07%
2008: $ 656.76 billion
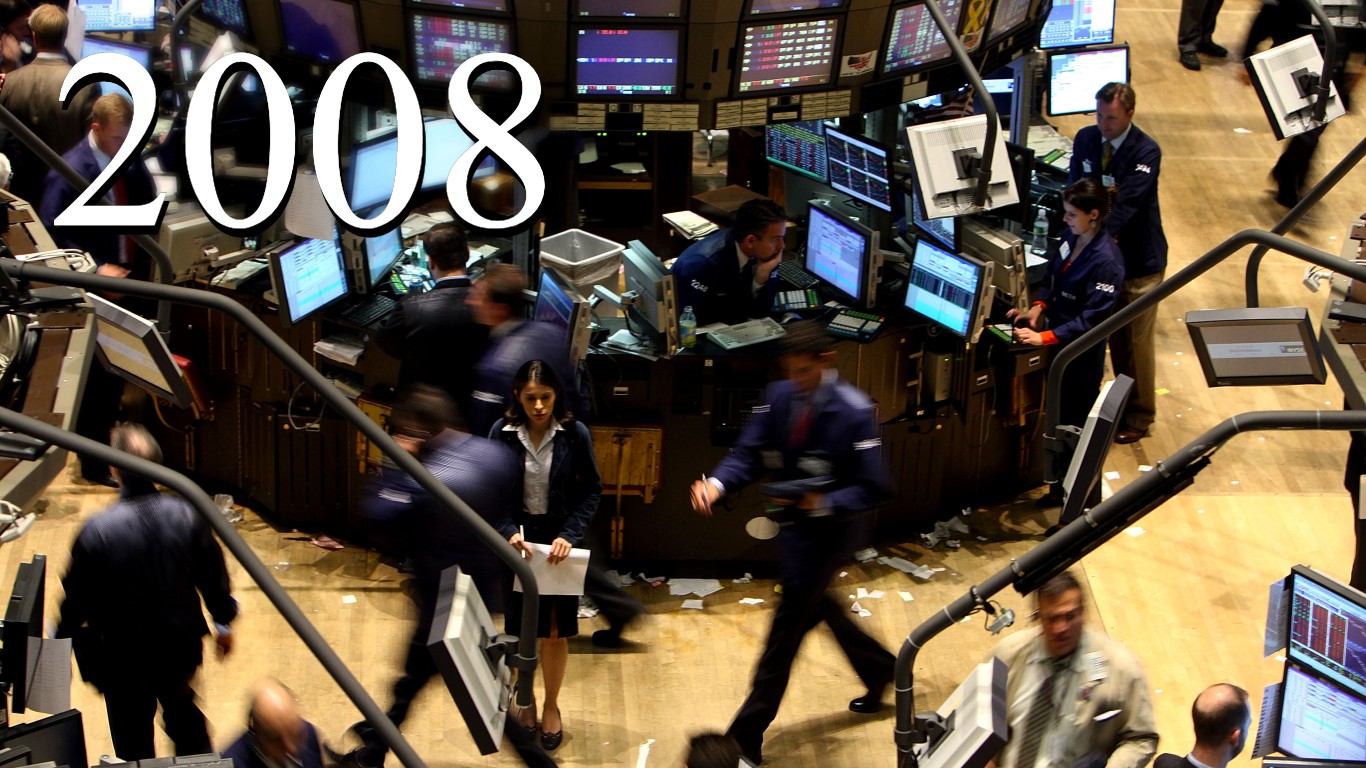
- Percent change in spending: 11.39% – #8 largest year-over-year increase
- Spending as a percent of GDP: 4.45%
2009: $ 705.92 billion
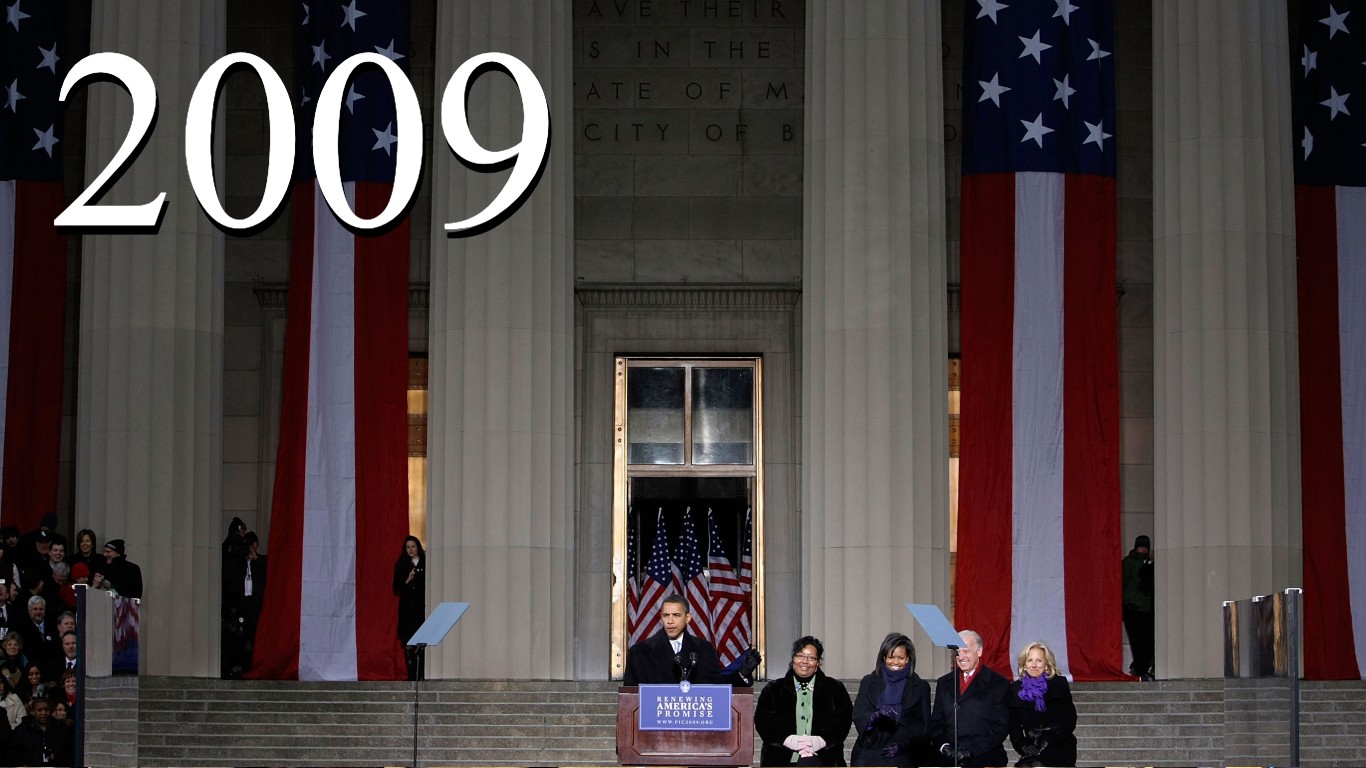
- Percent change in spending: 7.49% – #19 largest year-over-year increase
- Spending as a percent of GDP: 4.88%
2010: $ 738.01 billion
- Percent change in spending: 4.55% – #25 largest year-over-year increase
- Spending as a percent of GDP: 4.90%
2011: $ 752.29 billion

- Percent change in spending: 1.94% – #33 largest year-over-year increase
- Spending as a percent of GDP: 4.82%
2012: $ 725.21 billion
- Percent change in spending: -3.60% – #5 largest year over year decrease
- Spending as a percent of GDP: 4.46%
2013: $ 679.23 billion
- Percent change in spending: -6.34% – #2 largest year over year decrease
- Spending as a percent of GDP: 4.03%
2014: $ 647.79 billion
- Percent change in spending: -4.63% – #3 largest year over year decrease
- Spending as a percent of GDP: 3.69%
2015: $ 633.83 billion
- Percent change in spending: -2.15% – #9 largest year over year decrease
- Spending as a percent of GDP: 3.48%
2016: $ 639.86 billion
- Percent change in spending: 0.95% – #38 largest year-over-year increase
- Spending as a percent of GDP: 3.42%
2017: $ 646.75 billion
- Percent change in spending: 1.08% – #36 largest year-over-year increase
- Spending as a percent of GDP: 3.32%
2018: $ 682.49 billion

- Percent change in spending: 5.53% – #23 largest year-over-year increase
- Spending as a percent of GDP: 3.32%
2019: $ 734.34 billion
- Percent change in spending: 7.60% – #18 largest year-over-year increase
- Spending as a percent of GDP: 3.43%
2020: $ 778.40 billion

- Percent change in spending: 6.00% – #21 largest year-over-year increase
- Spending as a percent of GDP: 3.70%
2021: $ 806.23 billion
- Percent change in spending: 3.58% – #28 largest year-over-year increase
- Spending as a percent of GDP: 3.46%
2022: $ 876.94 billion
- Percent change in spending: 8.77% – #13 largest year-over-year increase
- Spending as a percent of GDP: 3.45%
Contact [email protected] for any questions or corrections.