
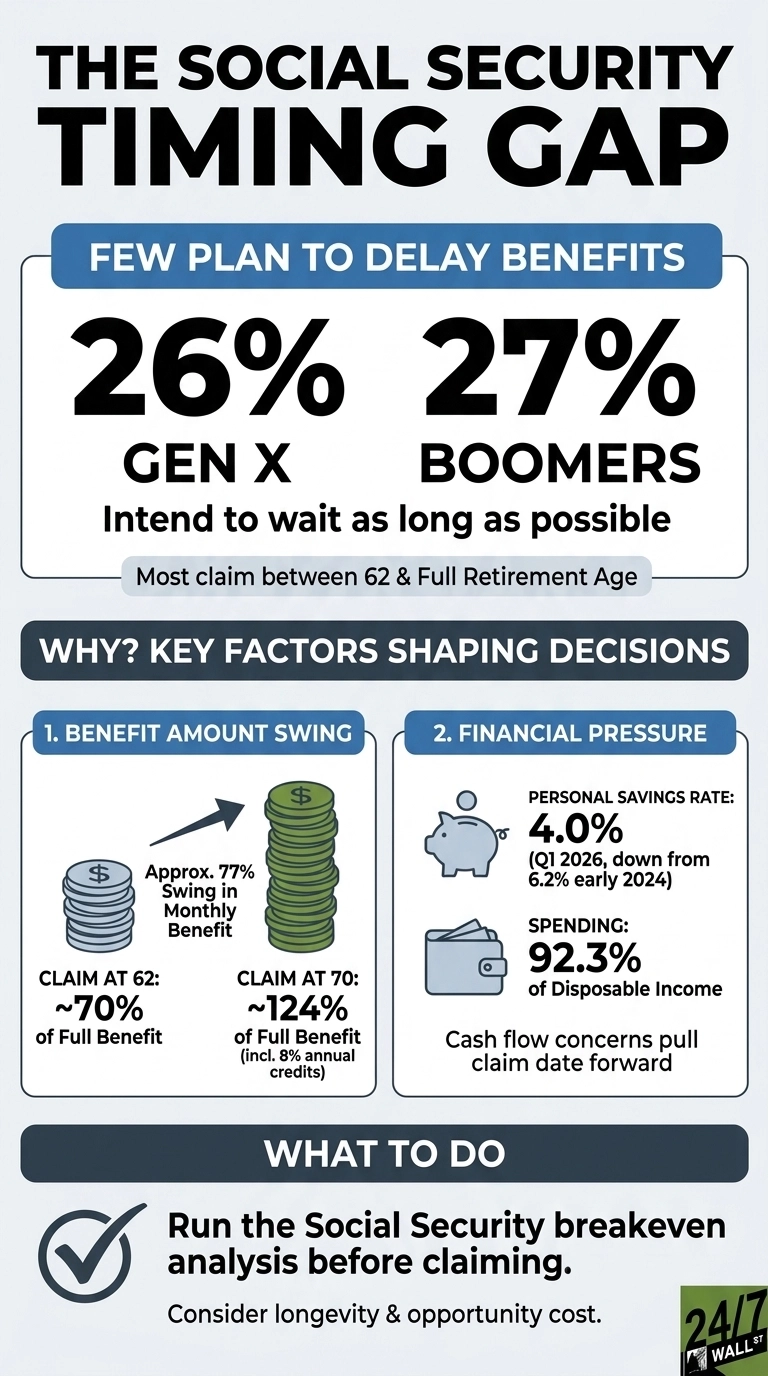
The 2025 Northwestern Mutual Planning & Progress Study asked adults 45 and older when they expect to claim Social Security, and the answers split cleanly into two camps. Only 26% of Gen X and 27% of Boomers say they plan to delay benefits as long as possible. Most intend to file somewhere between age 62 and their full retirement age. The financial distance between those choices is far wider than many pre‑retirees account for before submitting their applications, and it shapes the entire trajectory of retirement income planning and claiming strategies.
What “as long as possible” actually pays
Social Security pays a different monthly amount depending on filing age. Claiming at 62, the earliest available age, locks in roughly 70% of the full benefit, a 30% reduction set by the SSA formula. Claiming at full retirement age, which is 67 for anyone born in 1960 or later, pays 100%. Waiting until 70 adds delayed retirement credits worth 8% per year, bringing the check to roughly 124% of the full amount. Between the earliest and latest claim dates, the monthly benefit swings by about 77%.
That spread is set by statute and does not move with markets. A worker whose full benefit at 67 would be $2,000 per month receives roughly $1,400 at 62 and roughly $2,480 at 70. The difference is permanent and increases each year with the cost-of-living adjustment, so there are definite benefits to waiting until you are closer to 70.
The inflation factor sharpening the trade-off
Inflation is where the math shifted in 2026, as CPI reached 332.4 in April, up from 320.62 a year earlier, and core PCE, the Fed’s preferred gauge, moved from 125.79 to 129.279 over the same period. Those are small numbers on paper, but they matter because COLA applies to whatever benefit a retiree already has. A higher starting check grows faster in absolute dollars. A 3% adjustment on a $2,480 benefit adds roughly $74 a month. The same 3% on $1,400 adds about $42, and this gap widens every year a retiree collects, and the compounding favors the person who waited.
Why most pre-retirees claim early anyway
The Northwestern Mutual study shows why many people still file early. Only 48% of non‑retirees believe they will be financially prepared for retirement, and 56% of U.S. adults think it is somewhat or very likely they will outlive their savings. Cash‑flow pressure pushes the claim date forward well before the longevity math is considered.
The broader environment reinforces that pull. The personal savings rate has fallen from 6.2% in early 2024 to 4.0% in the first quarter of 2026. Households now spend 92.3% of their disposable income. Consumer sentiment came in at 48.2 in May 2026, a reading in the lower quartile of the index’s history and consistent with a population that feels financially stretched.
Unemployment has drifted from 3.7% in early 2024 to 4.3% in April 2026, and workers in their early sixties tend to feel that softening first. When hours get cut or job prospects thin out, claiming at 62 becomes a cash‑flow decision, and the long‑run benefit math gets pushed aside.
The opportunity-cost argument cuts both ways
There is a real case for claiming before 70, as the 10-Year Treasury yields 4.42% as of May 11, 2026, above its 12-month average of 4.236%. An early claimer who invests benefits in risk-free Treasuries earns a return that partially offsets the lower monthly check. The break-even age between filing at 62 and filing at 70 typically falls in the late 70s to early 80s, depending on assumed return and tax treatment. The Fed funds rate is at 3.75% as of May 13, 2026, down 0.75 points year-over-year. The safe-yield environment that makes early claiming defensible could compress further if the Fed resumes cuts.
Social Security’s share of household income
Social Security represents about 6.1% of total personal income nationally and roughly 32% of all transfer receipts. For households with limited savings, it functions as the largest inflation-adjusted income stream they will ever own. The benefit at 70 is roughly 1.77 times the benefit at 62, and every year of delay past full retirement age adds 8% in delayed retirement credits before COLA is applied. The 26% and 27% who plan to wait are choosing the higher number. The remaining roughly three-quarters of Gen X and Boomers have made a different choice, in many cases without running the arithmetic that Social Security itself publishes for free.
Contact [email protected] for any questions or corrections.