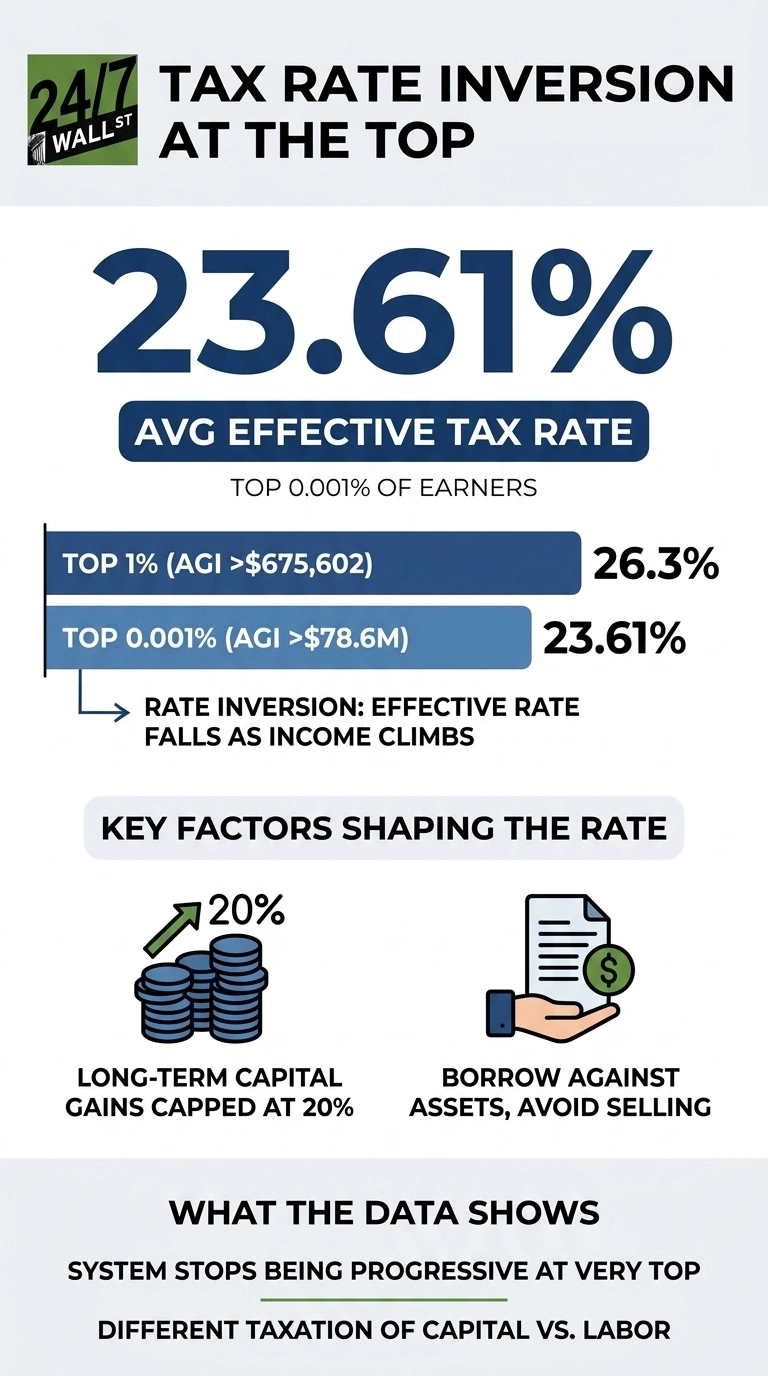
The May 2026 Kiplinger Tax Letter, citing the latest IRS Statistics of Income data, highlights a number that complicates the standard story about tax progressivity. The top 0.001% of earners, the 1,531 tax returns reporting more than $78.6 million in adjusted gross income in tax year 2023, paid an average effective federal income tax rate of 23.61%. That is lower than the rate paid by the broader top 1%.
Upper-middle-class earners often assume the ultra-wealthy pay the top marginal rate of 37% on their income. The IRS data shows that the assumption is wrong by more than 13 percentage points. The headline rate exists in the code, but it diverges sharply from what the richest filers actually pay.
The inversion at the very top
The top 1% of taxpayers paid an average effective rate of 26.27% in 2023. In contrast, the top 0.001%, an exclusive group of 1,531 filers reporting an AGI of more than $78.6 million each, paid an average effective rate of 23.61%. The effective tax rate clearly hits a ceiling and begins to decline as income climbs into the stratosphere. This inversion is a well-documented structural feature of the tax code, demonstrating how the system treats massive capital gains differently from standard labor income.
The underlying mechanism is straightforward: a surgeon earning $700,000 in W-2 wages pays ordinary income tax on nearly all of it, with the top dollars taxed at a 37% federal rate before payroll taxes are factored in. In contrast, a hedge fund founder taking $80 million in long-term capital gains pays a top federal rate of just 20% on that income. Even when adding the 3.8% net investment income tax, the total federal rate reaches only 23.8%. The simple arithmetic of these two distinct tax regimes is what produces the exact inversion captured in the IRS data.
What the upper-middle-class actually pays
The gap between perception and reality runs in both directions. The same IRS dataset shows the average effective rate across all 153.1 million returns was 14.1% in 2023. Households filing in the top 10%, those with AGI above roughly $272,209, paid a meaningfully higher share of their income than the national average, but well below what most assume of any high earner.
Here is how the effective rates stack up across the brackets the IRS reports:
- Top 0.001% (AGI above $78.6 million): 23.61%
- Top 1% (AGI above $675,602): 26.3%
- All taxpayers’ average: 14.1%
- Bottom 50% (AGI below $53,801): 3.7%
The top 1% paid 38.4% of all federal income taxes while earning 20.6% of total AGI. The top 10% paid 70.5%. The bottom 50% paid 3.3%. The system remains progressive across most of the distribution. It simply stops being progressive at the very top, which is where the Kiplinger figure focuses.
Why the rate drops at the top
Three specific features of the tax code explain that 23.61% figure. The first is the preferential rate on long-term capital gains and qualified dividends, which are capped at 20% at the federal level. The second is the step-up in basis at death, a rule that erases unrealized gains on appreciated assets passed to heirs and removes them from the income tax base entirely. The third is the strategic ability to borrow against concentrated stock positions rather than sell them, converting paper wealth into spendable cash without triggering a taxable event.
These are statutory features of the tax code rather than loopholes in the colloquial sense, meaning they are available to anyone with the specific asset mix to take advantage of them. The reason the top 0.001% benefits from this structure far more than a dentist earning $500,000 is that nearly all of the dentist’s income is comprised of standard wages. By contrast, the bulk of income for filers reporting tens of millions of dollars typically comes from investments, partnership distributions, and large-scale asset sales.
What the data actually says
The Kiplinger figure reflects how the tax code treats wage income and investment income differently, with the difference growing more consequential as the share of investment income in a household’s total income grows. A taxpayer whose income is 100% wages cannot legally pay 23.61%. A taxpayer whose income is 100% long-term gains cannot legally pay much above it.
The gap reflects the code’s design rather than a failure of enforcement. Whether that design should change is a policy question. The headline rate at the top of the bracket schedule diverges from the rate the people at the top of the income distribution actually pay, and upper-middle-class earners who assume otherwise are working from a picture the IRS numbers do not support.
Contact [email protected] for any questions or corrections.