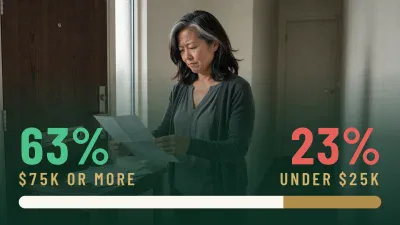
Only 23% of Americans Earning Under $25,000 Say Covering Their Bills Isn’t Difficult at All. Among Those Earning $75,000 or More, It’s 63%

This post may contain links from our sponsors and affiliates, and Flywheel Publishing may receive compensation for actions taken through them.
Paying monthly bills has gotten harder for many American families. Matching rent, the car payment, the phone bill, and the credit card bill against the bank balance is a quick monthly routine for some people. For others, it means deciding which bill can wait a week.
The FINRA Foundation’s National Financial Capability Study asks how hard that routine feels. It surveys more than 25,000 adults every three years. Its 2024 wave found the first big drop in the share of people who say covering expenses and paying bills isn’t difficult at all.
That share fell to 44% from 54% three years earlier. More people now report difficulty covering bills than in the prior survey. How easy bills feel also depends a lot on income, education, and age.
Ranking Every Group From Easiest to Hardest
The study’s nine groups are ranked below by the share who find it not at all difficult to cover expenses and pay bills. Each group uses the study’s own definition:
- Income of $75,000 or more: 63%
- Ages 55 and up: 59%
- College degree or more: 58%
- Some college: 40%
- Income of $25,000 to $75,000: 38%
- Ages 35 to 54: 38%
- High school or less: 33%
- Ages 18 to 34: 31%
- Income under $25,000: 23%
Income Decides Who’s at the Top and Bottom
Both ends of the list are income groups, and they sit 40 percentage points apart. When your paycheck barely covers rent and groceries, there’s nothing left over for a car repair or a spike in the electric bill. Gas averaging $4 a gallon this week adds up fast on a budget like that.
The recent fall was larger among higher earners. Among families making $75,000 or more, the share with no trouble fell to 63% from 74%. The under-$25,000 group slid to 23% from 30%. Higher incomes often come with bigger fixed bills, like mortgages, car loans, and child care, and rising prices reduced the money left after those payments.
Education Follows the Same Pattern
The education ranking follows the same pattern. People with a college degree or more report the easiest time, followed by some college, then high school or less. A degree usually brings higher pay and steadier work, so this ranking mostly mirrors the income ranking.
Why Older Adults Rank Near the Top
Adults 55 and up come in second, well ahead of 18- to 34-year-olds. Many older adults have paid off their homes or are close, so their biggest monthly bill shrinks or disappears. Younger adults often juggle rent, student loans, and child care all at once.
Retirees also get a Social Security check that rises with inflation. A 3.6% cost-of-living adjustment raises the average retired worker’s benefit to $2,170 a month in 2027, up from $2,095.
Medicare picks up a big share of health costs, but it still costs money. The standard Part B premium rose to $202.90 a month in 2026 from $185, and the yearly Part B deductible is now $283. Those premiums are only the opening bid once income surcharges and coverage gaps are factored in, which is why we laid out the full set in a free Medicare guide.
A strong group average still hides plenty of older adults who struggle. Supplemental Security Income, a federal benefit for people with very little income, pays an individual up to $1,029 a month in 2027. Our coverage of Social Security-only budgets shows how little room that leaves for a surprise bill.
Medicare Help That’s Easy to Miss
For older adults on tight incomes, two programs can free up real money. Medicare Savings Programs are run by states. They can pay Part B premiums and, at the most generous level, also cover Part A and Part B deductibles, coinsurance, and copays, according to Medicare.gov.
For 2026, the federal monthly income limits for an individual run from $1,350 in the Qualified Medicare Beneficiary program to $1,816 in the Qualifying Individual program. The resource limit for an individual is $9,950. Some states set higher limits or exclude certain income when counting. Medicare.gov says people should apply even if they don’t think they qualify.
Extra Help cuts what you pay for Part D drug coverage, including premiums, deductibles, and copays. People who qualify for a Medicare Savings Program get it automatically and pay no more than $12.65 per covered drug in 2026. Anyone else can apply through Social Security, which checks income and resources using bank statements, tax returns, and retirement account balances.
One Check Worth Making Before Next Month’s Bills
Raising income or completing a degree takes years, while checking for help with Medicare costs takes an afternoon. If you or a parent is on Medicare with a modest income, contact the state Medicaid office about a Medicare Savings Program and apply for Extra Help through Social Security. If the state covers a $202.90 monthly premium, that money goes back into the budget every month, and the monthly bill check gets a little easier.
Contact [email protected] for any questions or corrections.
David Beren has been a Flywheel Publishing contributor since 2022. Writing for 24/7 Wall St. since 2023, David loves to write about topics of all shapes and sizes. As a technology expert, David focuses heavily on consumer electronics brands, automobiles, and general technology. He has previously written for LifeWire, formerly About.com. As a part-time freelance writer, David’s “day job” has been working on and leading social media for multiple Fortune 100 brands. David loves the flexibility of this field and its ability to reach customers exactly where they like to spend their time. Additionally, David previously published his own blog, TmoNews.com, which reached 3 million readers in its first year. In addition to freelance and social media work, David loves to spend time with his family and children and relive the glory days of video game consoles by playing any retro game console he can get his hands on.