

 Earlier this year, the International Energy Administration (IEA) and Bank of America both said that the United States has become the world’s largest oil producer, passing Saudi Arabia and Russia. American oil production growth and a rallying dollar have not only increased oil supplies, but have also led to dramatic price drops.
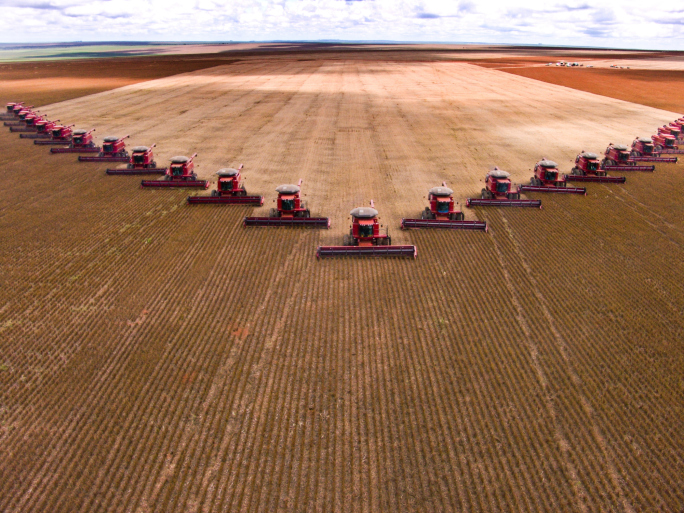
In addition to oil, the United States is also among the world’s largest producers of corn, soybeans, cotton, and wheat. However, the prices of these commodities — which are all traded on the futures market — have dropped noticeably in the last year.
Click here to see the seven commodities with collapsing prices
For some commodities, the drop in prices has been tied to increased supplies. Notably, for many crops, increases in production have created a supply glut, which has lead to cheaper prices. This has been the case with a number of major crops, including commodities, soybeans, and corn, all of which had among the largest price declines out of the commodities we reviewed. The fall in these prices is also likely tied to high levels of domestic production.
The prices of a number of precious metals have also dropped this year. These include platinum and silver, both of which have dropped at least in part due to a stronger U.S. dollar, according to research from BMO Capital Markets. As the buying power of the dollar increases, the dollar denominated price of many commodities often drops. This is because it becomes more expensive for foreign buyers to purchase commodities priced largely in dollars, such as oil.
In order to determine the commodities with the largest price decline, 24/7 Wall St. reviewed futures contract data published by Quandl, an online data provider. Data used here is from the Stevens Continuous Futures database. This database adjusts price in order to account for contract “roll,” when one futures contract expires and another becomes the “front contract” — the shortest-term futures contract available in the market. Commodities that are traded outside the U.S., or are petroleum byproducts, such as gasoline and heating oil, were excluded from our consideration.
7. Platinum
> YTD change: -9.4%
> Current price: $1,242.80 per troy ounce
> Dec. 31 price: $1,371.10 per troy ounce
> 5-yr change: -8.4%
Platinum typically trades at a premium to gold. This year, however, as the price of platinum has fallen more than 9%, it briefly dropped below the price of gold in October. That gold prices briefly exceeded platinum may somewhat reflect the outlook for the global economy, as gold often serves as a safe haven for investors worried about the economy or rising inflation. In a recent report, BMO Capital Markets downgraded its target price for platinum, citing a stronger U.S. dollar and a weaker South African rand — most of the world’s platinum is produced in South Africa. This year’s decline in platinum prices comes despite months-long strikes at a number of South Africa’s largest platinum mines, which cut deeply into production.
ALSO READ: Five American Cities Back from the Dead
6. Wheat
> YTD change: -11.0%
> Current price: $5.39 per bushel
> Dec. 31 price: $6.05 per bushel
> 5-yr change: 4.4%
The United States is a major producer of wheat, typically trailing only China, India, and the European Union, according to the Department of Agriculture (USDA). The price of wheat futures, however, has declined 11% so far this year through November 3, from roughly $6.05 a bushel to about $5.39 per bushel. One factor pushing down prices is likely the global supply glut of grains, as growing conditions have improved from previous drought-heavy years. However, these low prices could reverse in due time. According to the USDA, “as low prices encourage feed and food consumption across the globe, wheat use is projected higher.” Already, the USDA lowered in October its ending stocks estimate for the 2014-2015 season by 44 million bushels to 653.9 million bushels.
5. Corn
> YTD change: -11.6%
> Current price: $3.73 per bushel
> Dec. 31 price: $4.22. per bushel
> 5-yr change: -4.4%
The United States is the leading corn producer worldwide. Corn futures rose substantially each year between 2009 and 2012, when prices were over $7.00 per bushel. Since then, however, corn futures dropped by nearly half. Futures contracts priced corn at $3.73 per bushel at the beginning of November, down nearly 12% from a year ago. The decline is due to surges in corn production, which in turn can be attributed to weather patterns that have bolstered production and accelerated this year’s harvests, according to The Crop Progress Report by the USDA. While several market analysts do not anticipate increases in corn demand, the price drops could increase demand for some corn products.
ALSO READ: Most and Least Tax-Friendly States for Business
4. Silver
> YTD change: -16.2%
> Current price: $16.20 per troy ounce
> Dec. 31 price: $19.34 per troy ounce
> 5-yr change: -5.7%
Silver, one of the world’s oldest commodities, is both more abundant than other precious metals and more useful. It is especially malleable, for example, and more conductive than other metals. In the last 12 months silver futures have plummeted 25.3%, the largest such change reviewed. The commodity’s value fell 53% over a three-year period, also the largest drop in this time frame. Silver’s drop may be, like that of gold, connected to an improving economy, stronger dollar, and the prospect of higher interest rates. In an effort to increase transparency and confidence, the more than 100-year-old silver “fix”, used to set the daily benchmark price of silver, was replaced this past August with an electronic auction-based process.
3. WTI Crude
> YTD change: -20.0%
> Current price: $78.78 per barrel
> Dec. 31 price: $98.42 per barrel
> 5-yr change: -1.0%
Crude oil futures have fallen by roughly 20% this year. As of November 3, WTI crude was trading at just under $79 per barrel. By comparison, oil ended last year at close to $100 per barrel. The prices of products made from crude oil — including gasoline and home heating oil — have declined as well. The drop in U.S. crude prices has also been matched overseas, with Brent crude futures falling more than 23% this year to under $85 per barrel. In recent years, spot prices for oil have declined 50% from their all-time high, set in 2008.
A recent report from the IEA notes that while there may be some support among OPEC nations to cut production in order to boost oil prices, Saudi Arabia, OPEC’s leading producer, “is indicating it may be prepared to accept a period of lower prices.” Additionally, Goldman Sachs recently issued a research report forecasting oil prices to fall further in 2015, as U.S. shale production lowers the price of oil and OPEC loses some of its pricing power.
ALSO READ: 10 Big Ways the Government May Be Wasting Taxpayer Money
2. Soybeans
> YTD change: -21.6%
> Current price: $10.29 per bushel
> Dec. 31 price: $13.13 per bushel
> 5-yr change: 2.2%
The United States produces and exports more processed soybeans than any other country in the world. Soybeans are widely used, they are the largest source of animal feed and the second largest source of vegetable oil worldwide, according to the USDA. Although prices are up 2.2% over the last five years to $10.29 a bushel recently, in 2012 prices rose to around $17 a bushel and have dropped 22% since January. As with a number of crops, increased production likely accounts for some amount of the price decline for soybeans. The USDA currently forecasts supplies of soybeans to rise 13% in the 2014-2015 season. The USDA also notes that shipping bottlenecks, caused in part by the increase use of trains to transport oil, will also continue to put downward pressure on prices.
1. Cotton
> YTD change: -24.1%
> Current price: 64.25 cents per pound
> Dec. 31 price: 84.64 cents per pound
> 5-yr change: -4.7%
Cotton futures have fallen 24% in the year to date, the largest decline among all commodities reviewed. Over a four-year period, cotton futures dropped over 52%, also by far the largest decline among major commodities over that time frame. Like a number of other agricultural commodities, cotton faced downward pressure from rising production. According to the USDA, total production of cotton in the 2014-2015 season is expected to rise by over 25% from the 2013-2014 season. Prices also face headwinds from China, the world’s leading cotton consumer, which recently announced it would cut cotton imports next year. The stakes are particularly high for the United States, which is currently the world’s largest exporter of the commodity. Imports by China are currently projected to fall nearly by half in the 2014-2015 season, the USDA reports.
Contact [email protected] for any questions or corrections.


