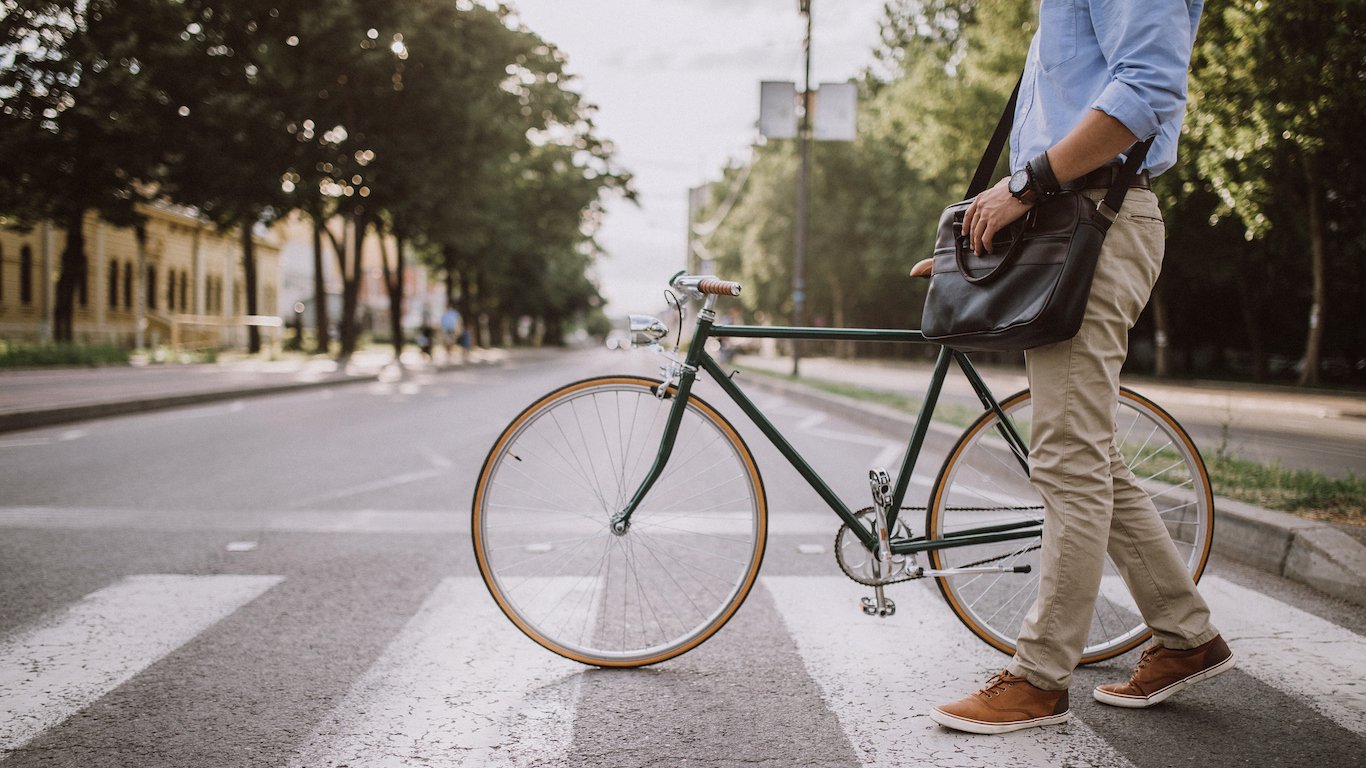
 Roads are the arteries of the nation, and the automobile has been the centerpiece of American culture for decades. Despite Americans’ love for their cars, however, the rush hours are no more pleasant, and not everyone wants or can afford a car. According to the U.S. Census Bureau, 9.1% of American households did not own a car in 2013.
According to a review of carless households in American cities, residents in some urban areas are far less likely to own a vehicle. In New York City, 54.4% of households did not have a car, the highest percentage nationwide. Based on the percent of households who did not own a vehicle in 2013, these are the cities where no one wants to drive.
Click here to see the cities where no one wants to drive
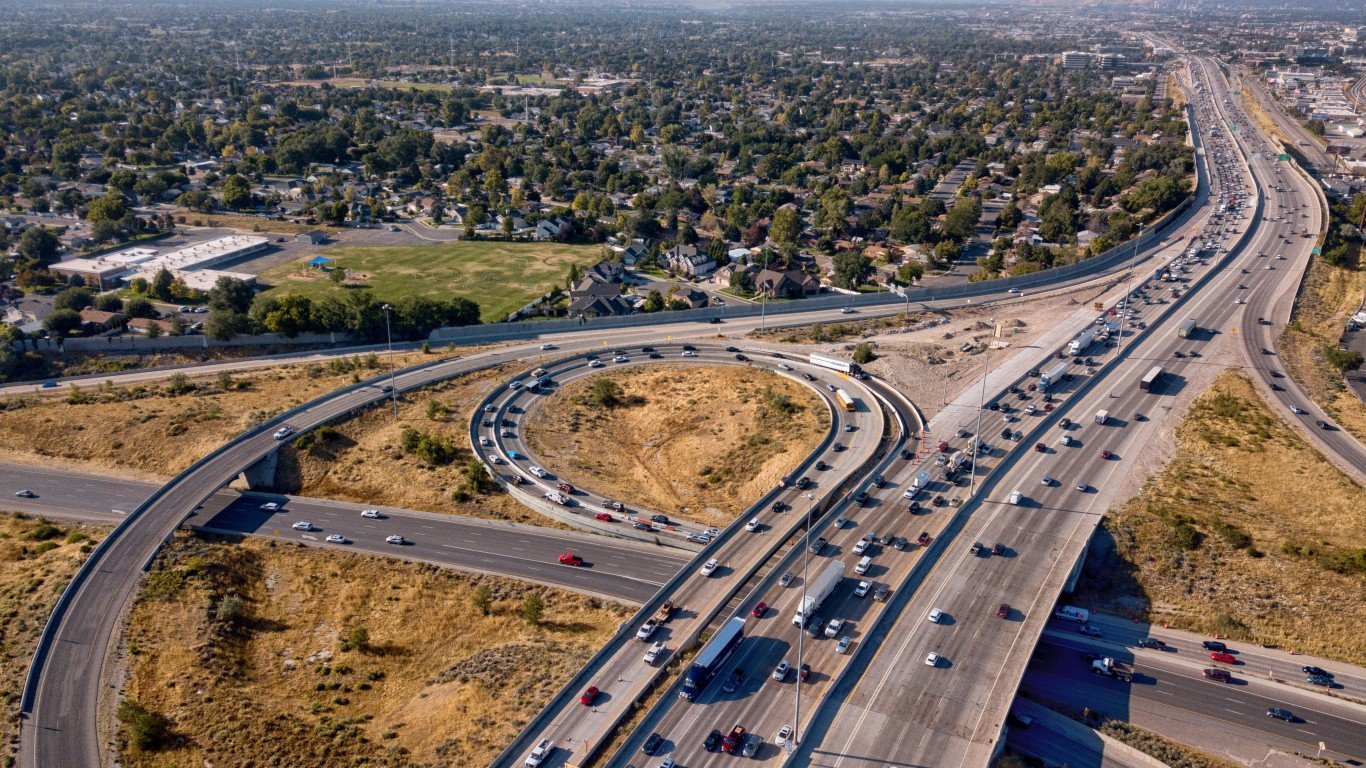
The concentration of businesses and people plays a major role in both traffic congestion and in many peoples’ decisions to own a car or not. Seven of the 10 cities with the highest proportion of carless households were home to more than 1,000 people per square mile, and all had above average population densities. The average population density across U.S. metro areas was 273.5 per square mile in 2010, by contrast. In an interview with 24/7 Wall St., Clifford Winston, senior fellow at the Brookings Institution, said that above all, “density is an indication of accessibility.”
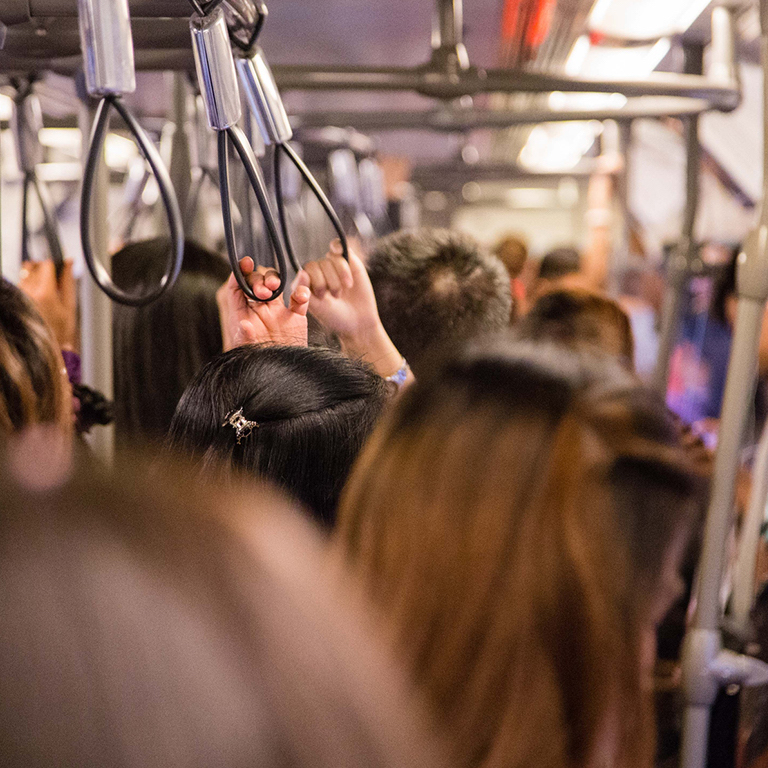
Residents of cities with high percentages of carless households were far more likely to use public transportation to commute than most Americans. In all of the 10 cities the percentage of working age residents commuting by public transportation was greater than the national rate of 5.2%. In five of the cities, more than one-quarter of residents used public transit to commute each day. And in New York City, nearly 57% of commuters did so, the highest rate nationwide.
According to Winston, while many people have access to a vehicle and are not forced to take public transit, “the transit system is sort of bailing them out.” That is, “the nature of where they live, their lifestyle, [and] their job accessibility,” permit them to live without a car.
Living without a car in these areas makes sense, Winston continued, because “densely populated areas also have a lot of jobs around them.” Despite the advantages presented by mobility, the unemployment rate in eight of the 10 cities exceeded the national rate of 7.4% in 2013. And while public transportation drastically improves access, this does not mean the journey is fast, or pleasant. The average commute time to work in seven of the 10 cities with high percentages of carless households exceeded the national mean travel time of 25.8 minutes in 2013.
To determine the 10 cities where no one wants to drive, 24/7 Wall St. reviewed the 575 cities included in the 2013 one-year American Community Survey estimates. Two hundred sixteen of these cities serve as the principal city in their respective metro areas. Our list was based on the percentage of households without a vehicle in these principal cities. We also considered households with one or multiple vehicles. The percentages of individuals commuting to work by car, carpool, public transit, and by foot, were also from the Census. Median household income, poverty rates and population density data came from the Census as well. Population density data are by metropolitan statistical area from 2010. From the Bureau of Labor Statistics, we considered the 2013 unemployment rate for each city. Lastly, cost of living in 2012 in each city’s metro area was from the Bureau of Economic Analysis.
These are the 10 cities where no one wants to drive.
10. San Francisco, Calif.
> Pct. of households without a vehicle: 29.3%
> Pct. commuting to work via public transportation: 32.7% (6th highest)
> Metropolitan area: San Francisco-Oakland-Hayward, CA
> Population: 837,442
More than 29% of San Francisco households did not have a car in 2013, the 10th highest proportion among U.S. cities reviewed. Nationwide, just 9.1% of households did not have a car. Like nearly all cities where a relatively large share of residents choose not to own a vehicle, San Francisco is among the nation’s most densely populated. The surrounding metropolitan area was home to 1,754.8 people per square mile on average in 2010 — the third most densely populated metro area in the country. San Francisco also has among the most used public transportation systems, which likely makes living without a vehicle far more convenient than in many other cities. Nearly one third of city residents used public transit in 2013, the sixth-highest usage rate nationwide. The affordability of public transit compared to owning a car may be especially important to San Francisco residents. The metro area had one of the higher costs of living in the country — 21.3% more than the average cost of living across the nation.
ALSO READ: Cities Where Crime is Plummeting
9. Baltimore, Md.
> Pct. of households without a vehicle: 29.8%
> Pct. commuting to work via public transportation: 18.8% (25th highest)
> Metropolitan area: Baltimore-Columbia-Towson, MD
> Population: 622,104
As in most cities where a relatively large share of households do not own a vehicle, Baltimore residents were far more likely than most Americans to use public transportation. Nearly 19% of commuters in the city used public transit, excluding taxis, versus the national proportion of 5.2%. While public transportation is used frequently in Baltimore, this does not mean it is an efficient system. Most large cities had longer than average commute times, and Baltimore was no exception. City residents spent more than 30 minutes on average commuting to work, versus a national average of 25.8 minutes. Public transit usage is cheaper than owning a car. This likely played a bigger role in Baltimore residents’ decision whether or not to own a car as a typical family earned $42,266 in 2013, one of the lower median household incomes among large U.S. cities. The Baltimore metropolitan area is also more expensive than the nation as a whole.
8. Trenton, N.J.
> Pct. of households without a vehicle: 30.0%
> Pct. commuting to work via public transportation: 13.3% (12th lowest)
> Metropolitan area: Trenton, NJ
> Population: 84,344
Finances may be a relatively large consideration for Trenton residents deciding whether to purchase a vehicle. The cost of living was relatively high in Trenton, and the household median income was less than $37,000 in 2013, one of the lowest nationwide. The city also had relatively high unemployment and poverty rates, at 10.9% and 22.9%, respectively. Perhaps to help cut costs, Trenton residents were far more likely than other Americans to either carpool or take public transportation. Nearly 24% of Trenton commuters carpooled in 2013, the third highest rate nationwide. Also, 13.3% of commuters used public transit, one of the higher proportions, and considerably higher than the national percentage of 5.2%.
7. New Haven, Conn.
> Pct. of households without a vehicle: 30.1%
> Pct. commuting to work via public transportation: 9.6% (70th highest)
> Metropolitan area: New Haven-Milford, CT
> Population: 130,654
New Haven was one of only a handful of U.S. cities where residents were more likely to walk to work than take public transit. While less than 10% of commuters used public transportation, 14.5% of commuters walked to work — the fifth highest rate in the nation. New Haven residents were still much more likely than most Americans to use public transit. However, while better access via public transit improves access to employment opportunities, 11.2% of New Haven’s workforce was unemployed in 2013, much higher than the national rate of 7.4%. The Connecticut Department of Transportation’s I-95 NHHC Corridor Improvement Program is intended to improve traffic flow through the New Haven area, and includes commuter rail enhancements. The project is currently underway, and will likely improve public transit service and benefit the more than 30% of carless New Haven households.
6. Philadelphia, Pa.
> Pct. of households without a vehicle: 31.5%
> Pct. commuting to work via public transportation: 27.2% (13th highest)
> Metropolitan area: Philadelphia-Camden-Wilmington, PA-NJ-DE-MO
> Population: 1,553,165
The Southeastern Pennsylvania Transportation Authority (SEPTA) maintains rail, trolley, and bus routes throughout the Philadelphia region, including the more than 100 bus stations. There were nearly 1,300 people per square mile in Philadelphia in 2010, making the city one of the most densely populated in the country. Perhaps as a result of the high concentration of people and businesses, more than 27% of commuters used SEPTA to commute to work as of 2013, among the highest proportions nationwide. As in other cities with high proportions of carless households, Philadelphia residents were not especially wealthy. The city had a median household income of less than $37,000 in 2013, versus a typical American household’s income of $52,250.
ALSO READ: Companies Cutting the Most Jobs
5. Reading, Pa.
> Pct. of households without a vehicle: 31.7%
> Pct. commuting to work via public transportation: 8.5% (79th highest)
> Metropolitan area: Reading, PA
> Population: 87,894
Compared with other cities with high percentages of carless households, Reading residents were not as likely to use public transit, with 8.5% of commuters doing so in 2013. However, this was still higher than the national rate of 5.2%. While Reading commuters were more likely to drive to work, 21% opted to carpool, the fifth highest proportion among large U.S. cities and more than double the national carpool rate of 9.4%. The high cost of owning a car has likely prevented many area households from owning one. Reading had a poverty rate of nearly 40% in 2013, a higher rate than in all but a handful of U.S. cities. And the unemployment rate of 10.5% was far higher than the national rate of 7.4% that year.
4. Boston, Mass.
> Pct. of households without a vehicle: 33.9%
> Pct. commuting to work via public transportation: 33.0% (5th highest)
> Metropolitan area: Boston-Cambridge-Newton, MA-NH
> Population: 644,710
Boston is one of the more expensive cities to live in the United States, although the city had a household median income of $53,583 in 2013, slightly higher than the national figure. Like other cities with high percentages of carless households, Boston is located in an especially dense metro area. There were more than 1,300 people per square mile in the region in 2010, a higher concentration than that of all but a handful of areas. Partly as a result, more than one-third of households did not own a vehicle in 2013 and many chose other modes of travel. More than 14% of commuters walked to work, for example, the fifth highest such proportion nationwide. And 33% used public transit, also the fifth highest share. Boston’s service likely helped residents access more job opportunities. Just 6.8% of Boston’s workforce was unemployed in 2013, lower than the national rate of 7.4%.
ALSO READ: 10 States With the Worst Taxes for Average Americans
3. Washington, DC
> Pct. of households without a vehicle: 37.4%
> Pct. commuting to work via public transportation: 38.5% (4th highest)
> Metropolitan area: Washington-Arlington-Alexandria, DC-VA-MD-WV
> Population: 646,449
Unlike a majority of cities where so many do not want to drive, Washington D.C. residents were relatively well-off financially. A typical household earned $67,572 in 2013, one of the higher incomes nationwide. The relatively high proportion of the area’s workforce employed in traditionally high-paying professional and scientific positions — 24% — may account in part for the high incomes. While residents could perhaps afford to own a vehicle, 37.4% chose not to in 2013, the third highest proportion nationwide. Also, D.C.’s public transportation system is clearly a viable option for commuters, as 38.5% of commuters used the Metro in 2013, the fourth highest such percentage nationwide.
2. Hartford, Conn.
> Pct. of households without a vehicle: 40.4%
> Pct. commuting to work via public transportation: 16.7% (21st lowest)
> Metropolitan area: Hartford-West Hartford-East Hartford, CT
> Population: 125,035
Like Connecticut as a whole, Hartford residents are segregated by income much more than most Americans. Those who can afford it choose the suburbs outside the city over downtown housing. Partly as a result, Hartford had a household median income of just $27,417 in 2013 — one of the lowest incomes in the country. Also, 35.2% of people lived in poverty, well more than double the national rate of 15.8%. The labor market was also relatively weak, with a 2013 unemployment rate of 14.7%, about double the national rate. Partly as a result of the residents’ poor financial situation, more than two in five Hartford residents did not own a vehicle in 2013, second only to New York City. While the 16.7% of the area workforce using public transportation was roughly three times the national average, it was relatively low compared to other large U.S. cities.
ALSO READ: The Richest County in Each State
1. New York City, N.Y.
> Pct. of households without a vehicle: 54.4%
> Pct. commuting to work via public transportation: 56.7% (the highest)
> Metropolitan area: New York-Newark-Jersey City, NY-NJ-PA
> Population: 8,405,837
New York City is the only U.S. city where more than half of the residents do not own a vehicle. And with 56.7% of commuters using public transportation to get to work in 2013 — also the highest proportion — most residents do not seem to need a vehicle. With relatively high-paying jobs located in Manhattan, many people from other boroughs are likely willing to make longer commutes for jobs. A January 2014 study from the University of Minnesota found jobs were more accessible by public transit in New York City than in any other U.S. city. Yet, the average travel time for New Yorkers was nearly 40 minutes in 2013, the fifth highest figure nationwide. And while many wealthy commuters do not have a car, many others choose not to have a car for financial reasons. More than one in five New York City residents lived in poverty, one of the higher rates in the country. The cost of living in New York was also roughly 22% more expensive than the average for the nation.
Contact [email protected] for any questions or corrections.