[cnxvideo id=”510064″ placement=”ros”]American motorists drove 17.6 million new vehicles off the lot in 2016, breaking the previous annual sales record of 17.5 million set the year prior. Indeed, for many, driving is a central component of the American identity. About 91% of the U.S. population belong to households with access to at least one vehicle, and every day, some 113.6 million Americans drive themselves to work.
However, owning a vehicle is not always practical in every part of the country. 24/7 Wall St. reviewed U.S. Census data to identify the cities where the largest share of households do not own a vehicle. In Worcester, Massachusetts, which rounds the list of 25 cities, 19.6% of households do not own a vehicle. Leading the country is New York City, where over half of all households do not have a car.
A car is one of the biggest purchases many Americans will ever make — and the cost of a car goes far beyond the sticker price. According to a study conducted by Consumer Reports, fuel alone can cost some SUV owners more than $10,000 over a five-year period. Auto insurance is another large expense, which can cost owners more than $1,000 annually. Interest payments, regular maintenance, and taxes are other major expenses people have to consider before buying a car.
Click here to see the cities where no one wants to drive.
There are other car ownership expenses that can vary greatly depending on the region. According to a report published by the American Society of Civil Engineers, 32% of major roadways nationwide are in mediocre to poor condition. Roads in poor condition can damage vehicles, and deficient pavement costs motorists an estimated $67 billion in additional repairs and operating costs each year.
Regional differences in climate can also affect the cost and practicality of car ownership. People living in certain parts of the country can reasonably expect harsh winter conditions for several months out of the year, which can create poor driving conditions. In addition, deicing salt on roadways can be corrosive, leading to higher vehicle maintenance costs and accelerated depreciation. With only a few exceptions, every city on this list is in the either the Midwest or the Northeast, and are exposed to long and harsh winters.
All the costs associated with owning, operating, and maintaining a vehicle make car ownership prohibitively expensive for many Americans. In all but three cities on this list, the typical household earns less than the national median household income of $55,775 a year — with the majority reporting a median household income below $40,000 a year. Perhaps even more telling, poverty rates in all of the cities on this list, with the exception of San Francisco, are higher than the poverty rate nationwide.
While car ownership is unaffordable for many, for others it represents an unnecessary expense. Each city on this list is far more densely populated than the nation as a whole, and as a result, a relatively large share of residents live in walking distance of their place of employment. Nationwide, only 2.8% of workers commute to their job on foot. In each city on this list, a larger share of residents walk to work. In Boston for example, 16.7% walk to work, nearly the largest share of any city in the country.
Many cities on this list also have robust public transit systems. Only 5.2% of American workers commute to their jobs using public transit. In most of these cities, at least double the national share of workers commute using public transportation. In Boston, San Francisco, and Washington D.C., more than a third of all commuters use public transit. In New York, over half of all commuters use subways or buses.
To determine the 25 cities where no one wants to drive, 24/7 Wall St. reviewed the 589 cities included in the 2015 one-year American Community Survey estimates — 225 of these cities serve as the principal city in their respective metro areas. Our list is based on the percentage of households without a vehicle in these 225 principal cities. The percentages of individuals commuting to work by car, carpool, public transit, and by foot, are also from the Census’ ACS. Median household income, poverty rates and population density data came from the Census as well. Population density data are by metropolitan statistical area from 2010.
These are the 25 cities where no one wants to drive.
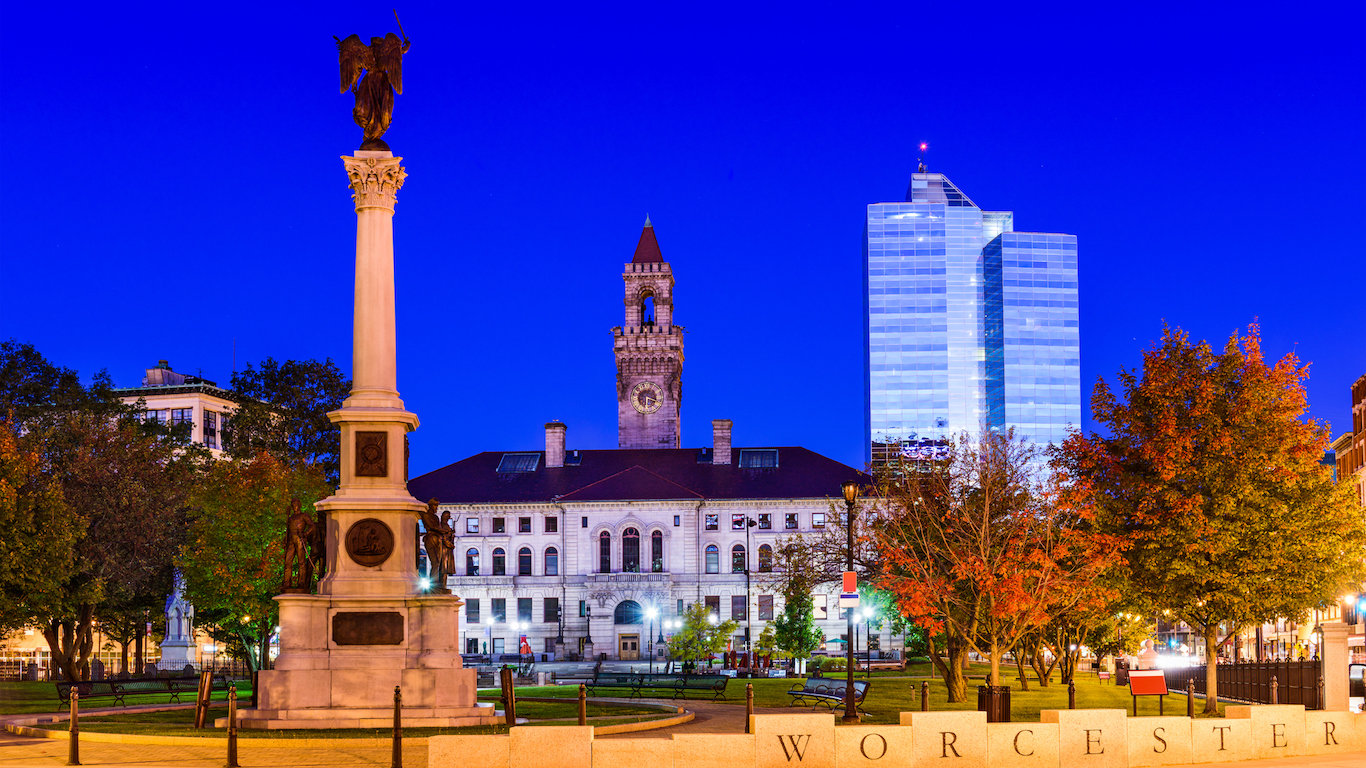
25. Worcester, Massachusetts
> Pct. of households without a vehicle: 19.6%
> Pct. commuting to work via public transportation: 4.2%
> Pct. walking to work: 5.7%
> Population: 183,382
[in-text-ad]

24. St. Louis, Missouri
> Pct. of households without a vehicle: 19.7%
> Pct. commuting to work via public transportation: 9.7%
> Pct. walking to work: 4.7%
> Population: 317,850
[recirclink id=376816]

23. Miami, Florida
> Pct. of households without a vehicle: 19.9%
> Pct. commuting to work via public transportation: 10.8%
> Pct. walking to work: 3.3%
> Population: 424,632

22. Springfield, Massachusetts
> Pct. of households without a vehicle: 20.8%
> Pct. commuting to work via public transportation: 4.2%
> Pct. walking to work: 6.1%
> Population: 153,947
[in-text-ad-2]

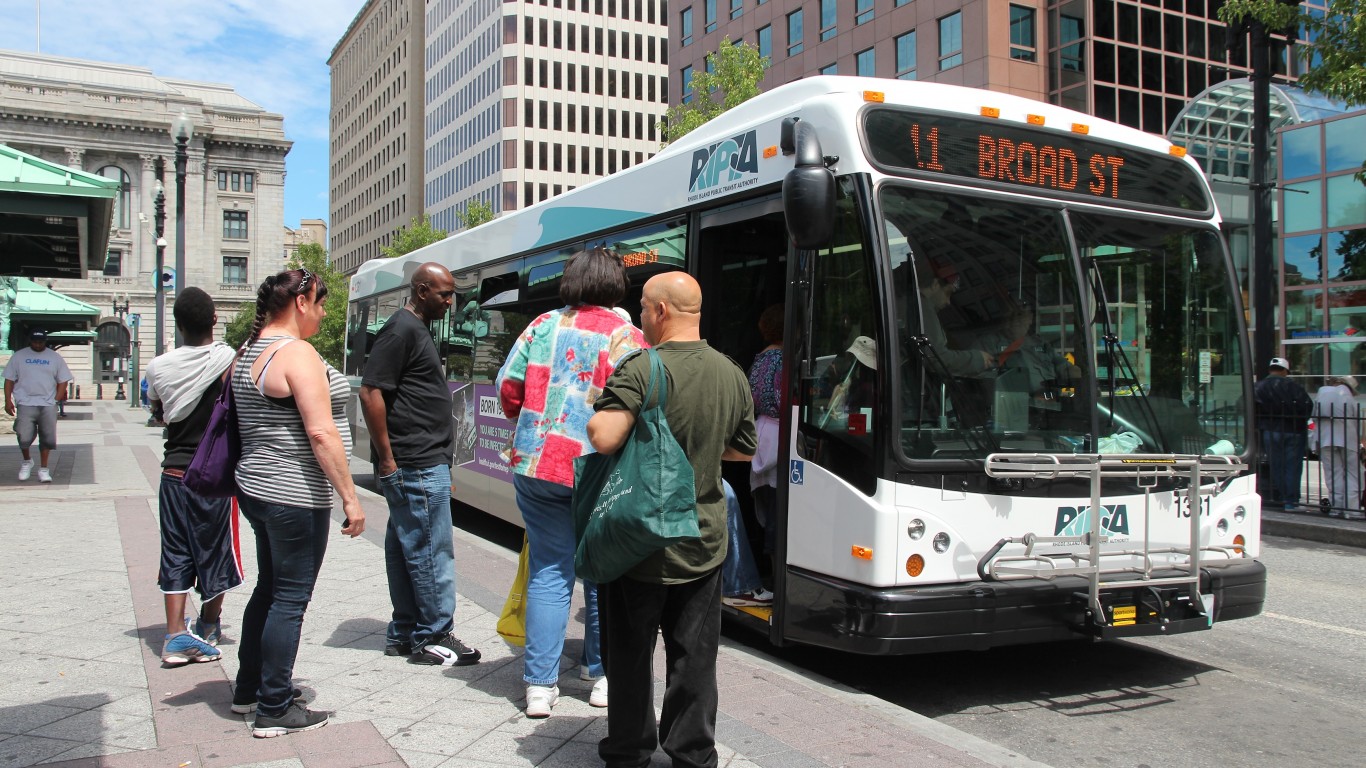
21. Providence, Rhode Island
> Pct. of households without a vehicle: 21.7%
> Pct. commuting to work via public transportation: 7.6%
> Pct. walking to work: 10.5%
> Population: 178,680

20. Bridgeport, Connecticut
> Pct. of households without a vehicle: 22.1%
> Pct. commuting to work via public transportation: 11.9%
> Pct. walking to work: 4.0%
> Population: 147,340
[in-text-ad]
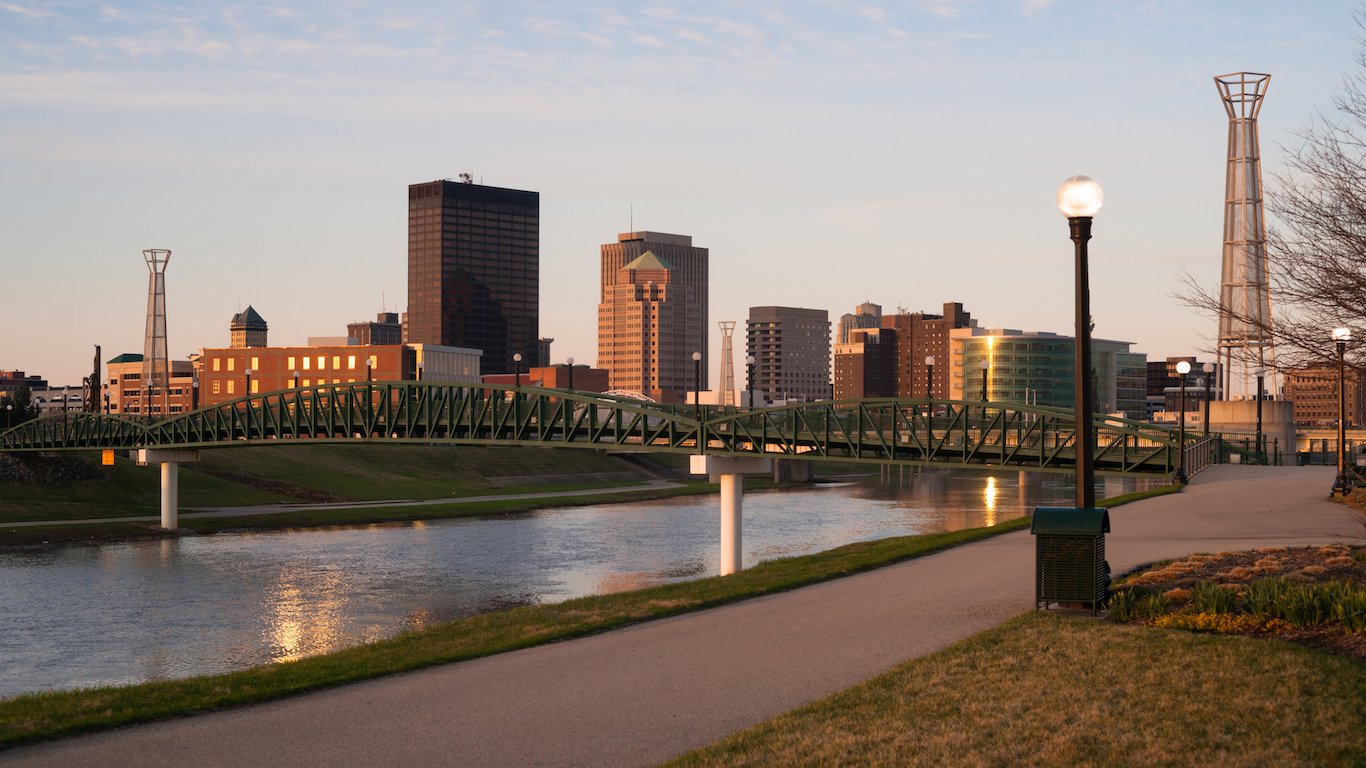
19. Dayton, Ohio
> Pct. of households without a vehicle: 22.2%
> Pct. commuting to work via public transportation: 5.9%
> Pct. walking to work: 7.5%
> Population: 141,368
[recirclink id=377173]
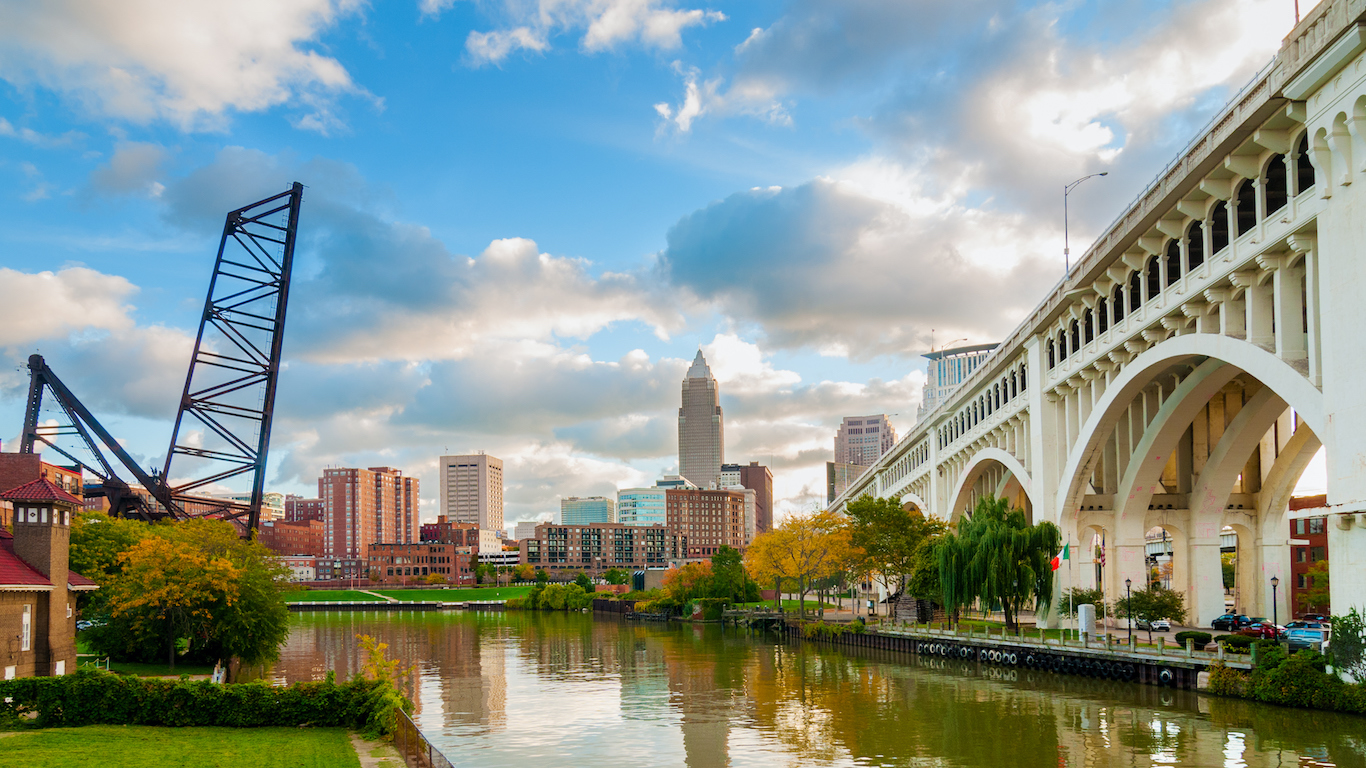
18. Cleveland, Ohio
> Pct. of households without a vehicle: 23.5%
> Pct. commuting to work via public transportation: 10.8%
> Pct. walking to work: 5.4%
> Population: 390,584

17. Reading, Pennsylvania
> Pct. of households without a vehicle: 23.6%
> Pct. commuting to work via public transportation: 5.8%
> Pct. walking to work: 8.4%
> Population: 88,057
[in-text-ad-2]

16. Pittsburgh, Pennsylvania
> Pct. of households without a vehicle: 23.9%
> Pct. commuting to work via public transportation: 17.3%
> Pct. walking to work: 11.8%
> Population: 305,928

15. Detroit, Michigan
> Pct. of households without a vehicle: 25.3%
> Pct. commuting to work via public transportation: 6.8%
> Pct. walking to work: 4.6%
> Population: 690,074
[in-text-ad]
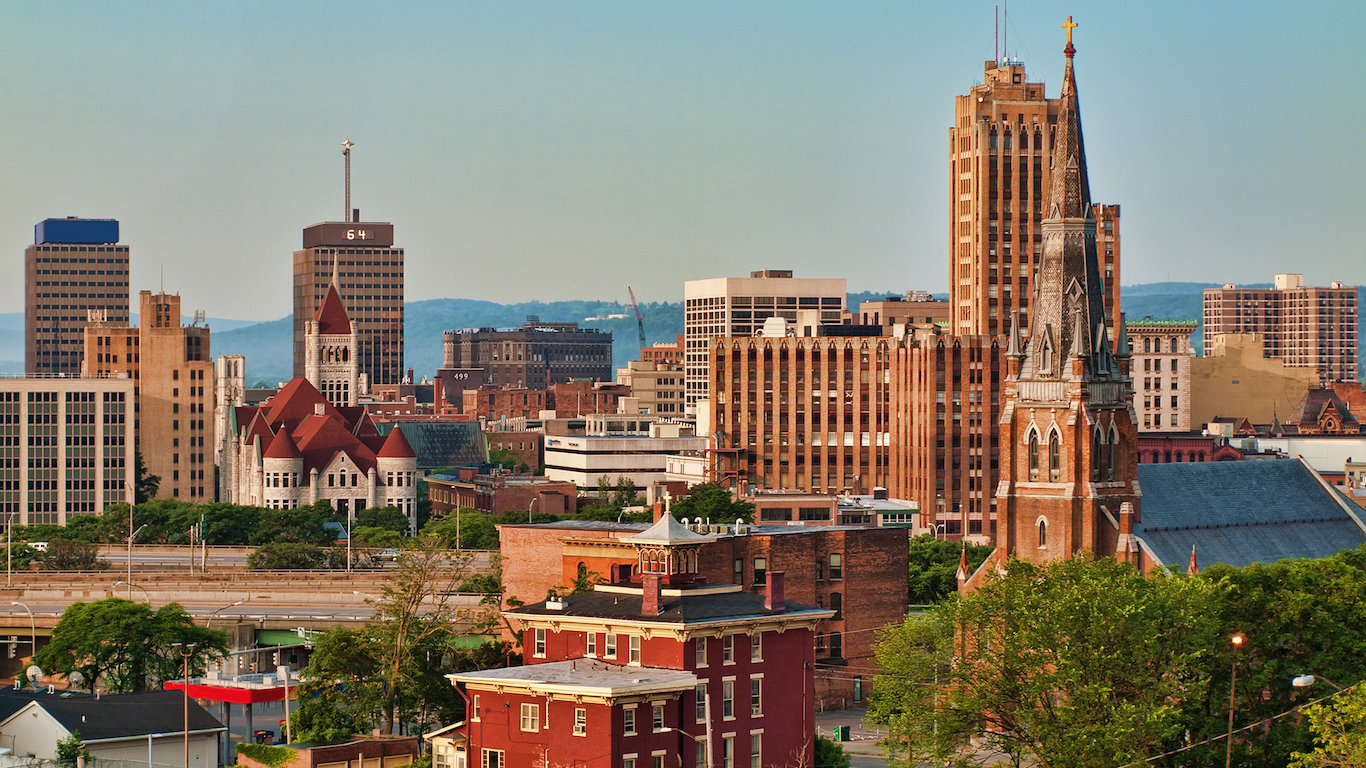
14. Syracuse, New York
> Pct. of households without a vehicle: 26.4%
> Pct. commuting to work via public transportation: 10.9%
> Pct. walking to work: 8.8%
> Population: 144,564
[recirclink id=376999]

13. Chicago, Illinois
> Pct. of households without a vehicle: 26.5%
> Pct. commuting to work via public transportation: 28.3%
> Pct. walking to work: 6.7%
> Population: 2,717,534
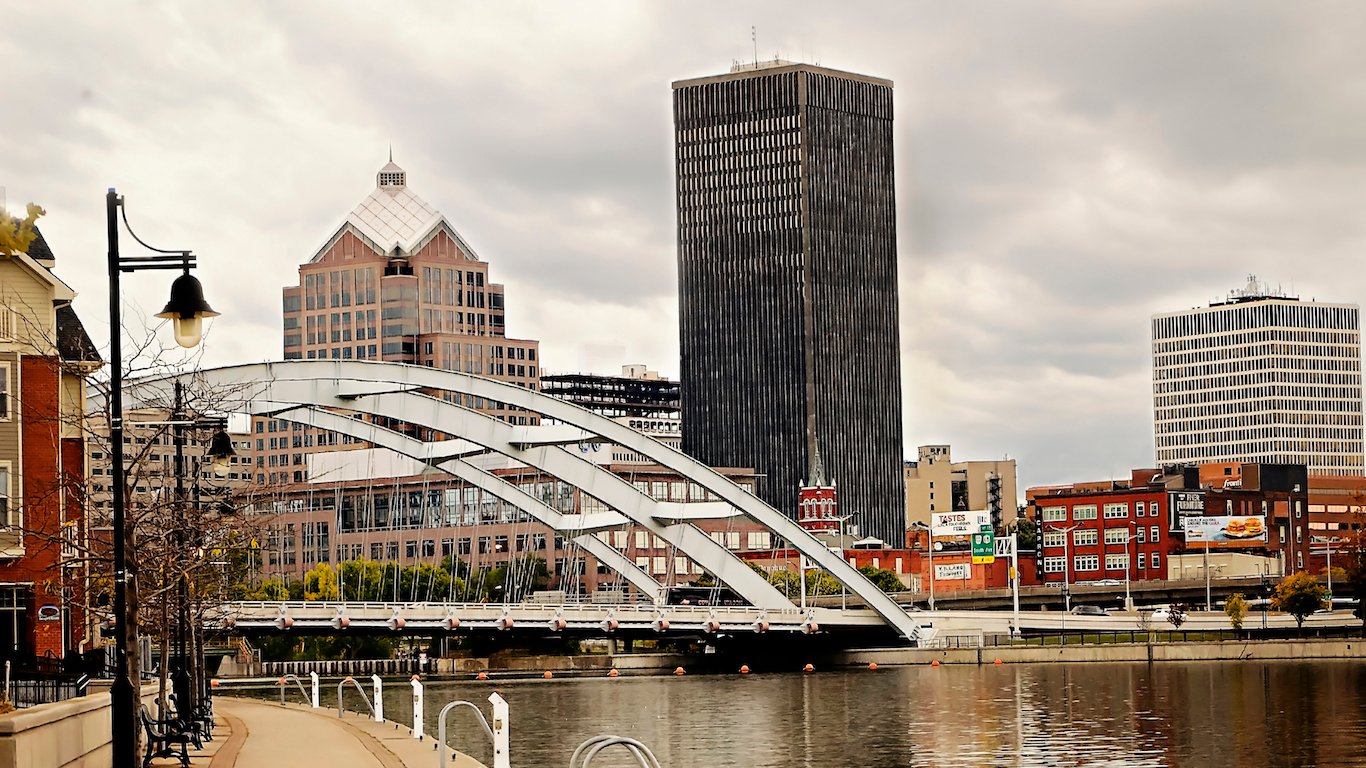
12. Rochester, New York
> Pct. of households without a vehicle: 26.8%
> Pct. commuting to work via public transportation: 10.3%
> Pct. walking to work: 5.7%
> Population: 210,745
[in-text-ad-2]

11. Albany, New York
> Pct. of households without a vehicle: 26.9%
> Pct. commuting to work via public transportation: 15.4%
> Pct. walking to work: 10.4%
> Population: 98,468

10. Trenton, New Jersey
> Pct. of households without a vehicle: 28.3%
> Pct. commuting to work via public transportation: 8.0%
> Pct. walking to work: 5.6%
> Population: 84,632
[in-text-ad]
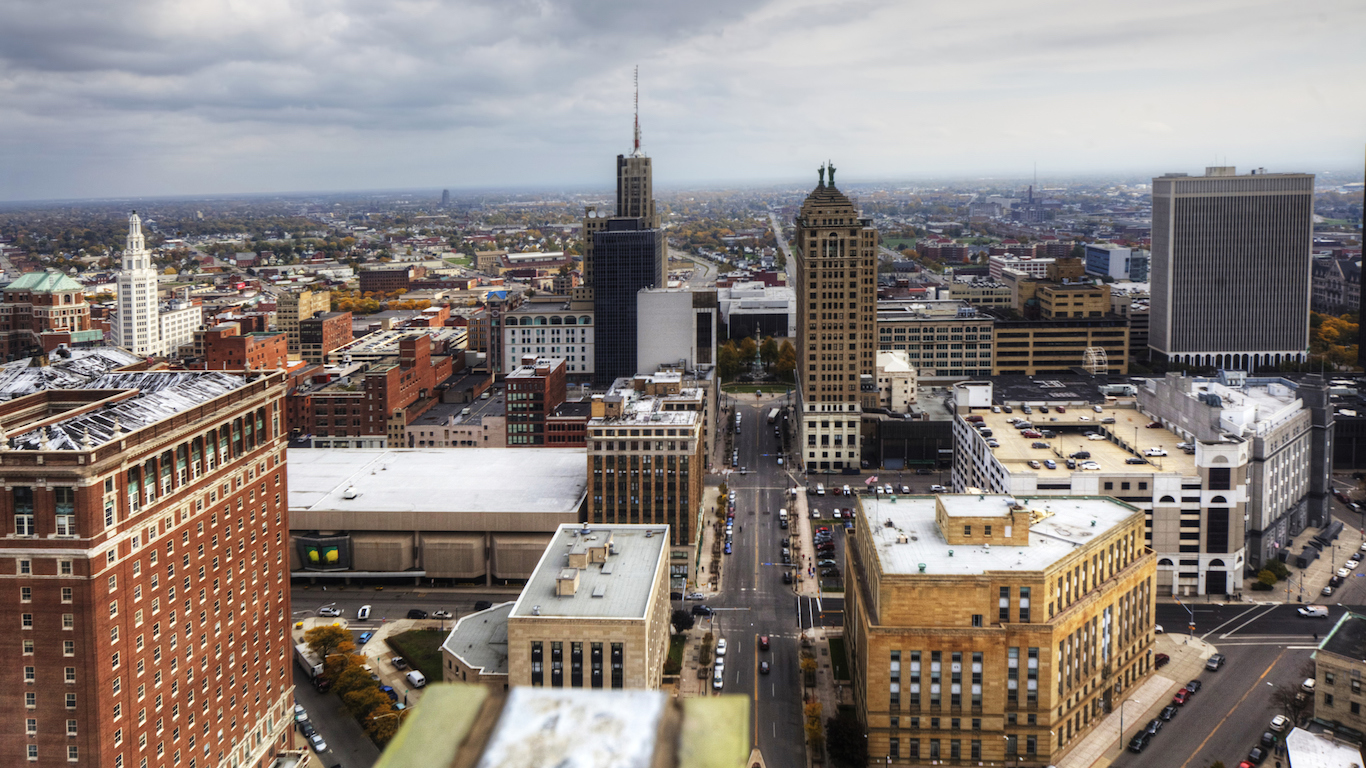
9. Buffalo, New York
> Pct. of households without a vehicle: 30.0%
> Pct. commuting to work via public transportation: 12.9%
> Pct. walking to work: 4.7%
> Population: 259,517
[recirclink id=377173]

8. Hartford, Connecticut
> Pct. of households without a vehicle: 30.3%
> Pct. commuting to work via public transportation: 16.1%
> Pct. walking to work: 4.6%
> Population: 124,795

7. New Haven, Connecticut
> Pct. of households without a vehicle: 30.4%
> Pct. commuting to work via public transportation: 16.6%
> Pct. walking to work: 12.4%
> Population: 130,612
[in-text-ad-2]

6. Baltimore, Maryland
> Pct. of households without a vehicle: 30.7%
> Pct. commuting to work via public transportation: 19.6%
> Pct. walking to work: 7.0%
> Population: 622,454

5. Philadelphia, Pennsylvania
> Pct. of households without a vehicle: 31.1%
> Pct. commuting to work via public transportation: 25.2%
> Pct. walking to work: 9.0%
> Population: 1,555,072
[in-text-ad]
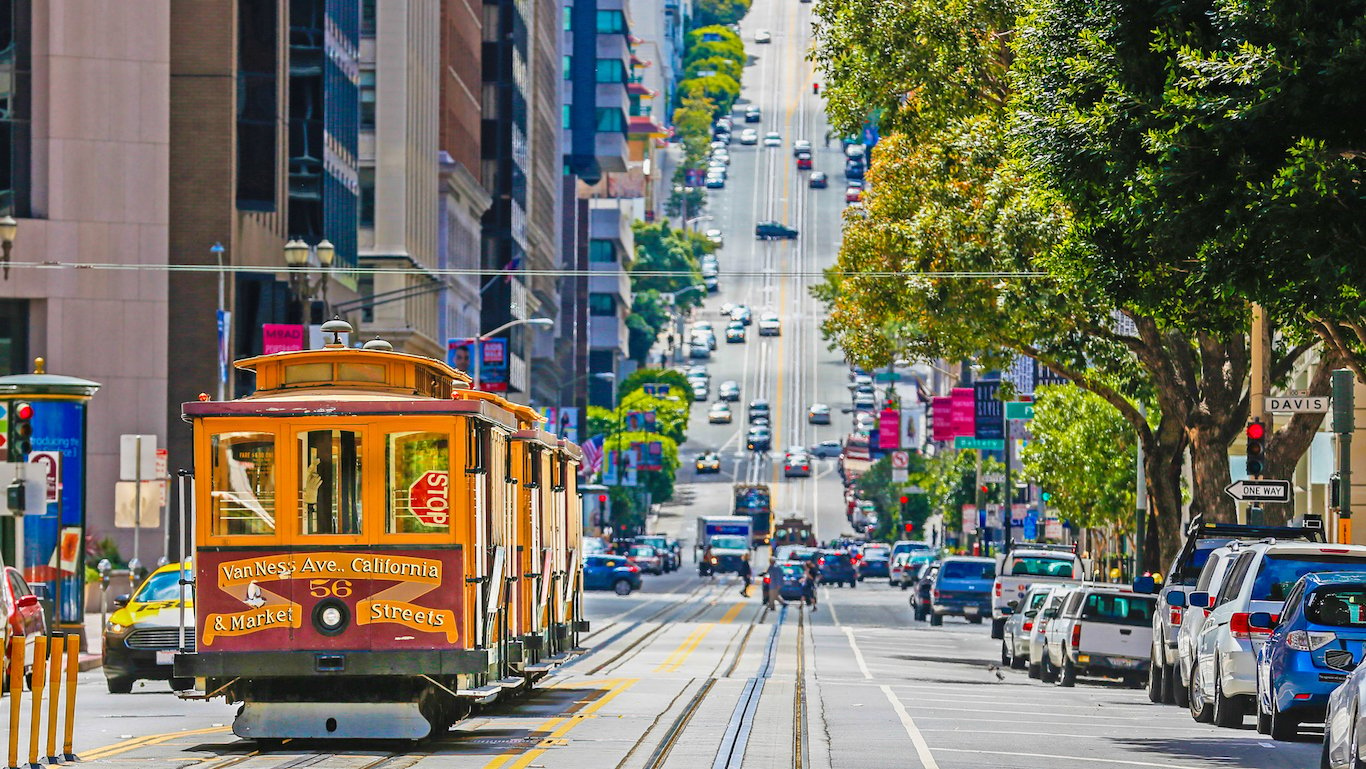
4. San Francisco, California
> Pct. of households without a vehicle: 31.2%
> Pct. commuting to work via public transportation: 34.7%
> Pct. walking to work: 10.4%
> Population: 840,763
[recirclink id=376616]

3. Boston, Massachusetts
> Pct. of households without a vehicle: 35.4%
> Pct. commuting to work via public transportation: 34.5%
> Pct. walking to work: 16.7%
> Population: 650,281

2. Washington, District of Columbia
> Pct. of households without a vehicle: 36.2%
> Pct. commuting to work via public transportation: 35.8%
> Pct. walking to work: 14.0%
> Population: 647,484
[in-text-ad-2]

1. New York, New York
> Pct. of households without a vehicle: 54.5%
> Pct. commuting to work via public transportation: 57.0%
> Pct. walking to work: 10.1%
> Population: 8,426,743
Contact [email protected] for any questions or corrections.