
Since 1950, Americans have increasingly chosen to live in cities. Today, 81% live in urban areas, more than even before. Urban areas, however, make up just 3% of U.S. land area.
The proportion of people living in urban areas varies considerably between states. 24/7 Wall St. reviewed data from the U.S. Census to determine the states with the highest shares of residents who live in cities. In California, 95% of the population lives in urban areas, the highest share of any state. Only 39% of Maine’s population lives in cities, the lowest share in the country.
Many factors influence the decision where to live, but job opportunities are often the most important. Job opportunities in urban areas are different than in rural ones. While dense cities are often business hubs, employing highly skilled labor such as scientists and engineers as well as business executives, jobs in rural areas are based on farming and mining, require less training, and are often lower paying. College graduates therefore gravitate to large cities, while Americans with less education tend to move to rural areas where the cost of living is lower.
Click here to see how many people live in cities in each state.
States with higher educational attainment rates generally have higher percentages of the population living in urban areas and higher median household incomes. Of the 10 states with highest rates of city living, eight have median household incomes higher than the national median. In contrast, none of the 10 states with the lowest percentage of population living in urban areas have a median income greater than the national median. However, all 10 have a cost of living lower than the national average.
To identify the states where the highest share of people live in cities, 24/7 Wall St. examined urban and rural population, population density, and land area by state from the 2010 Decennial Census. Median household incomes and educational attainment rates come from the U.S. Census Bureau’s 2010 American Community Survey. An urban area, as defined by the U.S. Census Bureau, must encompass at least 2,500 people and have a densely settled core.

50. Maine
> Pct. of population living in urban areas: 38.7%
> Median household income: $45,815 (19th lowest)
> Largest city: Portland, Maine
> Population of largest city: 66,317

49. Vermont
> Pct. of population living in urban areas: 38.9%
> Median household income: $49,406 (20th highest)
> Largest city: Burlington, Vermont
> Population of largest city: 42,342
[nativounit]

48. West Virginia
> Pct. of population living in urban areas: 48.7%
> Median household income: $38,218 (2nd lowest)
> Largest city: Charleston, West Virginia
> Population of largest city: 50,911

47. Mississippi
> Pct. of population living in urban areas: 49.4%
> Median household income: $36,851 (the lowest)
> Largest city: Jackson, Mississippi
> Population of largest city: 173,631
[recirclink id=331922]

46. Montana
> Pct. of population living in urban areas: 55.9%
> Median household income: $42,666 (11th lowest)
> Largest city: Billings, Montana
> Population of largest city: 106,979

45. Arkansas
> Pct. of population living in urban areas: 56.2%
> Median household income: $38,307 (3rd lowest)
> Largest city: Little Rock, Arkansas
> Population of largest city: 196,188
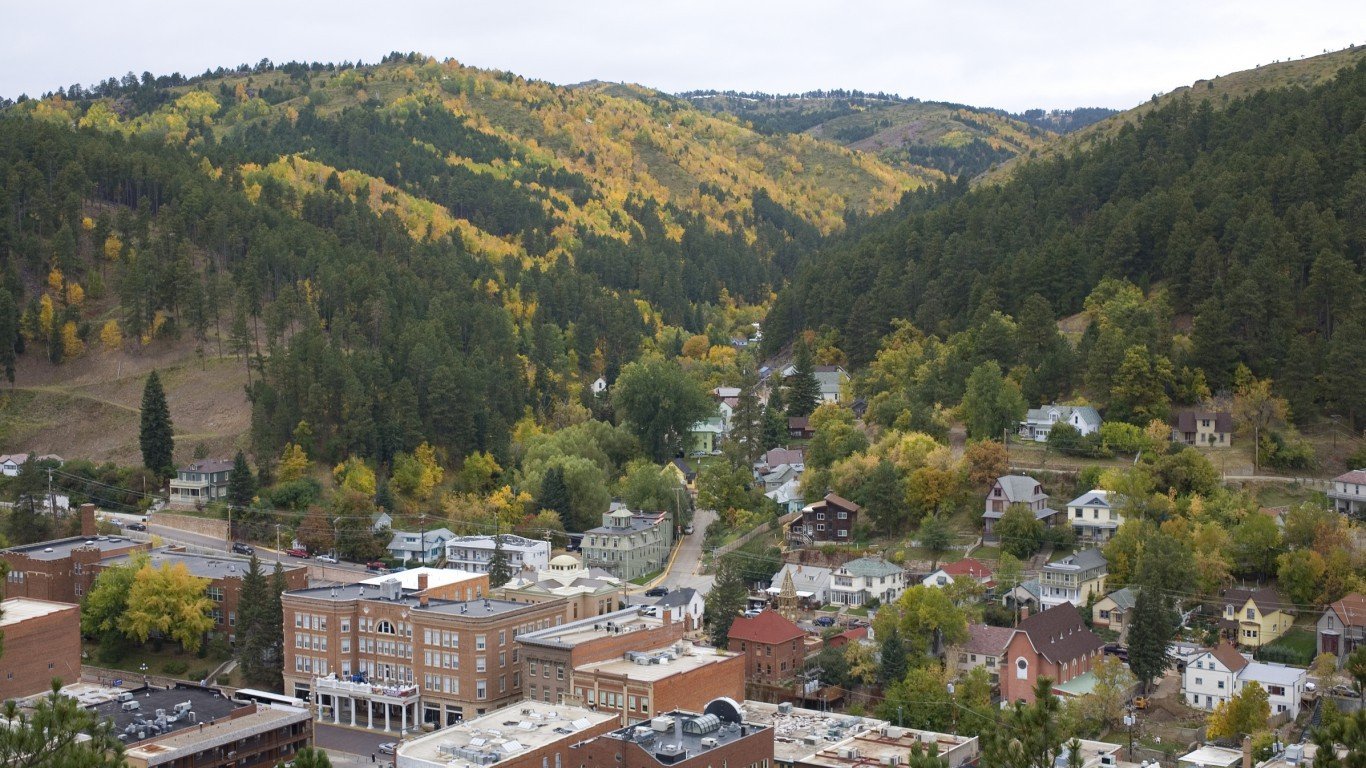
44. South Dakota
> Pct. of population living in urban areas: 56.7%
> Median household income: $45,904 (20th lowest)
> Largest city: Sioux Falls, South Dakota
> Population of largest city: 160,964
[nativounit]

43. Kentucky
> Pct. of population living in urban areas: 58.4%
> Median household income: $40,062 (4th lowest)
> Largest city: Louisville, Kentucky
> Population of largest city: 605,762

42. Alabama
> Pct. of population living in urban areas: 59.0%
> Median household income: $40,474 (5th lowest)
> Largest city: Birmingham, Alabama
> Population of largest city: 211,705
[wallst_email_signup]

41. North Dakota
> Pct. of population living in urban areas: 59.9%
> Median household income: $48,670 (23rd highest)
> Largest city: Fargo, North Dakota
> Population of largest city: 110,725

40. New Hampshire
> Pct. of population living in urban areas: 60.3%
> Median household income: $61,042 (7th highest)
> Largest city: Manchester, New Hampshire
> Population of largest city: 110,065

39. Iowa
> Pct. of population living in urban areas: 64.0%
> Median household income: $47,961 (24th lowest)
> Largest city: Des Moines, Iowa
> Population of largest city: 206,702
[recirclink id=331805]

38. Wyoming
> Pct. of population living in urban areas: 64.8%
> Median household income: $53,512 (16th highest)
> Largest city: Cheyenne, Wyoming
> Population of largest city: 61,470

37. Alaska
> Pct. of population living in urban areas: 66.0%
> Median household income: $64,576 (3rd highest)
> Largest city: Anchorage, Alaska
> Population of largest city: 298,178
[nativounit]

36. North Carolina
> Pct. of population living in urban areas: 66.1%
> Median household income: $43,326 (12th lowest)
> Largest city: Charlotte, North Carolina
> Population of largest city: 774,807

35. Oklahoma
> Pct. of population living in urban areas: 66.2%
> Median household income: $42,072 (8th lowest)
> Largest city: Oklahoma City, Oklahoma
> Population of largest city: 600,729

34. South Carolina
> Pct. of population living in urban areas: 66.3%
> Median household income: $42,018 (7th lowest)
> Largest city: Columbia, South Carolina
> Population of largest city: 131,331
[wallst_email_signup]

33. Tennessee
> Pct. of population living in urban areas: 66.4%
> Median household income: $41,461 (6th lowest)
> Largest city: Memphis, Tennessee
> Population of largest city: 656,715
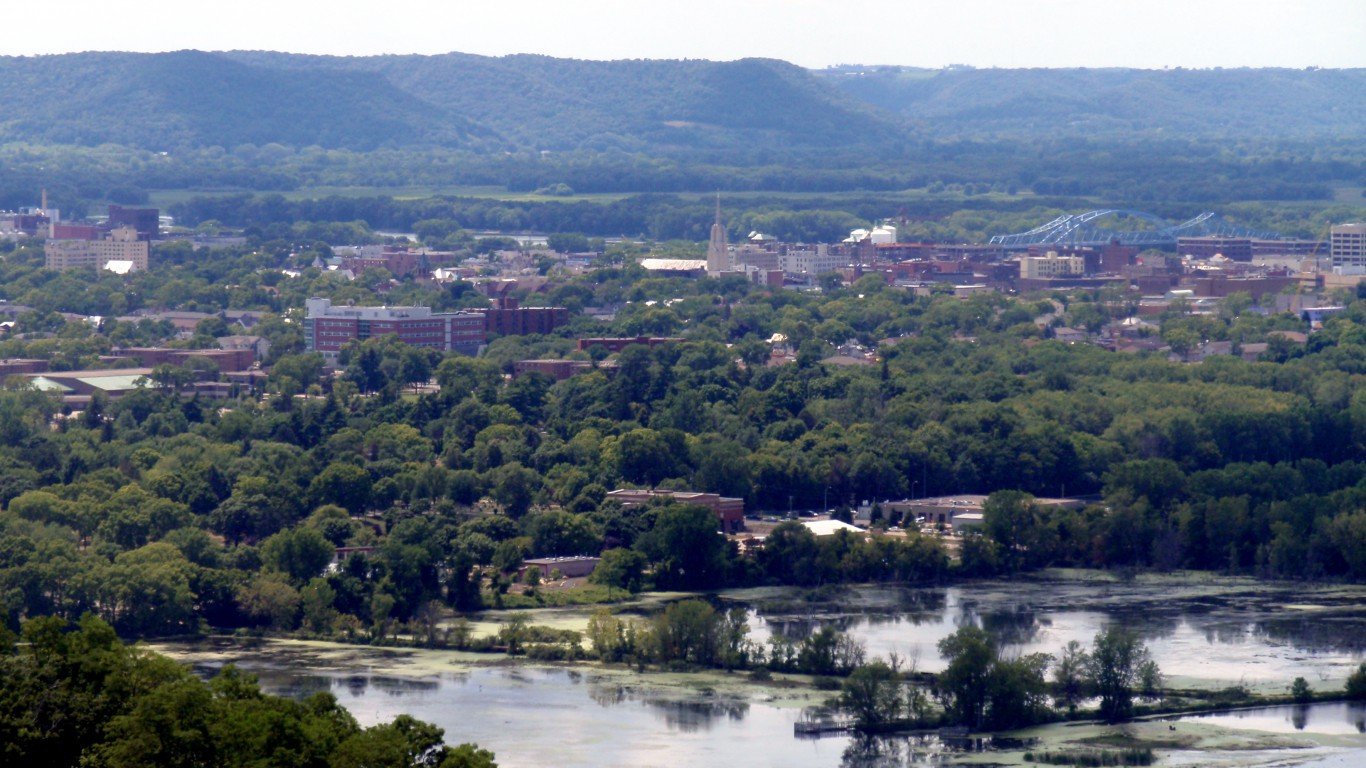
32. Wisconsin
> Pct. of population living in urban areas: 70.2%
> Median household income: $49,001 (22nd highest)
> Largest city: Milwaukee, Wisconsin
> Population of largest city: 598,078
[nativounit]

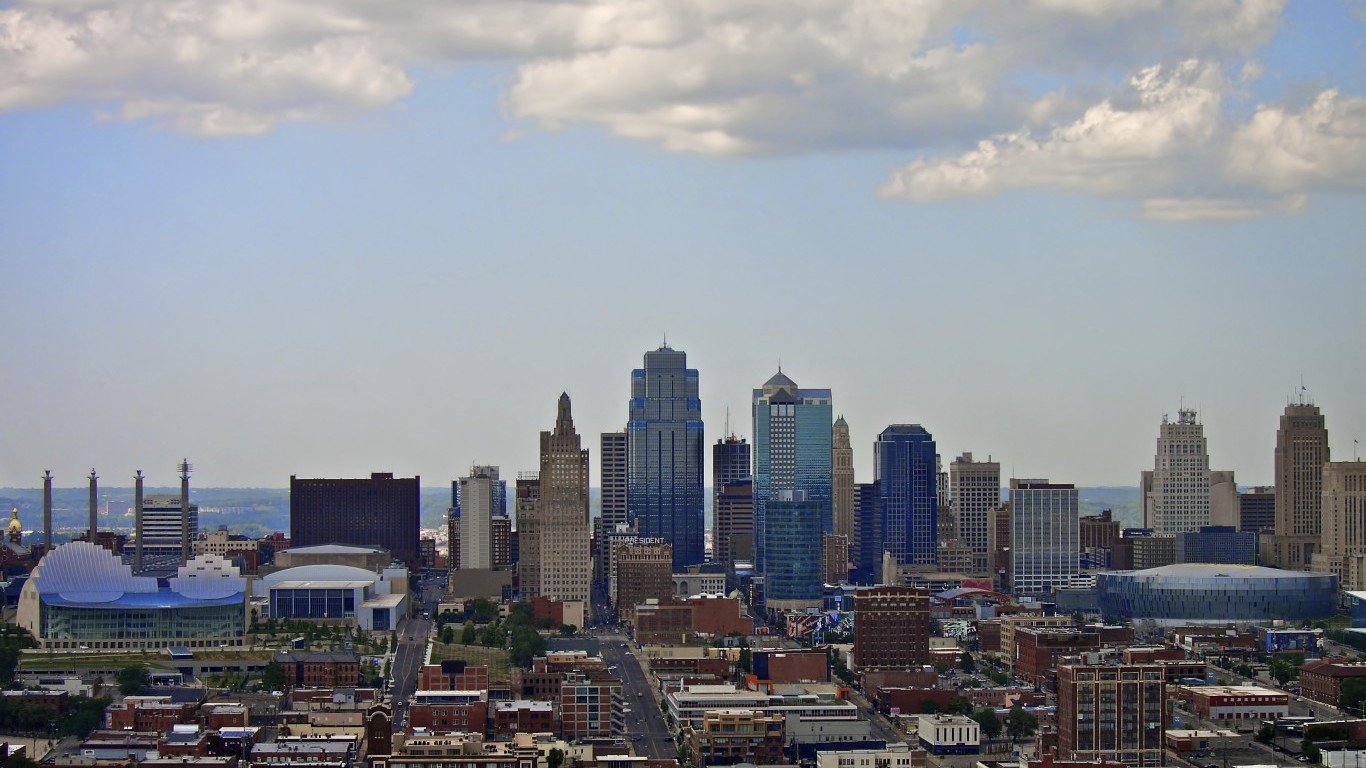
31. Missouri
> Pct. of population living in urban areas: 70.4%
> Median household income: $44,301 (14th lowest)
> Largest city: Kansas City, Missouri
> Population of largest city: 465,005

30. Idaho
> Pct. of population living in urban areas: 70.6%
> Median household income: $43,490 (13th lowest)
> Largest city: Boise City, Idaho
> Population of largest city: 211,655

29. Indiana
> Pct. of population living in urban areas: 72.4%
> Median household income: $44,613 (16th lowest)
> Largest city: Indianapolis, Indiana
> Population of largest city: 835,097
[nativounit]
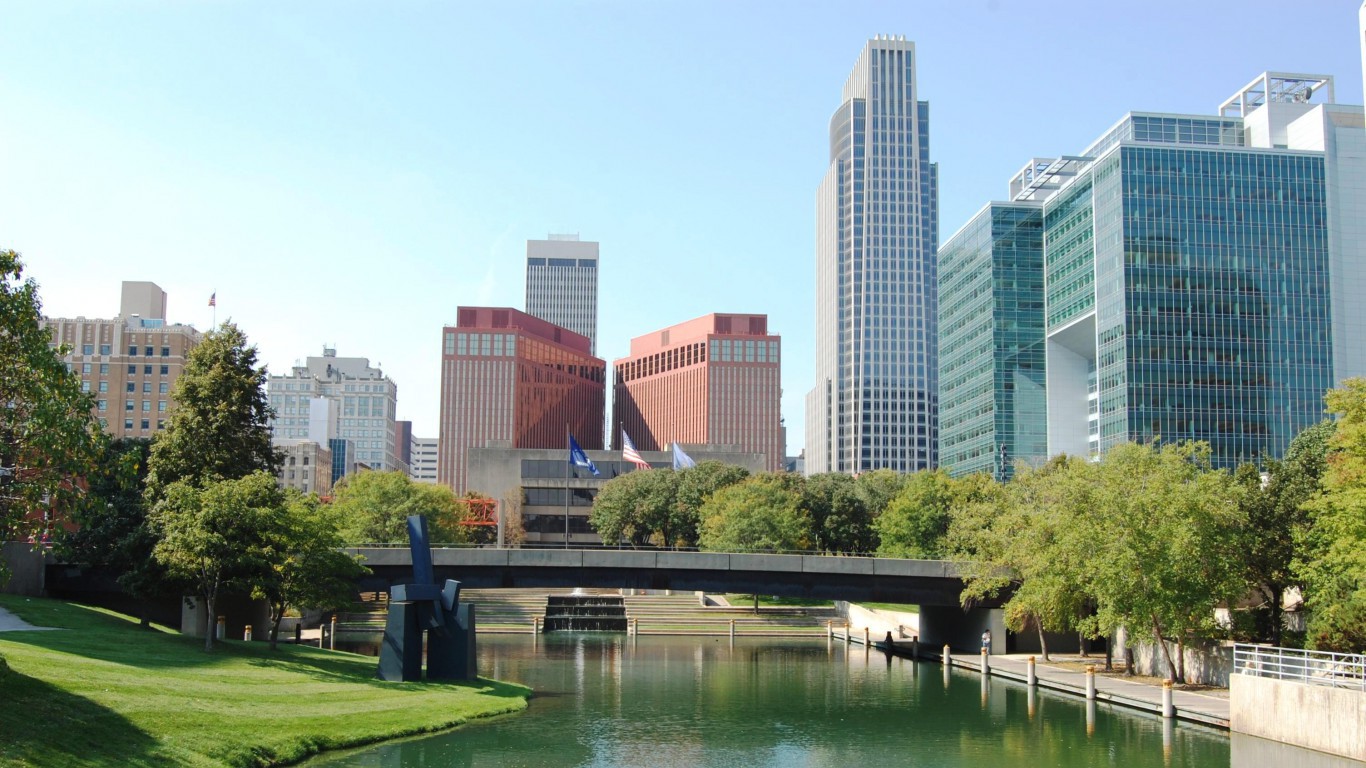
28. Nebraska
> Pct. of population living in urban areas: 73.1%
> Median household income: $48,408 (25th highest)
> Largest city: Omaha, Nebraska
> Population of largest city: 435,454

27. Louisiana
> Pct. of population living in urban areas: 73.2%
> Median household income: $42,505 (10th lowest)
> Largest city: New Orleans, Louisiana
> Population of largest city: 368,471
[recirclink id=331254]

26. Minnesota
> Pct. of population living in urban areas: 73.3%
> Median household income: $55,459 (12th highest)
> Largest city: Minneapolis, Minnesota
> Population of largest city: 394,424
25. Kansas
> Pct. of population living in urban areas: 74.2%
> Median household income: $48,257 (25th lowest)
> Largest city: Wichita, Kansas
> Population of largest city: 385,518

24. Michigan
> Pct. of population living in urban areas: 74.6%
> Median household income: $45,413 (18th lowest)
> Largest city: Detroit, Michigan
> Population of largest city: 695,437
[nativounit]

23. Georgia
> Pct. of population living in urban areas: 75.1%
> Median household income: $46,430 (21st lowest)
> Largest city: Atlanta, Georgia
> Population of largest city: 440,641
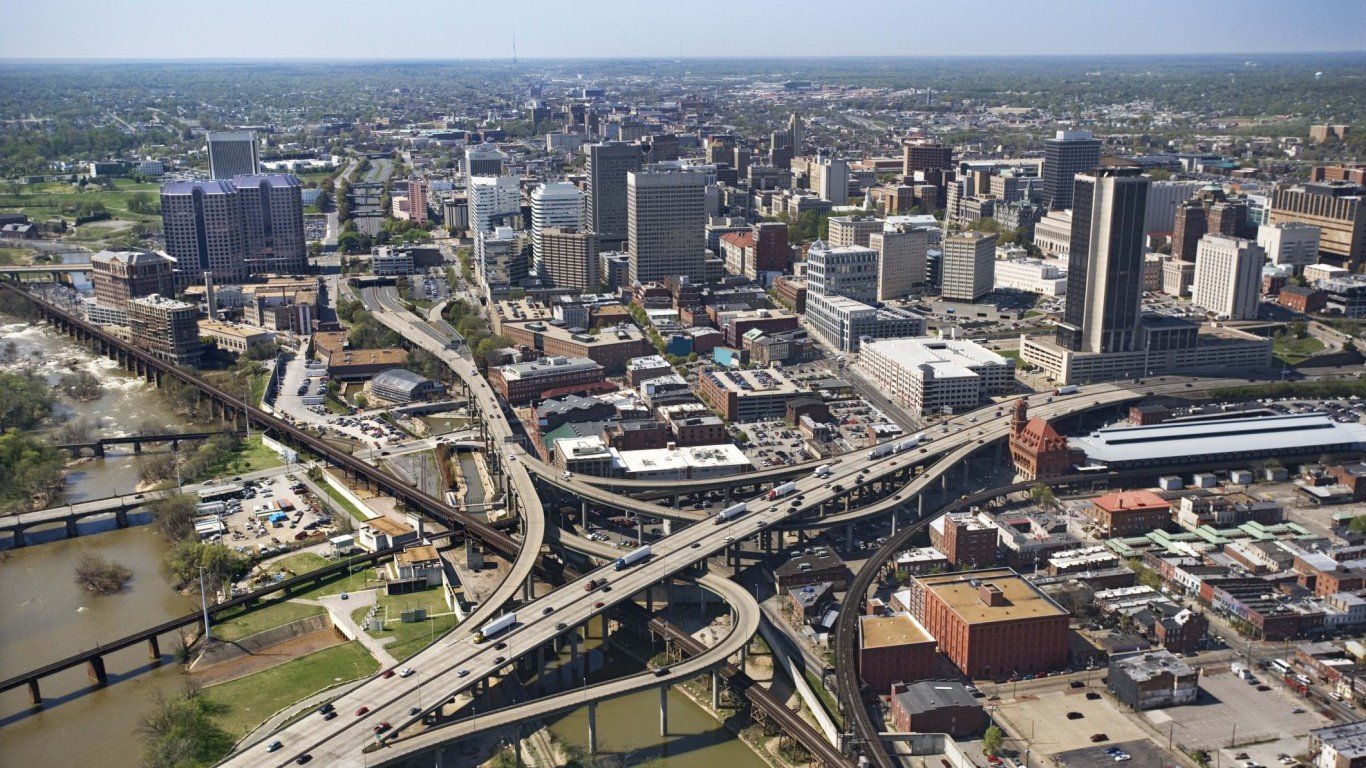
22. Virginia
> Pct. of population living in urban areas: 75.5%
> Median household income: $60,674 (8th highest)
> Largest city: Virginia Beach, Virginia
> Population of largest city: 445,623
[wallst_email_signup]

21. New Mexico
> Pct. of population living in urban areas: 77.4%
> Median household income: $42,090 (9th lowest)
> Largest city: Albuquerque, New Mexico
> Population of largest city: 553,576

20. Ohio
> Pct. of population living in urban areas: 77.9%
> Median household income: $45,090 (17th lowest)
> Largest city: Columbus, Ohio
> Population of largest city: 811,943

19. Pennsylvania
> Pct. of population living in urban areas: 78.7%
> Median household income: $49,288 (21st highest)
> Largest city: Philadelphia, Pennsylvania
> Population of largest city: 1.55 million
[recirclink id=330933]
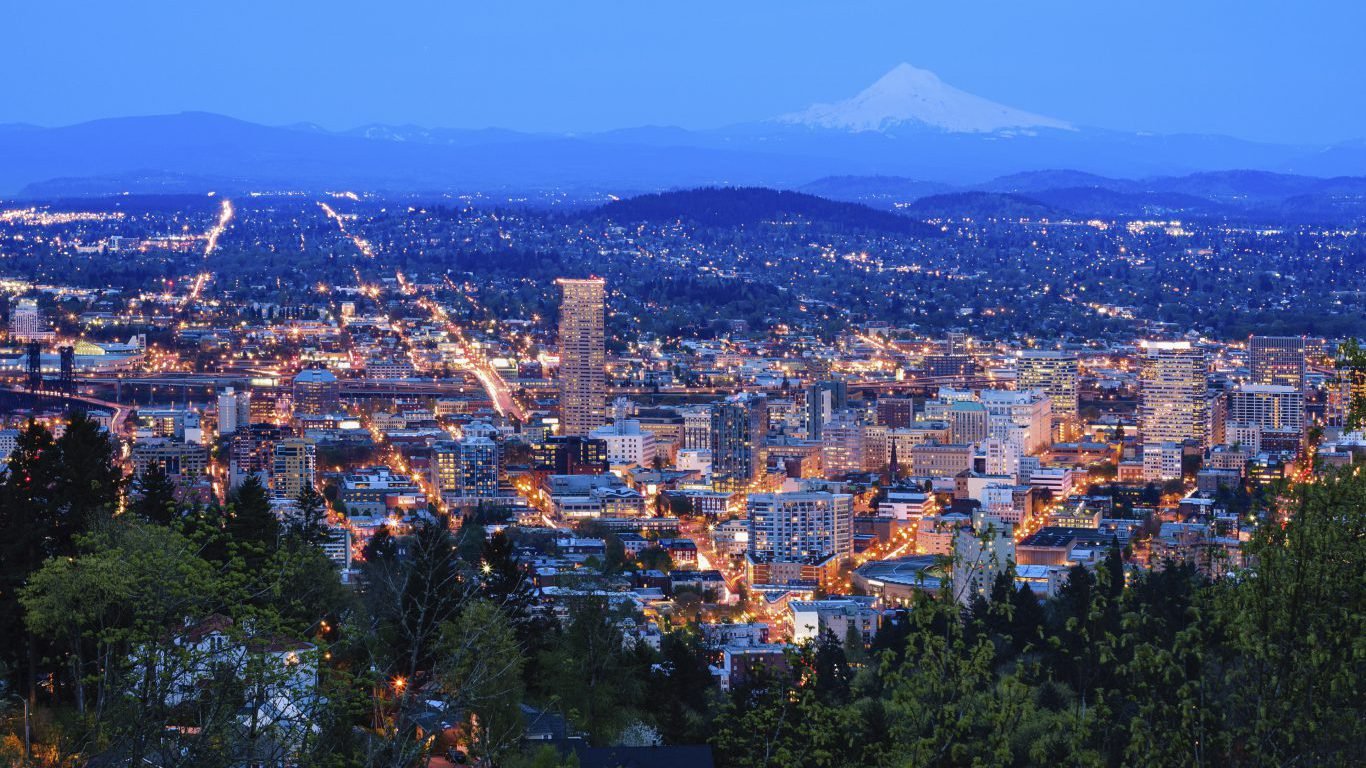
18. Oregon
> Pct. of population living in urban areas: 81.0%
> Median household income: $46,560 (22nd lowest)
> Largest city: Portland, Oregon
> Population of largest city: 602,568
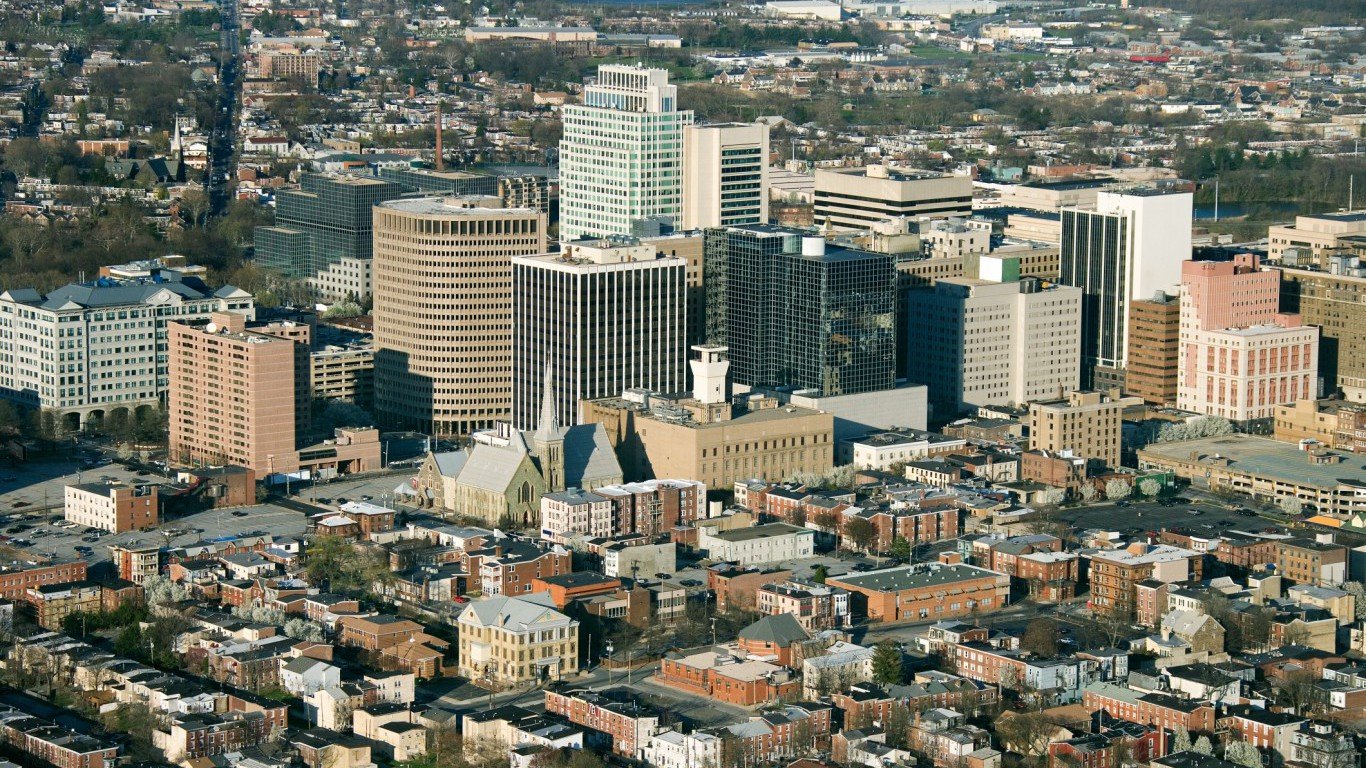
17. Delaware
> Pct. of population living in urban areas: 83.3%
> Median household income: $55,847 (10th highest)
> Largest city: Wilmington, Delaware
> Population of largest city: 71,263
[nativounit]

16. Washington
> Pct. of population living in urban areas: 84.1%
> Median household income: $55,631 (11th highest)
> Largest city: Seattle, Washington
> Population of largest city: 637,850

15. Texas
> Pct. of population living in urban areas: 84.7%
> Median household income: $48,615 (24th highest)
> Largest city: Houston, Texas
> Population of largest city: 2.17 million

14. Colorado
> Pct. of population living in urban areas: 86.2%
> Median household income: $54,046 (15th highest)
> Largest city: Denver, Colorado
> Population of largest city: 633,777
[wallst_email_signup]

13. Maryland
> Pct. of population living in urban areas: 87.2%
> Median household income: $68,854 (the highest)
> Largest city: Baltimore, Maryland
> Population of largest city: 622,271

12. New York
> Pct. of population living in urban areas: 87.9%
> Median household income: $54,148 (14th highest)
> Largest city: New York, New York
> Population of largest city: 8.35 million
[nativounit]

11. Connecticut
> Pct. of population living in urban areas: 88.0%
> Median household income: $64,032 (4th highest)
> Largest city: Bridgeport, Connecticut
> Population of largest city: 146,680

10. Illinois
> Pct. of population living in urban areas: 88.5%
> Median household income: $52,972 (17th highest)
> Largest city: Chicago, Illinois
> Population of largest city: 2.71 million

9. Arizona
> Pct. of population living in urban areas: 89.8%
> Median household income: $46,789 (23rd lowest)
> Largest city: Phoenix, Arizona
> Population of largest city: 1.49 million
[nativounit]
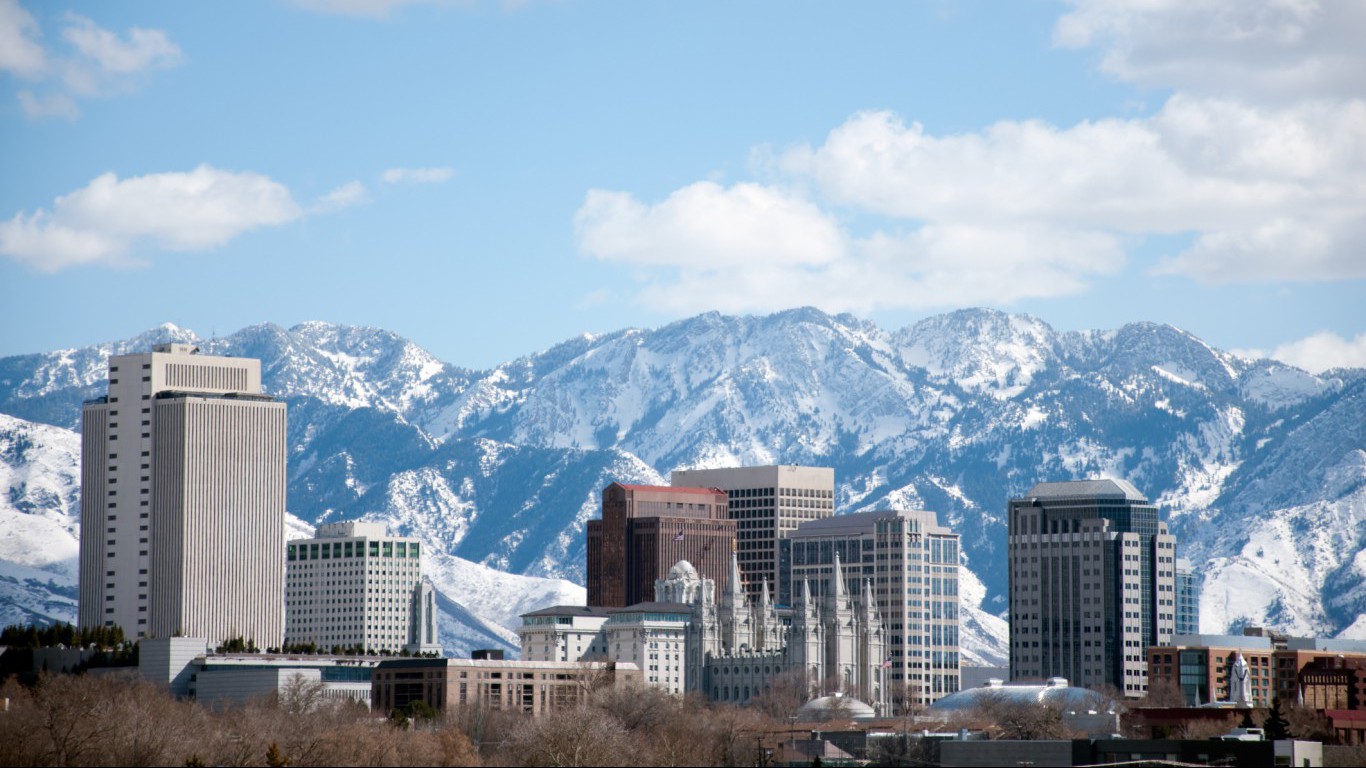
8. Utah
> Pct. of population living in urban areas: 90.6%
> Median household income: $54,744 (13th highest)
> Largest city: Salt Lake City, Utah
> Population of largest city: 189,267

7. Rhode Island
> Pct. of population living in urban areas: 90.7%
> Median household income: $52,254 (18th highest)
> Largest city: Providence, Rhode Island
> Population of largest city: 178,562
[recirclink id=330389]
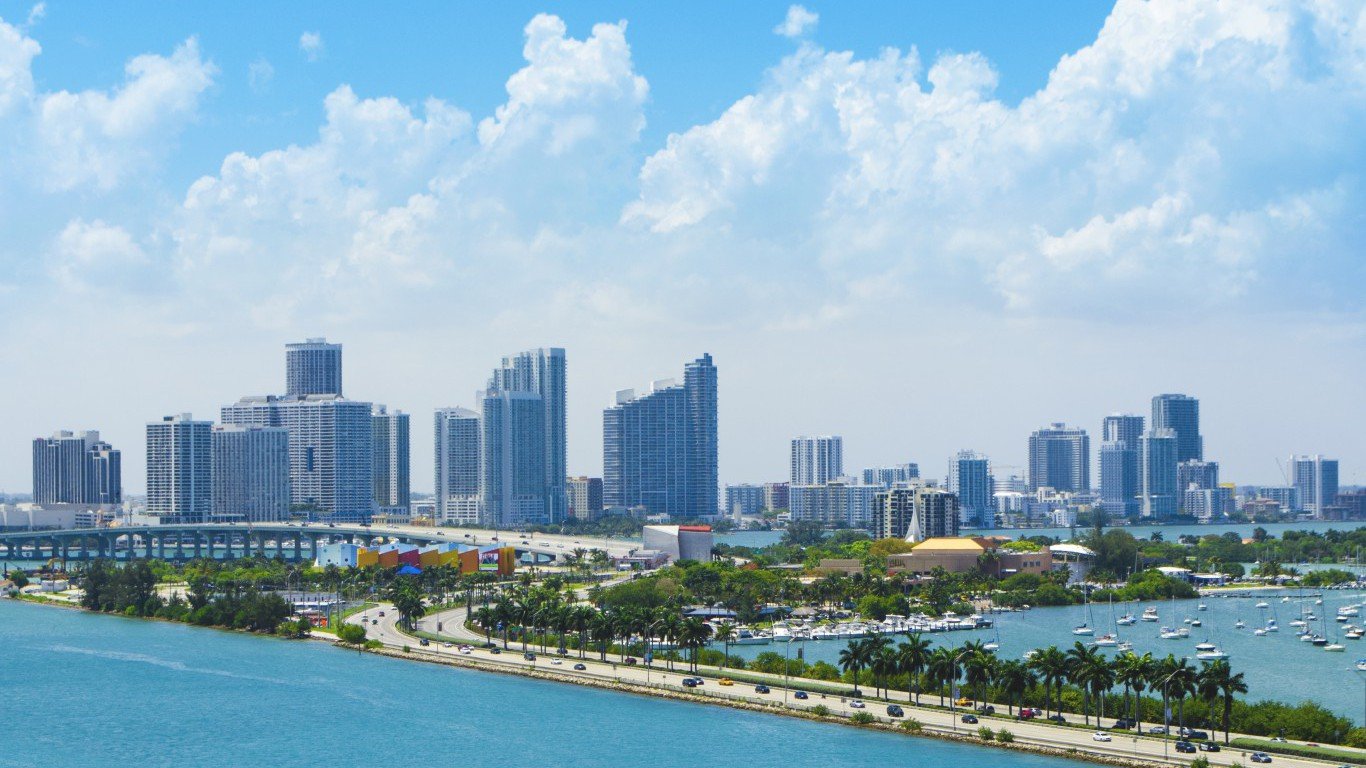
6. Florida
> Pct. of population living in urban areas: 91.2%
> Median household income: $44,409 (15th lowest)
> Largest city: Jacksonville, Florida
> Population of largest city: 837,533
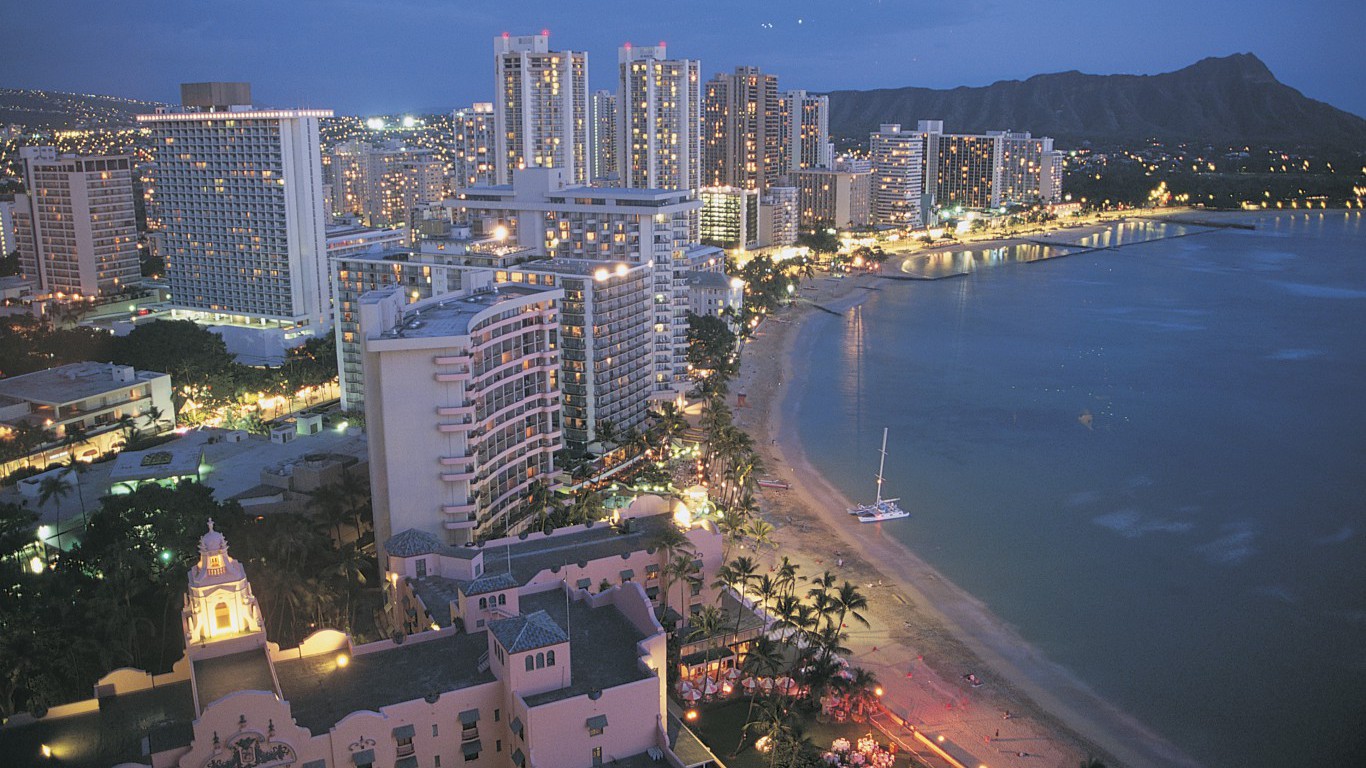
5. Hawaii
> Pct. of population living in urban areas: 91.9%
> Median household income: $63,030 (5th highest)
> Largest city: Honolulu, Hawaii
> Population of largest city: 345,130

4. Massachusetts
> Pct. of population living in urban areas: 92.0%
> Median household income: $62,072 (6th highest)
> Largest city: Boston, Massachusetts
> Population of largest city: 639,594
[nativounit]

3. Nevada
> Pct. of population living in urban areas: 94.2%
> Median household income: $51,001 (19th highest)
> Largest city: Las Vegas, Nevada
> Population of largest city: 597,353

2. New Jersey
> Pct. of population living in urban areas: 94.7%
> Median household income: $67,681 (2nd highest)
> Largest city: Newark, New Jersey
> Population of largest city: 278,750
[wallst_email_signup]

1. California
> Pct. of population living in urban areas: 95.0%
> Median household income: $57,708 (9th highest)
> Largest city: Los Angeles, California
> Population of largest city: 3.86 million
Contact [email protected] for any questions or corrections.