Americans take into consideration a number of factors when deciding where to live, including the quality of schools, the strength of the local economy and job market, the area’s safety and culture, as well as its climate.
Most, if not all people do not control where they are born, live, or move to. Millions of Americans find themselves in places that lack jobs, amenities, and security. While people love and hate cities for any number of reasons, there are some objective measures by which all cities can be compared.
To determine America’s worst cities to live in, 24/7 Wall St. reviewed data on the 550 U.S. cities with populations of 65,000 or more as measured by the U.S. Census Bureau. Based on a range of variables, including crime rates, employment growth, access to restaurants and attractions, educational attainment, and housing affordability, 24/7 Wall St. identified America’s 50 worst cities to live.
Click here to see the worst cities to live in.
Income is highly associated with a range of other social and economic factors. Because of its importance, financial status was a major component of the ranking. Low-income families tend to live in communities with less stable housing, worse health systems, greater exposure to stressors such as violent crime, less secure employment, and higher exposure to poor air quality and environmental toxins. While prospering under these conditions is certainly possible, these factors dramatically lower the likelihood of doing so.
Residents of the worst cities to live in tend to have lower incomes and higher poverty rates. Of the 50 worst cities, only eight have median incomes higher than the nationwide median households income of $53,657 a year. In 29 of the 50 cities, more than 25% of the population lives in poverty, in contrast with the national poverty rate of 15.5%.
How far a paycheck can go in a given city is just as important as the size of the paycheck — and some cities are far more expensive than others. Housing usually dominates household budgets. Nationwide, the typical home costs 3.4 times the annual typical household income. Housing is less affordable than it is nationally in half of the worst cities to live in. In San Francisco, the typical home costs 10 times the city’s annual median household income.
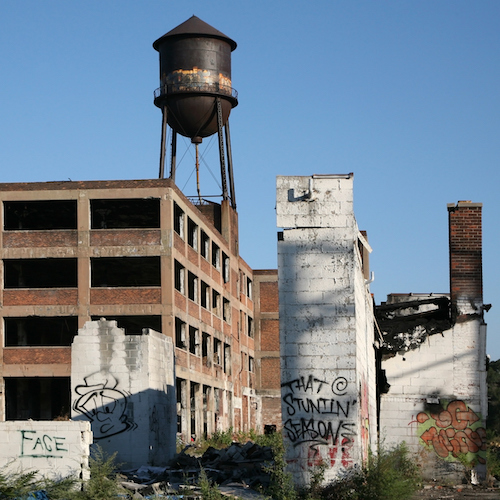
In the cities where housing is relatively affordable, the advantage is overshadowed by abysmal home values and struggling housing markets. This is most notably the case in Great Lakes cities such as Flint, Detroit, and Lansing, Michigan, as well as Youngstown and Akron, Ohio. While for some people in these areas a home can be bought outright on less than a year’s salary, the affordability is a sign of poor economic health.
Old industrial cities in the Great Lakes and Midwest regions of the United States in particular have been characterized by urban decay for decades. Across the nation, some forms of manufacturing — most notably computers and electronics — has surged in recent years. Broadly speaking, however, the United States is increasingly seen as an unattractive base for manufacturing production. As a result, over the past half-century, U.S. manufacturing employment has fallen precipitously, and some of the worst cities have felt the repercussions of this decline more severely than most U.S. cities.
Violence is closely associated with a range of negative social and economic outcomes for all involved, including incarceration, unstable employment, lower cognitive functioning among children, and anxiety. The violent crime rates in almost all of the worst cities to live is higher than the national rate of 366 reported incidents per 100,000 people. Even compared to other cities where in general violence is more common, these cities are not especially safe. In half of the 50, the violent crime rate exceeds 1,000 incidents per 100,000 people.
Click here to read our methodology.
These are the worst cities to live in.
Correction: In a previous version of this article, we wrote the average income of the top 1% of earners in Miami was roughly $20 million. In fact, the average income among the top 1% of earners in the Miami area is roughly $2 million. The error has been corrected.
50. Bellingham, Washington
> Population: 83,363
> Median home value: $303,900
> Poverty rate: 21.4%
> Pct. with at least a bachelor’s degree: 43.7%
Based on a range of economic and social factors and outcomes, Bellingham, Washington is among the 50 worst cities to live in. A typical home in the city is valued at more than $300,000, considerably higher than the national median home value of $181,200. While this suggests some level of prosperity among residents, compared to area income levels, area housing is not particularly affordable. The median home value is 7.3 times greater than the median income, making Bellingham one of the least affordable cities in the country.
The city’s population is relatively well educated — 43.7% of adults have at least a bachelor’s degree, compared to a national share of 30.1%. While greater educational attainment typically leads to higher incomes, Bellingham also has a higher than average poverty rate. In Bellingham, 21.4% of residents live in poverty, far more than the national 15.5% poverty rate.
49. Palo Alto, California
> Population: 66,968
> Median home value: 1,000,000+
> Poverty rate: 4.3%
> Pct. with at least a bachelor’s degree: 80.4%
Compared to the average American, Palo Alto residents are exceptionally affluent. The typical area household earns $151,370 a year, nearly three times the corresponding national figure. Additionally, only 4.3% of people live in poverty, one of the smallest such shares of any U.S. city. With such high incomes, it is perhaps not surprising that more than four in every five adults in the city have earned a bachelor’s degree, the highest proportion of all cities and over two and a half times the national bachelor’s attainment rate.
Incomes among Palo Alto households, while high, are likely inadequate for many to afford buying property. The median home value in Palo Alto is at least $1 million, 6.6 times greater than the area’s median household income, nearly double the comparable ratio for the nation.
[nativounit]
48. Chico, California
> Population: 89,187
> Median home value: $275,600
> Poverty rate: 24.7%
> Pct. with at least a bachelor’s degree: 38.7%
Nearly 40% of adults in Chico have at least a bachelor’s degree, well above the national attainment rate. The high level of qualification among city residents, however, has not translated to high income. Chico’s median household income of $40,815 a year is well below the median income nationwide, and the area’s roughly 25% poverty rate is one of the highest in the country. Not only are area incomes relatively low, but also housing is relatively more expensive. The typical area home is valued at $275,600, well above the median home value nationwide and is 6.8 times the annual income level in the area. Across the nation, the typical home value is equal to 3.4 times the median income.
47. Boston, Massachusetts
> Population: 656,051
> Median home value: $413,500
> Poverty rate: 22.6%
> Pct. with at least a bachelor’s degree: 46.5%
While not nearly as large as New York City or Los Angeles, Boston is one of the nation’s largest cities. With some of the world’s largest research institutions and universities, which attract top talent from around the world, the city’s population is also very well educated. Close to half of Boston adults have at least a bachelor’s degree, one of the highest college attainment rates of any U.S. city. Despite the high level of education, incomes in Boston are relatively low, especially when the cost of living — including housing — is taken into account. The area’s median household income of $56,902 a year is only slightly higher than the national median income. Housing, however, is much more expensive. So while the typical home value nationwide is equal to 3.4 times the median income nationwide, housing costs in Boston are 7.3 times the area’s median income — one of the least affordable housing markets in the country.
Many of those working in the city’s high paying jobs likely live in Boston’s more prosperous, surrounding suburban areas such as Brookline and Cambridge.
[recirclink id=339889]
46. Washington D.C.
> Population: 658,893
> Median home value: $486,900
> Poverty rate: 17.7%
> Pct. with at least a bachelor’s degree: 55.0%
The nation’s capital is home to some of the nation’s highest paying jobs — not just in government, but also in large defense companies such as Lockheed Martin and General Dynamics, which thrive on lucrative government contracts. Privately owned food manufacturer Mars is also based in the region. For every 100,000 Washington D.C. residents there are about five universities, and the city’s population is very well educated. More than half of adults have at least a bachelor’s degree. The prosperity is not well distributed, however, and living in D.C. is no guarantee of a high standard of living. The typical home is valued at $486,900, one of the highest median home values of any city in the country. With a poverty rate of 17.7% — higher than the national rate — some in the city struggle to afford housing. Many residents may also lack the peace of mind more common in safer areas. D.C.’s annual violent crime rate of 1,185 incidents per 100,000 people is one of the highest in the nation.
45. Davis, California
> Population: 66,733
> Median home value: $527,000
> Poverty rate: 28.5%
> Pct. with at least a bachelor’s degree: 72.2%
In Davis, California, 72.2% of area adults have at least a bachelor’s degree, more than double the nationwide college attainment rate. The city is home to UC Davis, one of the largest universities in California’s public school system, which may explain the area’s high college attainment rate. High educational attainment rates typically accompany low poverty rates. In Davis, however, 28.5% of the population lives below the poverty line, nearly double the nationwide poverty rate. For many residents, owning property in the city may be too expensive. The median home value in Davis of $527,000 is more than $100,000 greater than the value of a typical California home and close to 10 times the city’s median household income. This means housing in the area is about three times less affordable than it is across the nation.
44. New York, New York
> Population: 8,491,079
> Median home value: $496,200
> Poverty rate: 20.9%
> Pct. with at least a bachelor’s degree: 35.9%
New York City is home to some of the wealthiest and most financially successful people in the world. It is also home to some of the poorest. More than one in every five people live in poverty in New York City, which also happens to be one of the most expensive cities in the country to live. A recent report from left-leaning non-profit think tank Economic Policy Institute identified the New York metro area as one of the most unequal U.S. cities. The average income among the top 1% of earners is approximately $2.2 million a year, dwarfing the average of $54,895 for the remaining 99% of New York City workers. Like most of the worst cities to live in, sky-high housing prices make New York City one of the least affordable in the country. The typical home value is nearly 10 times the median household income. Nationwide, a typical home costs 3.4 times the national median income, by contrast. Virtually all living costs — housing, groceries, utilities, transportation, etc. — are more expensive in NYC than across the country.
[nativounit]
43. Newark, New Jersey
> Population: 280,577
> Median home value: $216,200
> Poverty rate: 28.2%
> Pct. with at least a bachelor’s degree: 13.7%
New York is the most populous, economically robust metropolitan area in the country. Not all parts of the metro area are especially great places to live. Located roughly 15 miles from midtown Manhattan, goods and services are pricey in Newark. As a whole, the cost of living in Newark is 21.6% higher than it is across the country as a whole. Housing is particularly expensive, costing about 50% more than housing costs nationwide. Not only does a dollar not go as far in the New Jersey city, the median household income in Newark is about $17,700 lower than the national median income.
Newark is not particularly affordable, nor is it especially safe. There are 1,078 violent crimes a year in Newark for every 100,000 residents, far more than the national violent crime rate of 366 incidents per 100,000 people.
42. San Francisco, California
> Population: 852,469
> Median home value: $846,800
> Poverty rate: 12.0%
> Pct. with at least a bachelor’s degree: 54.2%
San Francisco has some of the most expensive properties in the country. A typical home in the city is worth $846,800, more than double the value of a typical California home and more than three times the cost of a typical American home. Housing costs are likely driven up by rapid population growth. In the last 10 years, the San Francisco population has expanded 18.6%.
Higher incomes in the area are not enough to compensate for the higher costs. The typical San Francisco household earns $85,070 a year, far more than most American households. However, goods and services cost over 60% more in San Francisco than they do across the nation as a whole, the highest cost of living of any U.S. city. In addition, a typical area home costs 10 times more than what a typical area household earns each year.
[wallst_email_signup]
41. Santa Barbara, California
> Population: 91,208
> Median home value: $883,600
> Poverty rate: 15.8%
> Pct. with at least a bachelor’s degree: 46.9%
Located along the Pacific Coast in Southern California, for some residents Santa Barbara might be considered a paradise. Also, a number of the city’s economic and social measures are better than national averages. For example, 46.9% of area adults have at least a bachelor’s degree, a far greater share than the 30.1% of American adults with similar educational attainment. With more college educated adults, incomes are also higher than average in Santa Barbara. The area’s median household income of $62,340 a year is higher than both the state and national figures.
However, the median home value in the city of $883,600 is more than double the value of a typical California home and 14.2 times the city’s median household income. As a result, Santa Barbara’s housing market is the least affordable in the United States.
40. Oakland, California
> Population: 413,782
> Median home value: $499,400
> Poverty rate: 20.1%
> Pct. with at least a bachelor’s degree: 39.3%
The typical Oakland household earns $56,188 a year, slightly more than the $53,657 the typical American household earns. However, the benefits that come with higher incomes are largely offset by a high cost of living. The cost of goods and services in Oakland is 27.4% higher than it is across the country on average. The area’s higher cost of living only increases the economic woes of the most vulnerable city residents. Slightly more than 20% of Oakland residents live below the poverty line, a considerably higher share than the 15.5% national poverty rate.
As in many cities with higher than average poverty, crime is a major problem in Oakland. There are 1,685 violent crimes a year in the city for every 100,000 residents, one of the highest violent crime rates of any U.S. city.
39. Toledo, Ohio
> Population: 281,014
> Median home value: $80,700
> Poverty rate: 26.8%
> Pct. with at least a bachelor’s degree: 20.1%
Individual prosperity is relatively uncommon in Toledo. More than one in four city residents live in poverty, one of the highest poverty rates of any U.S. city. On top of its economic woes, Toledo is also a relatively dangerous place to live. There are 1,091 violent crimes a year for every 100,000 city residents, roughly three times the national violent crime rate of 366 incidents per 100,000 people. The city’s population has shrunk by 11.1% over the last five years, yet another indication of economic and social problems.
One positive aspect of living in Toledo is the city’s relatively low cost of living. Area residents pay roughly 9% less for goods and services than the typical American.
[recirclink id=338263]
38. Cincinnati, Ohio
> Population: 298,162
> Median home value: $116,200
> Poverty rate: 30.0%
> Pct. with at least a bachelor’s degree: 34.6%
Educational attainment is considerably higher in Cincinnati than it is across the country as a whole. Nearly 35% of area adults have at least a bachelor’s degree compared to only 30% of American adults. While higher educational attainment typically leads to higher incomes, incomes in Cincinnati are strikingly low. The typical city household earns only $32,688 a year, roughly $21,000 less than the typical American household.
Cincinnati’s birth rate has slowed, and people have left the city in droves. The Ohio city’s population dropped by 10.5% in the last five years.
37. Tucson, Arizona
> Population: 527,948
> Median home value: $126,500
> Poverty rate: 25.3%
> Pct. with at least a bachelor’s degree: 25.6%
For desert lovers, outdoor adventurers, and natural art enthusiasts, Tucson may be an ideal city. Looking at economic and social measures, however, Tucson’s population is worse off than those in most American cities. More than 25% of the population lives in poverty, for example, well above the national poverty rate of 15.5%.
Property crimes, such as auto theft and burglary, are relatively common in Tucson. The city’s property crime rate of 6,582 reported incidents per 100,000 people is more than double the national property crime rate and higher than in all but five other U.S. cities.
[nativounit]
36. Peoria, Illinois
> Population: 117,288
> Median home value: $124,300
> Poverty rate: 21.3%
> Pct. with at least a bachelor’s degree: 37.0%
Like a number of the worst cities to live in, Peoria’s workforce once relied heavily on manufacturing. As early as 1990, 37,000 area workers were employed in the industry. As of April 2016, the industry employee count was 23,700. Despite its decline, the city still relies on the industry for employment. The sector still employs 13.9% of the workforce, a higher proportion than the national share of 10.3%. Like other cities with relatively large manufacturing industries, Peoria’s economy is struggling. The unemployment rate peaked at 13.7% in July 2009. Still at 7.4% as of this past April, the city’s job market has not completely recovered.
35. Lorain, Ohio
> Population: 63,774
> Median home value: $84,600
> Poverty rate: 25.6%
> Pct. with at least a bachelor’s degree: 12.1%
High paying jobs typically require some post secondary education. In Lorain, Ohio, only 12.1% of adults have a bachelor’s degree, a considerably smaller share than the national 30.1% college attainment rate. Perhaps not surprisingly, Lorain residents earn far less than most Americans. The typical area household makes just $36,266 annually, roughly $17,400 less than the typical American household. In addition, more than one-quarter of Lorain residents live below the poverty line, a much larger share than the 15.5% national poverty rate.
Like many other cities that have been struggling economically, Lorain’s population has dwindled, falling 9.2% in the last five years.
34. Racine, Wisconsin
> Population: 78,054
> Median home value: $104,400
> Poverty rate: 21.3%
> Pct. with at least a bachelor’s degree: 18.8%
Racine lags behind Wisconsin in several key social and economic measures. More than one in five area residents live in poverty, a much higher poverty rate that Wisconsin’s 13.2% rate. Additionally, the city’s median household income of $40,378 a year is about $12,000 less than the state’s annual median household income, and about $13,000 less than a typical American household income. Adding to the difficulty of living in the city is Racine’s relatively high crime rate. Violent crimes such as rape and assault, as well as property crimes, including burglary and motor vehicle theft, are more common in Racine than they are across the state and the country as a whole.
Many Racine residents also pay more in taxes than most Americans. The typical homeowner in the city pays 2.9% of their total home value in taxes each year, more than double the rate the typical American pays.
[wallst_email_signup]
33. Akron, Ohio
> Population: 197,846
> Median home value: $80,300
> Poverty rate: 22.7%
> Pct. with at least a bachelor’s degree: 19.8%
The typical Akron household earns $34,781 a year, nearly $19,000 less than the typical American household. Property values in the city are also far lower than average. The typical Akron home is worth $80,300, less than the $129,100 value of a typical Ohio home and far less than the $181,200 value of a typical American home. Akron is also relatively dangerous. Violent crime is more than twice as common in the city as it is across the state as a whole.
Despite certain shortcomings, Akron has plenty of venues for socializing. There are 61 bars for every 100,000 city residents, more than triple the number of bars per capita nationwide. In addition, there are about 306 restaurants and cafes for every 100,000 people, far more than than the concentration nationwide of 238 such establishments per 100,000 people.
32. South Bend, Indiana
> Population: 103,019
> Median home value: $79,100
> Poverty rate: 26.5%
> Pct. with at least a bachelor’s degree: 24.6%
Once home to a vibrant car manufacturing industry, specifically home to Studebaker’s headquarters and manufacturing, South Bend is now among America’s old, economically depressed industrial towns. South Bend’s manufacturing industry still employs 17.0% of the city’s workforce, in contrast with the national share of 10.3% employed in the industry. But like many other cities with large manufacturing sectors, the city is not wealthy. More than one-quarter of South Bend residents live in poverty, one of the highest rates of any city. The typical home in the area is worth $79,100, less than half the national median of $181,200.
The city is recovering relatively rapidly, however. Employment rose by 7% over the past several years, considerably faster than the national employment growth rate of 4.1%.
[nativounit]
31. Kansas City, Missouri
> Population: 470,816
> Median home value: $132,300
> Poverty rate: 17.8%
> Pct. with at least a bachelor’s degree: 31.7%
While higher educational attainment often accompanies higher incomes and lower crime rates in many U.S. cities, Kansas City is an exception. Nearly 32% of adults in Kansas City have a bachelor’s degree, a slightly higher share than the national 30% college attainment rate. Despite a more educated population, the typical Kansas City household earns only $44,173 a year, roughly $9,500 less than the typical American household. However, lower incomes are offset by a lower cost of living. Goods and services are about 5% cheaper in Kansas City than they are on average across the United States.
Crime is a major detriment to quality of life in Kansas City. There are 1,251 violent crimes a year for every 100,000 people in the area, a higher violent crime rate than those in only a couple dozen other U.S. cities.
30. Knoxville, Tennessee
> Population: 184,292
> Median home value: $119,500
> Poverty rate: 31.2%
> Pct. with at least a bachelor’s degree: 28.8%
Knoxville is a city full of social amenities. There are about 406 restaurants, cafes, and eateries for every 100,000 people, far more than the national rate of 238 such establishments per 100,000 Americans. In addition, the city has far more museums, movie theatres, and fitness and recreation centers per capita than the nationwide average concentration. However, such entertainment and cultural venues may be too costly to enjoy for many Knoxville residents’ budgets. The typical area household earns only $31,048 a year, about $22,600 less than the typical American household. In addition, the city’s 31.2% poverty rate is more than double the national poverty rate.
Knoxville residents also have to worry about property crime such as burglary and arson more often than the typical American. There are 6,524 property crimes a year for every 100,000 city residents, more than double both the statewide and national property crime rates.
29. Springfield, Illinois
> Population: 116,649
> Median home value: $117,700
> Poverty rate: 20.4%
> Pct. with at least a bachelor’s degree: 34.5%
Cities with a more educated population typically have higher incomes and a lower violent crime rate. However, this is not the case in Springfield, Illinois. In Springfield, 34.5% of adults have a bachelor’s degree, a larger share than the 30.1% of American adults. Despite the larger share of educated residents, the typical area household earns only $48,896 a year, less than the $53,657 the typical American household earns. In addition, more than a fifth of the city’s population lives below the poverty line, a larger share than the 15.5% national poverty rate.
Violent crime is also far more common in Springfield than it is across the United States. There are 1,065 violent crimes in the city for every 100,000 residents, nearly three times the national violent crime rate.
[nativounit]
28. Lansing, Michigan
> Population: 113,659
> Median home value: $75,700
> Poverty rate: 26.2%
> Pct. with at least a bachelor’s degree: 27.3%
The median household income in Lansing is nearly the lowest in the country. The typical area household earns only $36,567 a year, far less than the $53,657 the typical American household earns. With lower-than-average incomes, the city also has a high poverty rate. More than one quarter of area residents live below the poverty line, well above the 15.5% national poverty rate.
While the U.S. population has grown by 10.6% in the last decade, Lansing’s population has actually declined by 5.0%. A likely consequence of a shrinking population is declining property values. The median home value in Lansing is only $75,700, less than half the $181,200 the typical American home is worth.
27. Lawrence, Massachusetts
> Population: 78,192
> Median home value: $221,900
> Poverty rate: 26.9%
> Pct. with at least a bachelor’s degree: 12.6%
Lawrence’s economy is dominated by industries that tend to pay low wages — industries such as manufacturing, social assistance, and retail trade. As a result, the city’s median household income is only $38,186 a year, far less than the $53,657 median income nationwide and even further from the $69,160 statewide median income. A high cost of living further exacerbates residents’ financial challenges. Located in the Boston metro area, goods and services are roughly 25% costlier in Lawrence than they are on average across the country.
Lawrence also has a problem with violent crime. While the city’s property crime rate is roughly in line with the national rate, the violent crime rate is far higher. There are 1,094 violent crimes in Lawrence for every 100,000 residents, far more than the national violent crime rate of 366 reported incidents per 100,000 people.
[recirclink id=339892]
26. Baltimore, Maryland
> Population: 622,793
> Median home value: $150,800
> Poverty rate: 23.6%
> Pct. with at least a bachelor’s degree: 30.0%
Baltimore residents struggle with several negative economic and social conditions. While the cost of living is close to 12% higher in Baltimore than it is on average across the country, incomes are not high enough to offset the higher cost of living. In fact, a typical household in the city earns only $42,665 a year, roughly $11,000 less than the national median income. Baltimore has a higher than average poverty rate of 23.6%, more than double the corresponding statewide rate.
A high violent crime rate also significantly detracts from quality of life in Baltimore. There are 1,339 violent crimes for every 100,000 residents a year, more than three times the national violent crime rate.
25. Camden, New Jersey
> Population: 77,317
> Median home value: $82,700
> Poverty rate: 36.5%
> Pct. with at least a bachelor’s degree: 7.8%
Opportunities to socialize and the presence of entertainment venues help increase the quality of life in a community. Camden has very few social amenities. There are only 163.0 restaurants, cafes, or similar eateries for every 100,000 people in the city, far fewer than the national concentration of 238.4 per 100,000 people nationwide. An increase in the number of such establishments would likely make the city a more attractive place to live.
Camden has more serious economic problems than the lack of leisure time amenities, as well as environmental problems. Only 7.8% of area adults have a bachelor’s degree, far fewer than the 30.1% of American adults. This likely makes the area less attractive to businesses seeking highly-skilled workers. Low air quality can greatly increase certain health risks, and the air quality is hazardous 8.1% of days each year in Camden, far more than the national 5.9% share of low air quality days.
24. Houston, Texas
> Population: 2,240,796
> Median home value: $134,500
> Poverty rate: 22.4%
> Pct. with at least a bachelor’s degree: 30.4%
Home to more than 2.2 million people, Houston is one of the biggest cities in the country. While many major cities have a high cost of living, Houston does not. Goods and services are about 5% less expensive in Houston than they are on average across the country. Despite the benefits of a low cost of living, 22.4% of Houston residents live in poverty, a larger share than the 17.2% state poverty rate and the 15.5% national rate.
In addition to poverty, Houston also has a crime problem. There are 991 violent crimes and 4,694 property crimes for every 100,000 city residents each year, far more than the 366 violent crimes and 2,596 property crimes per 100,000 people nationwide.
[nativounit]
23. Springfield, Massachusetts
> Population: 153,994
> Median home value: $146,900
> Poverty rate: 31.7%
> Pct. with at least a bachelor’s degree: 17.3%
Making ends meet is difficult for many Springfield residents. The typical area household earns only $33,425 a year, less than half the income the typical Massachusetts household earns annually. Making matters worse, goods and services are nearly 8% more expensive in Springfield than they are on average nationwide. Springfield’s poverty rate of 31.7%, which does not account for cost of living, is one of the highest poverty rates of any city in the country.
The city’s woes are not only economic. Springfield’s annual violent crime rate of 1,081 reported incidents per 100,000 residents is nearly three times the corresponding national rate.
22. Milwaukee, Wisconsin
> Population: 599,653
> Median home value: $111,900
> Poverty rate: 29.0%
> Pct. with at least a bachelor’s degree: 23.5%
Like many of the once-thriving American industrial cities, Milwaukee’s economy is suffering from a number of social and economic difficulties. While the cost of living is about 5% lower in Milwaukee than it is across the country as a whole, incomes are also far lower than the national median. The typical household in the city earns only $35,049 a year, about $17,600 less than the typical Wisconsin household and $18,600 less than the typical American household.
Violent crime is also a major problem in Milwaukee. With 1,476 reported incidents of violent crime a year for every 100,000 residents, violent crimes are about four times more common in Milwaukee than across the nation as a whole.
[wallst_email_signup]
21. Albany, Georgia
> Population: 73,016
> Median home value: $100,600
> Poverty rate: 34.4%
> Pct. with at least a bachelor’s degree: 18.2%
As a whole, the population of Albany, Georgia is among the poorest in the country. The typical area household earns only $29,613 a year, far less than the $53,657 median household income nationwide. Poverty is also relatively common in Albany. More than a third of the city’s residents live below the poverty line, a larger share than in all but a handful of other U.S. cities.
Low incomes in the area are largely explained by industry composition. Industries such as services, retail, and manufacturing make up a larger share of the city’s economy than is typical across the country. Such industries tend to offer low-skilled, low-paying jobs. Perhaps not surprisingly, the city’s work force has lower education levels than much of the country. Only 18.2% of adults in Albany have a bachelor’s degree, a considerably smaller share than the 30.1% national college attainment rate.
20. Youngstown, Ohio
> Population: 65,051
> Median home value: $44,600
> Poverty rate: 40.7%
> Pct. with at least a bachelor’s degree: 13.2%
A typical Youngstown household earns only $22,321 a year, the lowest median household income of any city in the country. More than 40% of city residents live below the poverty line, a higher poverty rate than in any other U.S. city. Financial insecurity is not the only problem with which Youngstown residents struggle. There are 656 violent crimes a year in the city for every 100,000 residents, far more than the 366 incidents per 100,000 people violent crime rate nationwide.
Poor economic and social conditions are leading to rapid population decline in Youngstown. In the last five years, the city’s population has shrunk by 10.2%.
19. Wilmington, Delaware
> Population: 71,808
> Median home value: $180,100
> Poverty rate: 26.8%
> Pct. with at least a bachelor’s degree: 31.1%
Wilmington is one of the most dangerous cities in the country. There are 1,637 violent crimes in Wilmington for every 100,000 city residents, about 4.5 times the national violent crime rate. City residents also suffer from unfavorable economic conditions. The typical area household earns only $40,998, far less than the $53,657 the typical American household earns. In addition to lower incomes, a dollar does not go as far in Wilmington as it does nationwide. Goods and services cost 17.1% more in Wilmington than they do across the country on average.
Poor economic and social conditions in the Delaware city are likely driving people away. In the last five years, Wilmington’s population declined by 1.8%.
[recirclink id=339926]
18. Rockford, Illinois
> Population: 148,996
> Median home value: $87,400
> Poverty rate: 24.5%
> Pct. with at least a bachelor’s degree: 22.3%
Property values in Rockford, Illinois are strikingly low. A typical home in the city is worth only $87,400, far less than the $181,200 a typical home is worth nationwide. A declining population is likely not helping property values in the area. In the last five years, the city’s population has shrunk by 6.2%. The prevalence of crime may be one reason people are leaving Rockford. There are 1,235 violent crimes for every 100,000 residents in Rockford, a higher violent crime rate than in all but a few other U.S. cities.
While Rockford is fraught with problems, it is a relatively inexpensive place to live. Goods and services are roughly 12% cheaper in the city than they are on average across the country.
17. Mount Vernon, New York
> Population: 68,455
> Median home value: $344,800
> Poverty rate: 16.9%
> Pct. with at least a bachelor’s degree: 28.4%
Westchester County, New York, is one of the wealthiest in the United States. Not all parts of the county, however, are prosperous. The median household income in Mount Vernon is only $47,414, well below the national median income of $53,657. The cost of living in Mount Vernon is 35.6% higher than it is across the country as a whole, further adding to the financial burden for some residents. Relatively high home values and property tax rates contribute largely to the area’s high cost of living. The median home value in Mount Vernon is $344,800, far more than the national median home value of $181,200. Residents also pay 2.7% of the value of their property in taxes, more than double the national percentage of 1.2%.
[nativounit]
16. Canton, Ohio
> Population: 72,274
> Median home value: $69,900
> Poverty rate: 33.4%
> Pct. with at least a bachelor’s degree: 14.4%
Home in Canton, Ohio are among the least valuable in the country. The typical area home is worth only $69,900, less than in all but eight other U.S. cities. Incomes in the city are also among the lowest in the country. The typical area household earns only $29,497 a year, roughly $20,000 less than the typical Ohio household and more than $24,000 below the $53,657 nationwide median.
More than a third of city residents live in poverty, more than double both the state and national poverty rates.
Another problem faced by Canton’s residents is the prevalence of crime in the city. There are more than 1,000 violent crimes per 100,000 people in the city, close to three times the national violent crime rate.
15. St. Louis, Missouri
> Population: 317,419
> Median home value: $113,800
> Poverty rate: 28.5%
> Pct. with at least a bachelor’s degree: 32.0%
St. Louis is one of the most crime ridden cities in the United States. There are 6,253 property crimes — such as burglary and auto theft — for every 100,000 city residents, far more than the national annual property crime rate of 2,596 incidents per 100,000. Violent crimes, such as assault and murder, are also quite common in St. Louis. There are 1,679 violent crimes a year for every 100,000 city residents, the fifth highest violent crime rate of any city in the country.
Cities with relatively high college attainment rates tend to have higher income levels. Yet this is not the case in St. Louis. While 32.0% of city adults have at least a bachelor’s degree, higher than the 30.1% national college attainment rate, the city’s median household income is far lower than average. The typical St. Louis household earns only $35,959 a year, about $17,700 less than the typical American household. Also, St. Louis’s 28.5% poverty rate is nearly double the 15.5% national poverty rate.
14. Buffalo, New York
> Population: 258,699
> Median home value: $69,900
> Poverty rate: 31.3%
> Pct. with at least a bachelor’s degree: 23.7%
Buffalo is one of several upstate New York cities that have struggled with economic decline for decades. Byproducts of the city’s economy include long-term population decline, as well as depressed home values. The city’s population fell by 4.3% in the past five years. The median home value in the Western New York city is only $69,900, well below half the value of the typical American home, of $181,200. The cost of goods and services in Buffalo is also 14.2% lower than it is on average across the country.
Though the city may be relatively affordable, incomes in Buffalo are well below incomes nationwide. The typical Buffalo household earns only $31,919 a year, far less than the $53,657 national median household income. The city’s 31.3% poverty rate is nearly double the U.S. poverty rate.
[wallst_email_signup]
13. Dayton, Ohio
> Population: 140,995
> Median home value: $66,200
> Poverty rate: 36.9%
> Pct. with at least a bachelor’s degree: 16.3%
Dayton, Ohio, is one of the poorest cities in the country. The typical Dayton household earns only $26,131 a year, less than half the income the typical American household earns. The cost of living in Dayton is 10% less than it is on average across the U.S. But while goods and services are relatively affordable, the city’s 36.9% poverty rate is one of the highest of any U.S. city. Low incomes and high poverty are bad for business, and poor economic conditions may partially explain the city’s declining population. In the last five years, the city’s population declined by 8.3%.
Negative population growth can have a detrimental effect on property values. Perhaps not surprisingly, a typical home in Dayton is worth only $66,200, nearly three times less than a typical American home, which is valued $181,200.
12. Jackson, Mississippi
> Population: 171,146
> Median home value: $90,800
> Poverty rate: 28.2%
> Pct. with at least a bachelor’s degree: 29.1%
City populations with high educational attainment rates tend to also have high incomes, although this is not always the case. Approximately 29% of adults in Jackson have at least a bachelor’s degree, within one percentage point of the national college attainment rate. Yet, the typical area household earns only $34,039 a year, well below the $53,657 national median household income.
On the other hand, the city has an abundance of amenities for leisure activity. There are 333 restaurants and cafes and about 21 fitness and recreation centers in Jackson for every 100,000 city residents, each far more than the corresponding national figures of 238 eateries and 13 fitness centers per 100,000 people.
[nativounit]
11. Westminster, California
> Population: 92,062
> Median home value: $512,900
> Poverty rate: 20.3%
> Pct. with at least a bachelor’s degree: 22.2%
The median household income in Westminster of $54,622 a year is roughly $1,000 more than the median income nationwide. However, the cost of living in the city is almost 30% higher than it is across the country as a whole. For example, housing costs in Westminster are twice as much as they are nationwide. A typical home in the city is worth of half a million dollars, while a typical American home is worth about $181,200. After adjusting for cost of living, the city ranks among the least affordable in the country.
As is the case with many other California cities, the air quality in Westminster is poor. The city has poor air quality for roughly a month out of every year, compared to a national average of poor air quality about 20 days a year. As result, Westminster residents are at greater risk of certain illnesses that can be triggered by hazardous air quality.
10. Gary, Indiana
> Population: 71,180
> Median home value: $70,500
> Poverty rate: 37.6%
> Pct. with at least a bachelor’s degree: 12.5%
Gary’s population is shrinking faster than that of any other U.S. city. The number of people that call Gary home has dropped by 26.7% in the last decade and by 25.5% in the last five years. A declining population is not especially surprising given the city’s bleak economic conditions. The typical household in the city earns only $26,367 a year, less than half of the American median annual household income. In Gary, 37.6% of people live below the poverty line, the 11th highest poverty rate of any U.S. city.
A disproportionately large share of Gary’s workforce likely lacks the education needed for high-skill, higher-paying jobs. Only 12.5% of area adults have at least a bachelor’s degree, less than half of the 30.1% corresponding education attainment rate nationwide.
9. Cleveland, Ohio
> Population: 389,524
> Median home value: $65,900
> Poverty rate: 39.2%
> Pct. with at least a bachelor’s degree: 15.1%
The typical Cleveland household earns only $24,701 a year, the second lowest median household income of any U.S. city. The city’s 39.2% poverty rate is the fifth highest of any U.S. city. Likely as a result of poor economic conditions, the city’s population has declined by 9.7% in the last five years alone. The negative population growth is not doing much to help property values in Cleveland. The median home value in the city of $65,900 is worth less than in all but three other U.S. cities.
As in many cities where residents are suffering economically, crime is a major problem in Cleveland. Violent crimes, a category that includes murder and assault, are roughly 3.7 times more common in Cleveland per capita than they are across the country as a whole.
[nativounit]
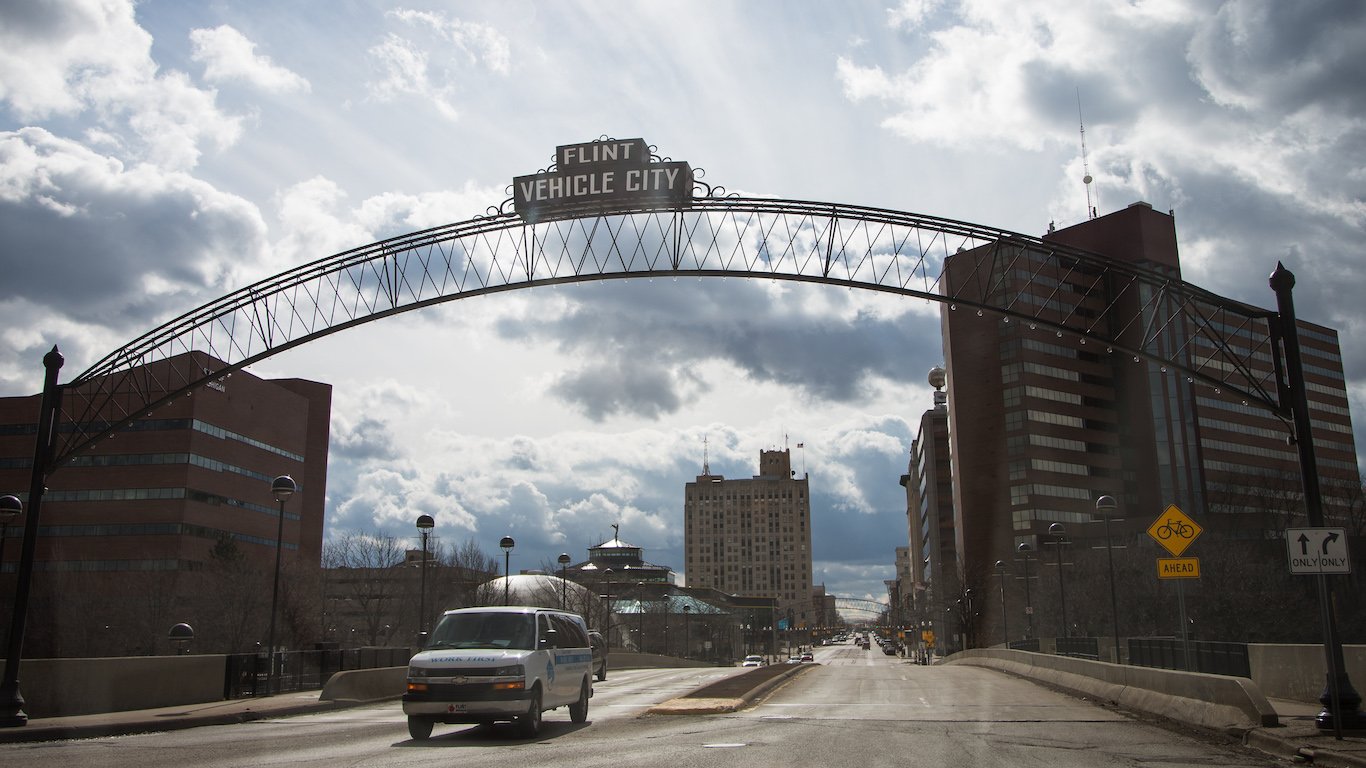
8. Flint, Michigan
> Population: 98,990
> Median home value: $32,300
> Poverty rate: 40.1%
> Pct. with at least a bachelor’s degree: 12.5%
What was once a manufacturing hub for General Motors, Flint’s economy has been decimated since the auto giant reduced its presence in the city. About 40% of Flint residents live in poverty, the second highest poverty rate of any U.S. city. At least partly as a result of widespread destitution, Flint is also a dangerous city. The city’s violent crime rate of 1,708 reported incidents for every 100,000 residents is roughly 4.7 times higher than the nationwide violent crime rate.
The city’s population has declined by 11.6% in the last 10 years — and home values are suffering as a result. The typical home in Flint is worth just $32,300, the lowest of any city in the country, and less than a fifth of the national median. Conditions will likely only worsen in Flint before they get better. Recently, lead was discovered in the Flint’s drinking water, and governor Rick Snyder declared a state of emergency in the city.
7. Memphis, Tennessee
> Population: 656,876
> Median home value: $91,800
> Poverty rate: 29.8%
> Pct. with at least a bachelor’s degree: 24.4%
Often referred to as the birthplace of rock ‘n roll, Memphis is steeped in rich musical history. Considering the city’s economic conditions, however, many of the city’s best years may be in the past. Roughly 30% of area residents live in poverty, nearly double the national poverty rate. As in many U.S. cities with pervasive poverty, violent crime is a major problem in Memphis. There are 1,741 violent crimes in the city for every 100,000 residents, roughly 4.8 times higher than the nationwide violent crime rate.
The city also faces environmental challenges. In a given year, more than 8% of days in a given year are identified as having hazardous air quality, more than the 5.9% of days across the country on average. As a result, Memphis residents are at greater risk of certain respiratory conditions than most Americans.
[recirclink id=339481]
6. Birmingham, Alabama
> Population: 212,653
> Median home value: $84,400
> Poverty rate: 30.5%
> Pct. with at least a bachelor’s degree: 23.9%
Birmingham’s median home value of $84,400 is roughly $100,000 less than the national median home value. Low home values are often indicative of a poor population and a weak economy, and indeed, many area residents are struggling financially. The typical Birmingham household earns only $30,043 a year, and the city’s poverty rate of 30.5% is nearly double the national poverty rate.
Like many cities with pervasive poverty, Birmingham is a relatively dangerous place. The city’s violent crime rate of 1,588 incidents per 100,000 people is more than four times the national violent crime rate.
[cnxvideo id=”655223″ placement=”ros”]
5. Fall River, Massachusetts
> Population: 88,705
> Median home value: $230,600
> Poverty rate: 22.8%
> Pct. with at least a bachelor’s degree: 13.1%
The median household income in fall river is only $35,037, just roughly half the income a typical Massachusetts household earns and about $18,500 less than the income the typical American household earns. Placing further pressure on residents wallets, a single dollar also has less purchasing power in the city as goods and services are roughly 19% more expensive in the city than they are across the country as a whole. In Fall River, 22.8% of people live below the poverty line, a considerably larger share than the 15.5% of impoverished Americans.
As is often the case in cities with a high poverty rate, Fall River also has a violent crime problem. Violent crime is about 3.2 times more common in the city than it is across the country as a whole.
4. Hawthorne, California
> Population: 87,591
> Median home value: $427,700
> Poverty rate: 16.1%
> Pct. with at least a bachelor’s degree: 19.7%
Hawthorne, California, is one of the worst cities to live in the country. Both economically and environmentally, Hawthorne residents are at a disadvantage. Incomes are lower than average in Hawthorne, while a higher than average cost living in the city further weakens residents’ purchasing power. Housing is especially expensive in the city. Hawthorne residents pay roughly 30% more on housing than the typical American. Residents are also at a greater risk of health issues that can arise from poor air quality. The city has hazardous air quality nearly 15% of the year, far more than the nationwide average of 6% of the year with poor air quality.
[nativounit]
3. Paterson, New Jersey
> Population: 146,746
> Median home value: $239,300
> Poverty rate: 30.7%
> Pct. with at least a bachelor’s degree: 10.8%
Paterson is home to the Great Falls of the Passaic, which used to power the mills of the city’s once vibrant textile manufacturing industry. According to the U.S. Department of the Interior, Paterson’s textile industry was so productive in the late 19th and early 20th centuries that the city became known as “Silk City.” Close to 16% of the city’s workforce is employed in the manufacturing sector, still well above the national proportion. Like many American industrial cities, Paterson’s economy is no longer prospering as it once was. More than 30% of the area’s residents live in poverty, nearly double the national poverty rate.
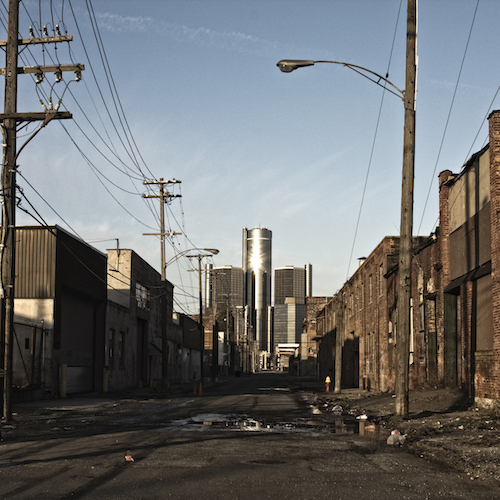
2. Detroit, Michigan
> Population: 680,281
> Median home value: $41,900
> Poverty rate: 39.3%
> Pct. with at least a bachelor’s degree: 13.8%
Unlike most cities on this list, Detroit’s housing market is not expensive. The median value of homes in Detroit is just $41,900, less than a quarter of the national median home value. The incredibly low value housing market is not an especially positive signal, and the economic circumstances of many residents mirrors the poor health of the real estate market. Close to two out of every five city residents live in poverty, roughly two and a half times higher than the national poverty rate.
The long struggling city was hard hit by the recent recession and filed for bankruptcy in 2013. Urban decay has characterized the auto manufacturing hub for decades. The number of manufacturing jobs in Detroit and the surrounding region rose from a decades-long low of 161,500 to 241,000 as of this April, but the industry’s workforce is still well below the roughly 390,000 manufacturing employees it had just 15 years ago.
[wallst_email_signup]
1. Miami, Florida
> Population: 430,341
> Median home value: $245,000
> Poverty rate: 26.2%
> Pct. with at least a bachelor’s degree: 23.6%
No city in the United States is worse to live in than Miami. The city’s median home value of $245,000 is well above the national median of $181,200. However, with a median household income of only $31,917 a year, well below the national median of $53,657, most of these homes are either out of reach or a financial burden on most Miami residents. Like most of the worst cities to live in, more than one in every four people in Miami live in poverty. According to recently released research from the nonprofit think tank the Economic Policy Institute, the top 1% of earners in the Miami metro area make about $2 million annually, 45 times greater than the average income of the other 99% of earners. This earnings gap makes the metro area nearly the most unequal of any U.S. city.
Citywide violence is closely associated with a range of negative social and economic outcomes, including incarceration, unstable employment, lower cognitive functioning among children, and anxiety. A disproportionately large portion of Miami residents likely experience some of these outcomes as the city’s violent crime rate, at 1,060 incidents per 100,000 people, is several times higher than the national rate.
Methodology
To determine America’s 50 worst cities to live in, 24/7 Wall St. considered the roughly 550 cities that the U.S. Census Bureau reported as having populations of more than 65,000 residents in 2015. We considered only the lowest ranking city in each county. Data were collected in nine major categories: crime, demographics, economy, education, environment, health, housing, infrastructure, and leisure.
Within each category, specific measures contributed to a city’s overall category score. For example, the economy category included median household income adjusted for cost of living, the ratio between the city and its state’s median household income, poverty and unemployment rates, as well as the city’s three-year employment growth. Each measure was adjusted to range from 0 to 1 using min-max normalization, with lower scores indicating better outcomes.
The crime category consists of both violent and property crime rates from the Federal Bureau of Investigation’s 2014 Uniform Crime Report.
The economy category includes a city’s 2014 unemployment rate and employment growth from 2013-2015, both from the Bureau of Labor Statistics. Additionally, we considered the poverty rate. Cities were penalized for having poverty rates above the national rate of 15.5%. We adjusted median household income for cost of living in the city. A city was penalized if cost-adjusted income was less than $43,000 or more than $107,000, roughly 80% to 200% of a typical household income nationwide. Poverty rates and median income came from the U.S. Census Bureau’s American Community Survey. Cost of living data came from real estate tracking company Homefacts.
As a proxy for school system strength, we considered high school standardized test scores relative to state scores from Homefacts. Test score data are for 2014 or the most recent available year. Additionally, the education category includes the percentage of adults with at least a bachelor’s degree from the ACS, as well as the number of colleges and universities in a city per 100,000 residents from the Department of Education.
Whereas other measures in this index are specific to an individual city, many metrics in this category describe the county in which the city is located. Using data from Homefacts, we constructed an air quality index, which assessed levels of a number of pollutants on a given day. We also reviewed average summer and winter temperatures in each area. However, rather than penalizing cities for having colder than average winters, we compared each city’s temperature to seasonal averages within its own Census region. We also considered average monthly rainfall from Homefacts.
From the Centers for Medicare and Medicaid Services (CMS), we calculated 30-day risk-adjusted mortality rates of heart attacks, COPD, heart failure, pneumonia, and stroke. Also from CMS, we looked at the rate at which individuals were readmitted to a hospital within 30 days of being discharged. Additionally, we included the health care advocacy nonprofit Leapfrog Group’s hospital grading, which considers a host of measures related to a hospital’s care delivery and patient response surveys. This category also includes preventable hospitalizations — the share of hospitalizations that could have been treated with outpatient or ambulatory care for every 1,000 Medicare recipients from County Health Rankings.
In our housing index, we considered the ratio of a city’s median home value to the statewide median value. Cities were penalized if home values in the city were less than 90% of statewide home values, or at least 25% higher than the state median value. We also included the ratio of median home value to median household income. We also considered median property taxes as a percentage of median home value. All data in this category came from the 2015 ACS.
From the ACS, we considered the percentage of commuters travelling to work by foot or public transportation. Additionally, we reviewed the average time it takes to travel to work each day. Lastly, we included the number of airports in the metro area in which the city is located. There are, for example, no airports in New York County, the primary county in New York City. However, at least three major airports exist outside county limits — and within the metro area — that service people who live in the city. Airport data came from the Federal Aviation Administration and only considers operational public-use and commercial airports as of 2015.
The leisure category can be broken into two parts — activities that take place in the city and outside of it. Within a city, residents may take advantage of restaurants and bars, libraries and archives, theater companies, fitness and recreational sports centers, museums, movie theaters, hotels, or amateur and professional sports teams. We included in this index the number of zoos, nature parks, ski resorts, and golf courses in the county surrounding the city. All data in this category were aggregated to the city level from 2014 Zip Code Business Patterns, a program maintained by the Census and adjusted for the city’s 2015 population.
Contact [email protected] for any questions or corrections.