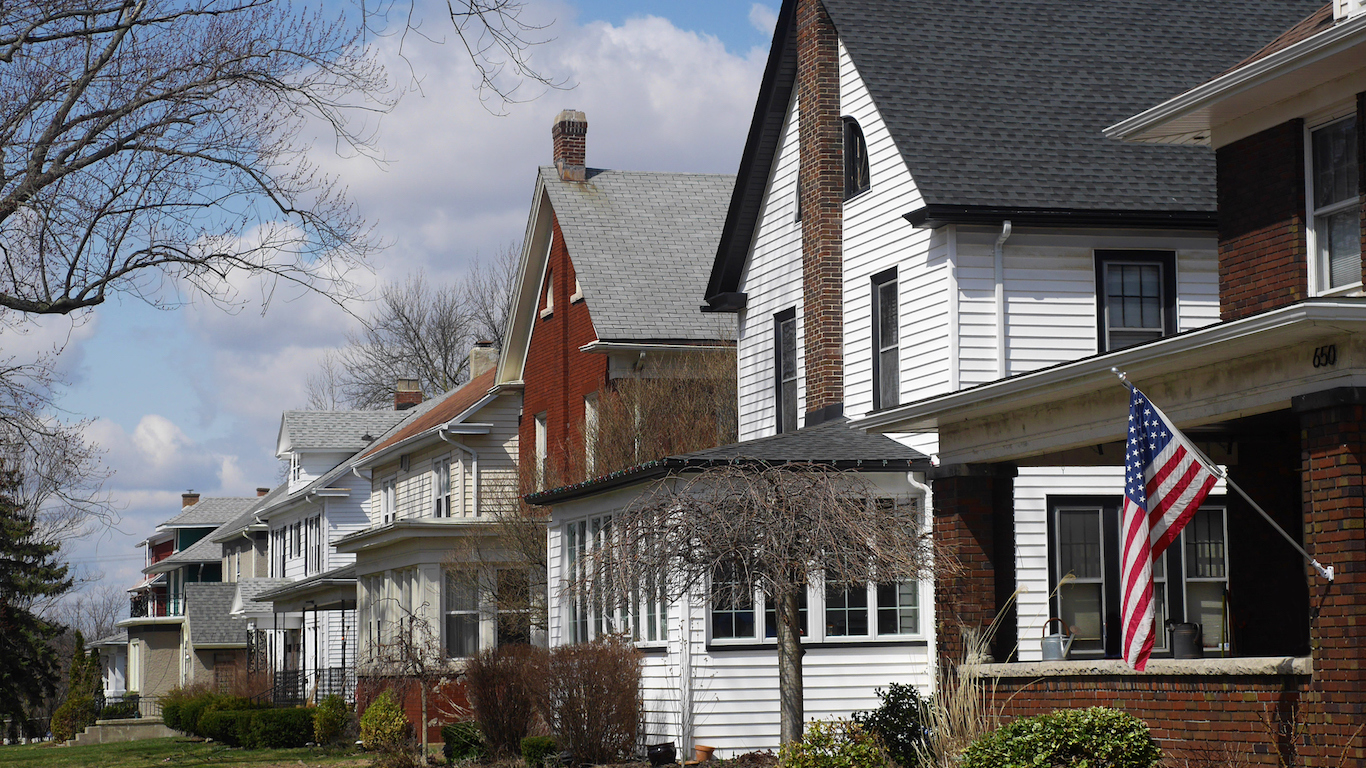
[cnxvideo id=”655419″ placement=”ros”]Home purchases in the United States have rebounded since the the recession that began in late 2007. The residential real estate market is a major pillar of the economy and returning interest in home buying is a healthy sign of economic activity. Over the last decade, however, the homeownership rate has steadily declined — from a peak of 69.0% in 2004, to the current rate of around 62.9%. The last time the U.S. homeownership rate was this low was 1965.
Based on the homeownership rate — the share of housing units that are owner-occupied — 24/7 Wall St. reviewed the 15 metropolitan areas where residents are most likely to own their homes, and the 15 areas where residents are most likely to rent.
[in-text-ad]
The Villages, a retirement community in Florida, leads the nation with a homeownership rate of 89.2%, while College Station-Bryan, a university town in Texas, has the lowest homeownership rate, at just 47.7%.
Click here to see the cities where the most people own their home.
Click here to see the cities where the least people own their home.
The areas with the highest ownership rates tend to have larger shares of older residents, who are generally more likely to have accumulated the capital necessary to purchase a house. All of the 15 metro areas with the highest ownership levels have above-average shares of residents 55 and older, while the opposite is true for areas with the lowest homeownership rates.
Generally, high homeownership rates point to a healthy housing market. However, high homeownership rates in urban areas are also due to the availability of affordable housing. Of the 15 metros with the highest ownership rates, 12 have median home values lower than the national median of $181,200.
Among the 15 metro areas where residents are least likely to own a home, not only are homes relatively expensive, but poverty rates tend to be higher. The median home value in seven of the 15 areas is higher than the national median. The poverty rate in 12 of the 15 areas is higher than the national rate of 15.5%.
Since college students disproportionately rent rather than own their lodgings, the presence of a major college or university also drives down homeownership rates in a number of these areas.
Since the beginning of 2009, housing in the U.S. has become more affordable, and 30-year fixed mortgage rates have remained below historic norms. Yet, home sales are still relatively weak.
According to the National Association of Realtors, 5.3 million previously owned homes sold in the first quarter of this year, up 2% from the previous quarter, and up 5% from a year ago. Home sales are down compared with pre-housing bubble levels, however. Also, the share of homes sold to first-time buyers in the first quarter, at 31%, is down from the historic norm of 40%.
The U.S. Department of Housing and Urban Development attributes the weak sales and the drop in first-time buyers to stricter bank lending standards, low inventories, and declines in the number of distressed properties.
High debt-to-income ratios among young Americans is another major driver of weak home sales. A recent NAR survey found that the number of home buyers age 34 and younger, who are currently the largest group of recent property buyers, would be even higher were it not for the numerous obstacles facing the younger generation. Underemployment, subpar wage growth, rising rents, and student debt repayments have all substantially hindered home buying.
To identify the cities with the highest and lowest homeownership rates, 24/7 Wall St. reviewed the percentage of housing units owned by their occupants in U.S. metropolitan statistical areas from the U.S. Census Bureau’s 2014 American Community Survey. Homeownership rates by age cohort, median home values, the percentage of occupied housing units with a mortgage, median household incomes, poverty rates, and educational attainment rates for the adult population also came from the U.S. Census. Unemployment rates are preliminary as of June 2016 from the Bureau of Labor Statistics. Regional price parity, also known as the cost of living, in each metro area came from the Bureau of Economic Analysis and are as of 2013, the most recent period for which these data are available.
These are the cities with the highest (and lowest) homeownership rates.
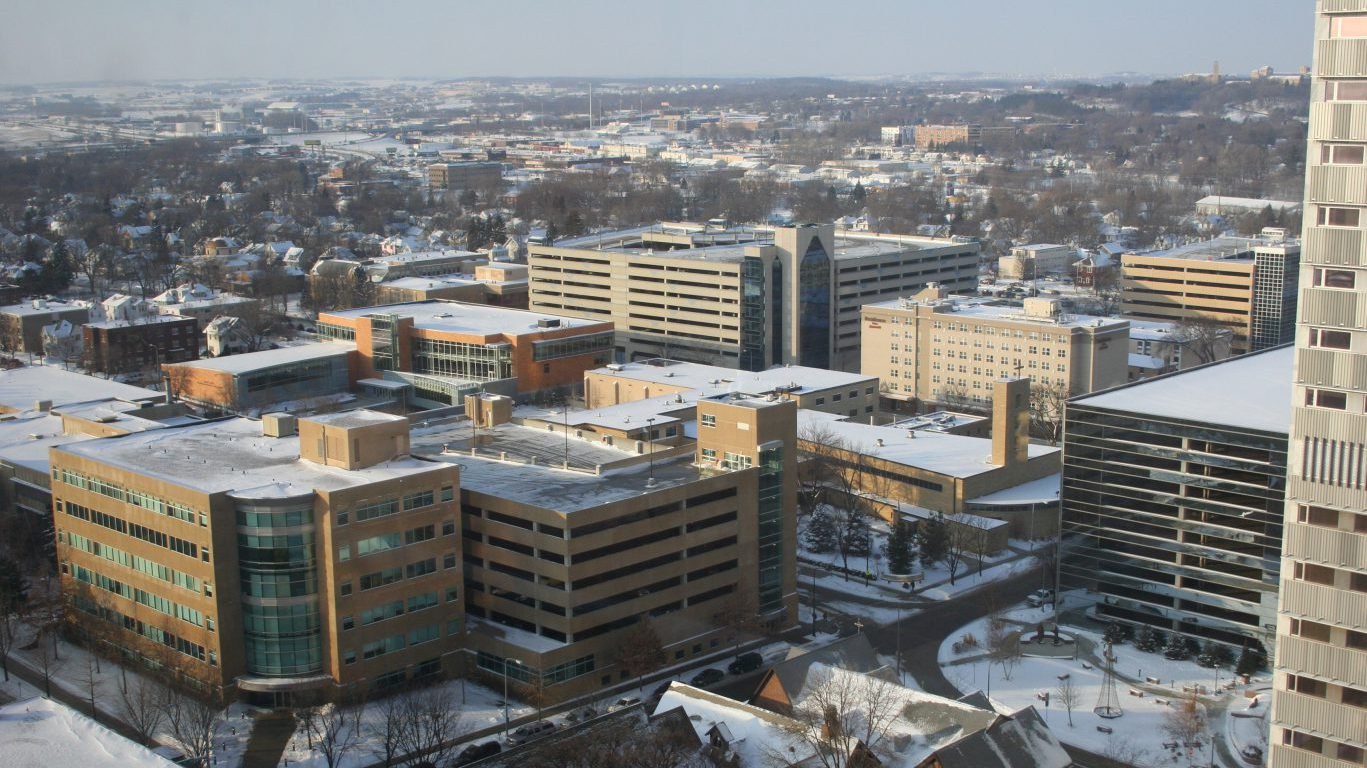
15. Rochester, MN
> Homeownership rate: 75.5%
> Median home value: $170,200
> Median household income: $66,214
The homeownership rate in Rochester is 75.5%, one of the highest of all U.S. metropolitan areas. By contrast, 63.1% of householders nationwide own their homes. Not all cities with high homeownership rates have strong economies, but in Rochester, residents benefit from low unemployment and low poverty. The city’s June unemployment rate of 3.3% and poverty rate of 9.5% are each among the lowest such rates of any metro area.
[in-text-ad]
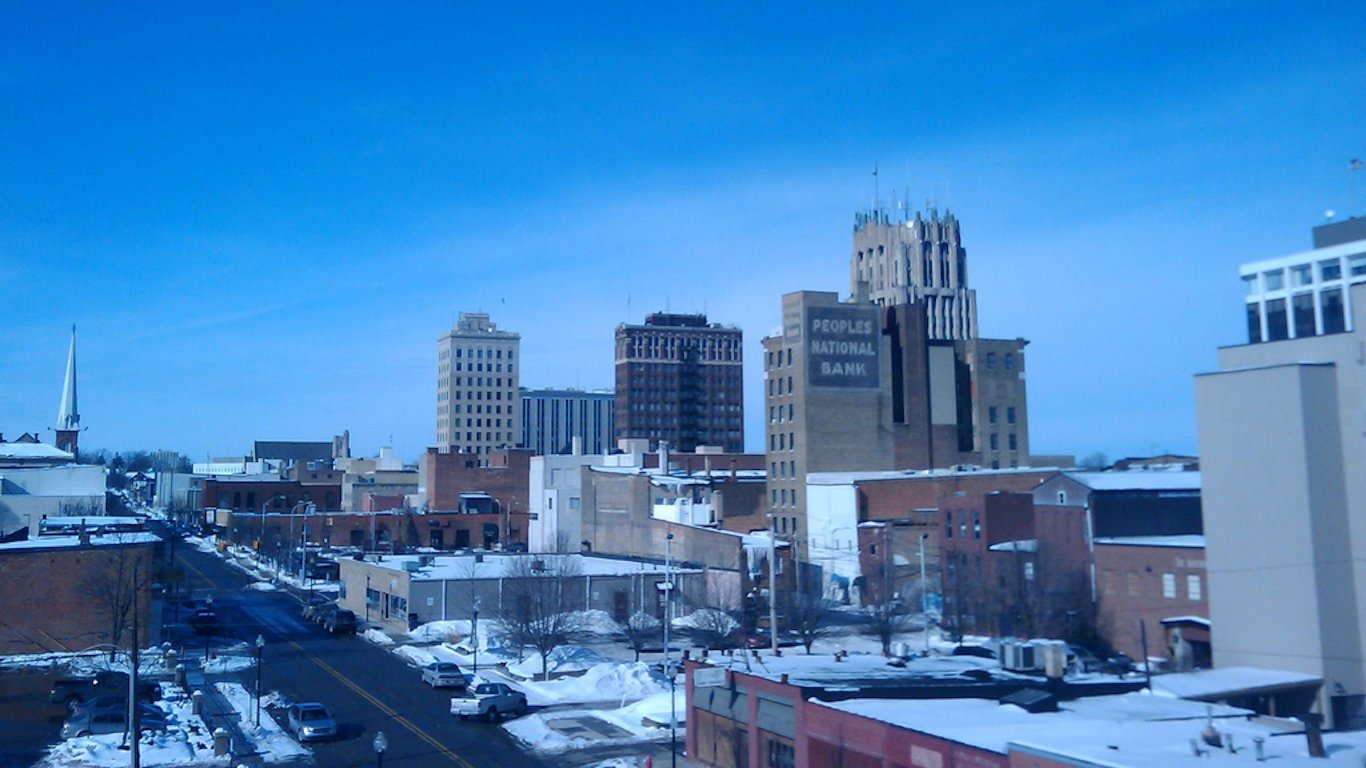
14. Jackson, MI
> Homeownership rate: 75.5%
> Median home value: $109,400
> Median household income: $45,371
After increasing by a near nation-leading 19.5% since 2010, the homeownership rate in Jackson, Michigan is over 75.0%. Across the country, Millennials are a drag on the overall homeownership rate, as an unprecedented share of the generation is not buying homes. In Jackson, however, the problem is far less pronounced. Of area residents aged 15 to 34, 43.3% are homeowners, more than 10 percentage points higher than the 32.0% rate among the same age group nationwide.
[nativounit]
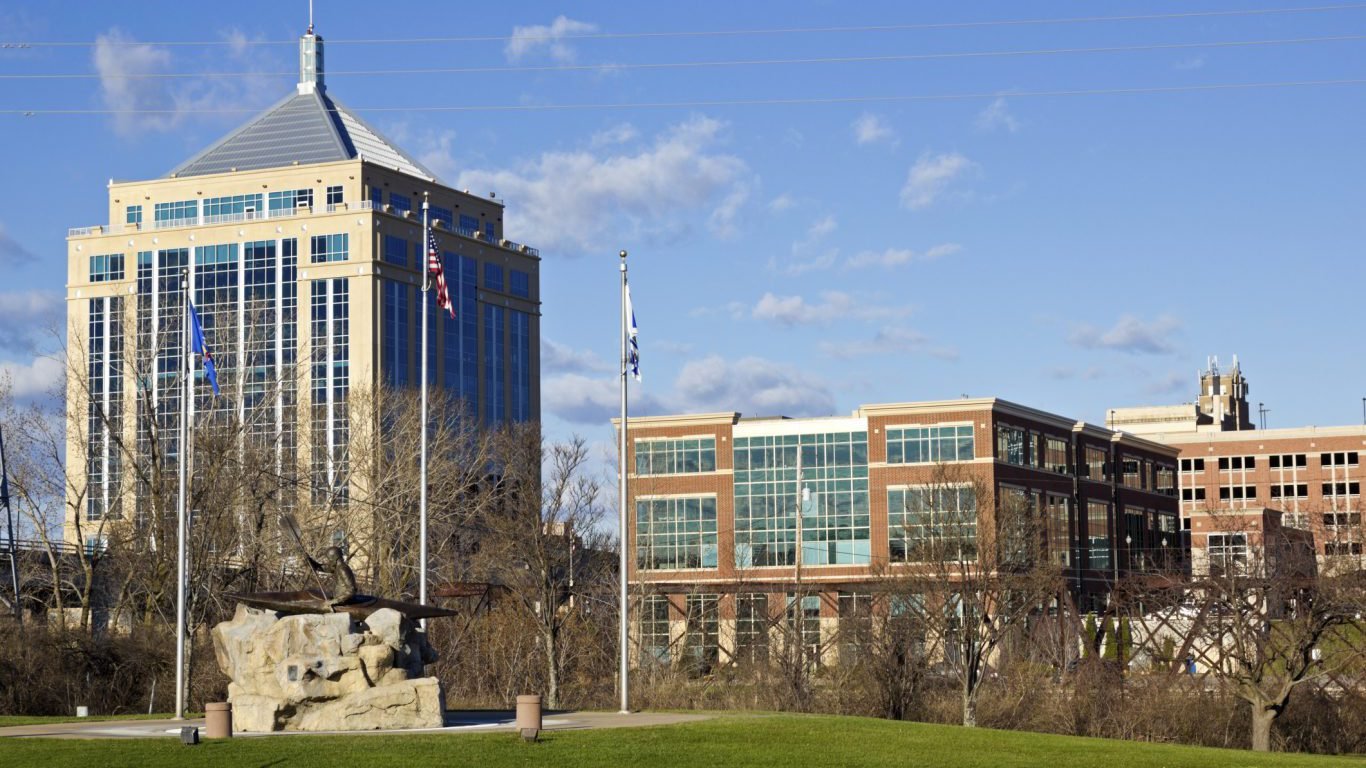
13. Wausau, WI
> Homeownership rate: 75.6%
> Median home value: $145,600
> Median household income: $53,300
A high homeownership rate is often a reflection of economic and financial stability, but it can also mean that area homes are simply more affordable. The median household income of $53,300 in Wausau is roughly in line with national income levels. However, the cost of living, as well as the median home value, are each well below the respective national figures. The area economy also seems relatively healthy, with poverty and unemployment rates of 9.4% and 3.9%, respectively, each among the lowest of all metro areas.

12. Port St. Lucie, FL
> Homeownership rate: 75.6%
> Median home value: $151,800
> Median household income: $47,483
Older Americans are more likely to be homeowners than their younger counterparts. With 38.7% of area residents age 55 or older, Port St. Lucie’s population is one of the oldest of any city in the country. A relatively high 85.7% homeownership rate among the area’s elderly population boosts the city’s overall rate to a near nation-leading 75.6%.
[recirclink id=346420]

11. Ocean City, NJ
> Homeownership rate: 76.0%
> Median home value: $296,800
> Median household income: $56,899
Unlike other metro areas with the nation’s highest homeownership rates, the percentage of owner-occupied housing units in Ocean City has declined in recent years. From 2010, the area’s homeownership rate declined by 2.4 percentage points, in line with the national rate decline. Ocean City’s housing market, however, still appears to be doing quite well. The typical home is worth close to $300,000, one of the highest median home values in the country. Also, the 51.8% ownership rate among younger area residents aged 15 to 34 is unusually high. Nationwide, just 32.0% of that demographic own their homes.

10. Ocala, FL
> Homeownership rate: 76.0%
> Median home value: $101,300
> Median household income: $39,958
The homeownership rate in Ocala, Florida is 76.0%, higher than all but nine other U.S. cities. While a high homeownership rate typically indicates widespread financial security and prosperity, Ocala residents are not especially well off. Median household income in the area is nearly $14,000 below the nationwide median and 17.4% of area residents live below the poverty line, compared to only 15.5% of Americans. Despite some negative economic conditions, the area’s homeownership rate likely remains high because of lower-than-average home values and correspondingly low monthly mortgage payments.
[in-text-ad]

9. Sebring, FL
> Homeownership rate: 76.3%
> Median home value: $80,800
> Median household income: $36,120
Older Americans are more likely to be financially secure and more likely to own their homes than their younger counterparts. In Sebring, residents that are at least 55 years old make up 47.1% of the population, a larger share than in all but three other U.S. metro areas. The homeownership rate of 76.3% in Sebring is due largely to the age of the population. Homeowners in the area are also among the least likely in the country to have a mortgage on their home. Only 44.0% of homeowners finance with a mortgage, considerably less than the 63.8% national figure.
[nativounit]
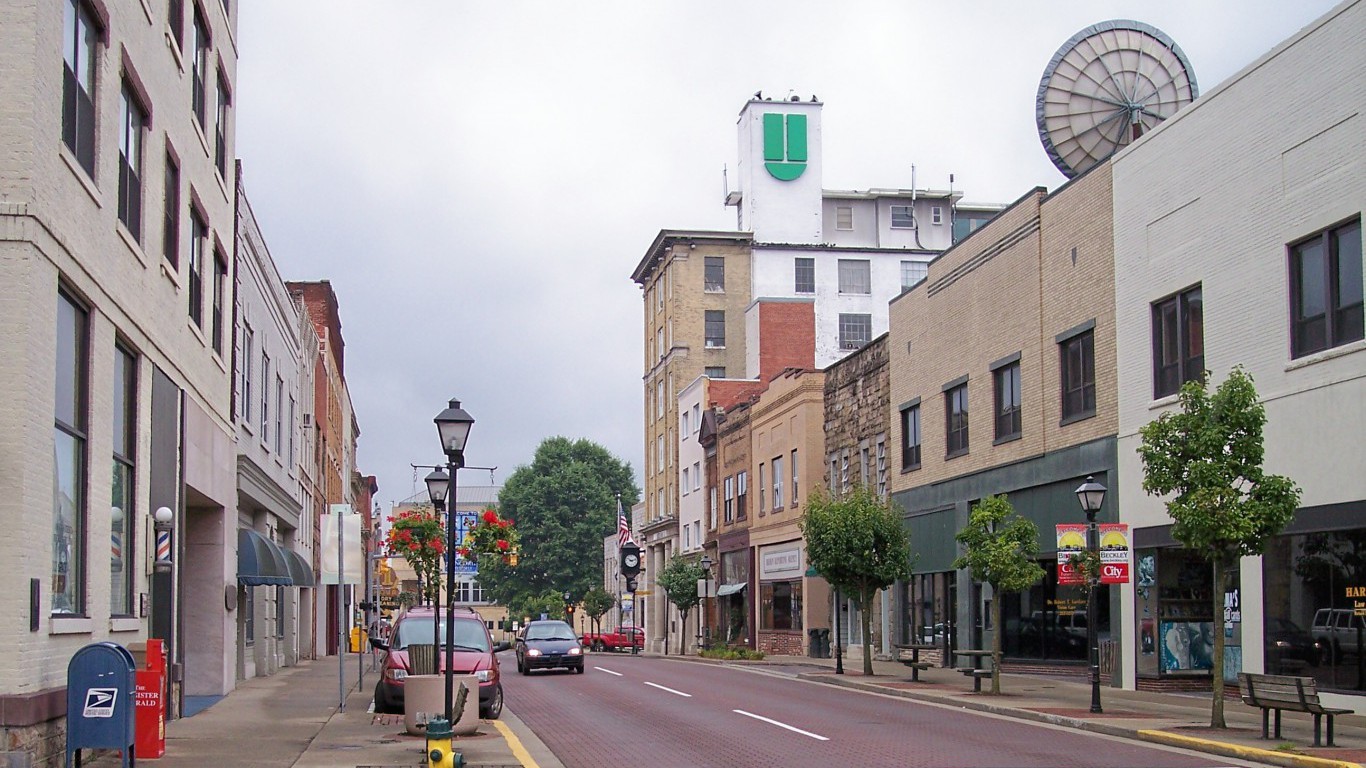
8. Beckley, WV
> Homeownership rate: 76.6%
> Median home value: $93,600
> Median household income: $39,498
Beckley is an area characterized by low incomes and a low cost of living. For the 47.9% of homeowners in Beckley who finance with a mortgage, monthly housing payments are also among the lowest of any city in the country. The typical mortgage holder pays only $859 a month in Beckley, considerably less than the $1,454 the typical American pays each month. With low ownership costs, homeownership rates in Beckley are among the highest in the country.
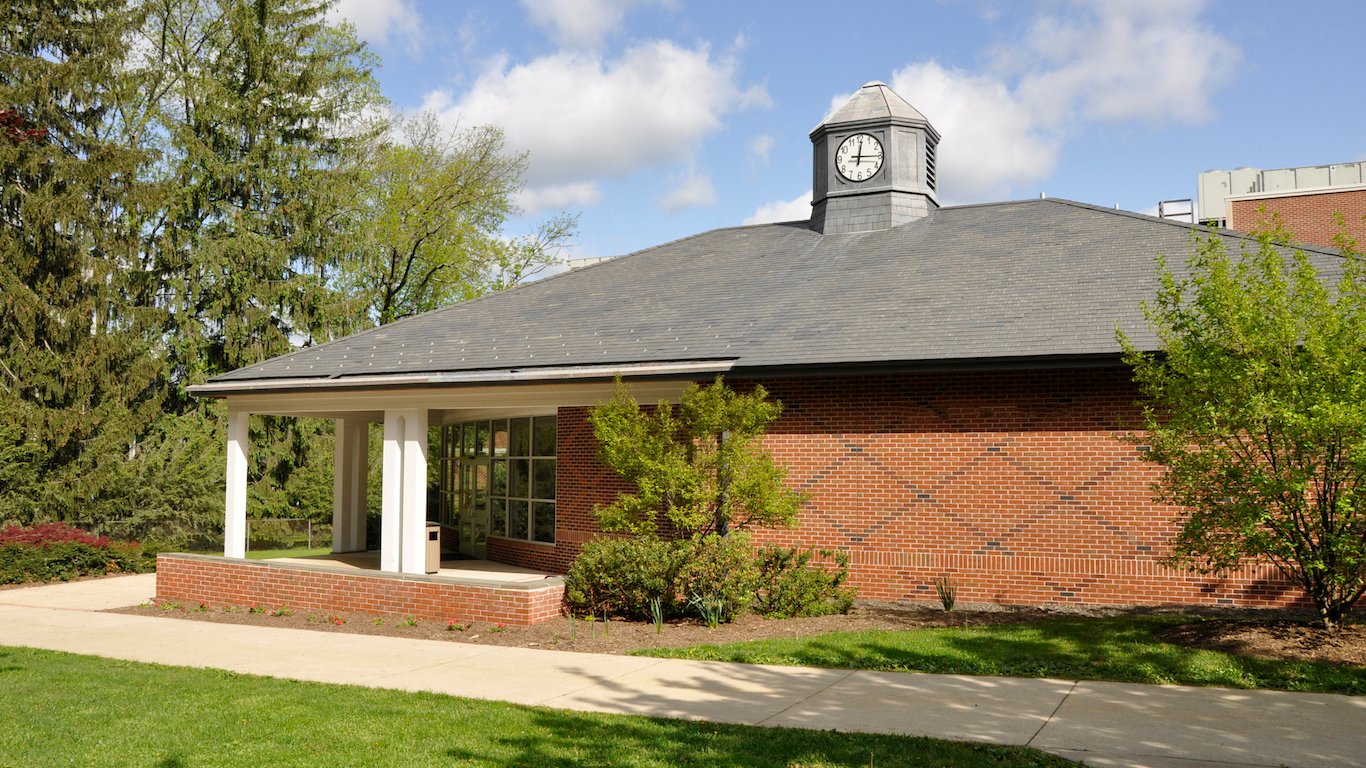
7. East Stroudsburg, PA
> Homeownership rate: 78.0%
> Median home value: $167,800
> Median household income: $63,118
Unlike the vast majority of metropolitan areas — and the nation as a whole — more than half of 15 to 34 year old heads of household in East Stroudsburg own their homes. This is unusual at the national level because accumulating the capital needed to purchase a house typically requires many years. The relative affordability of housing in the area likely explains the high ownership rate. The median household income in East Stroudsburg, $63,118, is well above the national median, while the median home value of $167,800 is lower than the typical home value nationwide.
[wallst_email_signup]
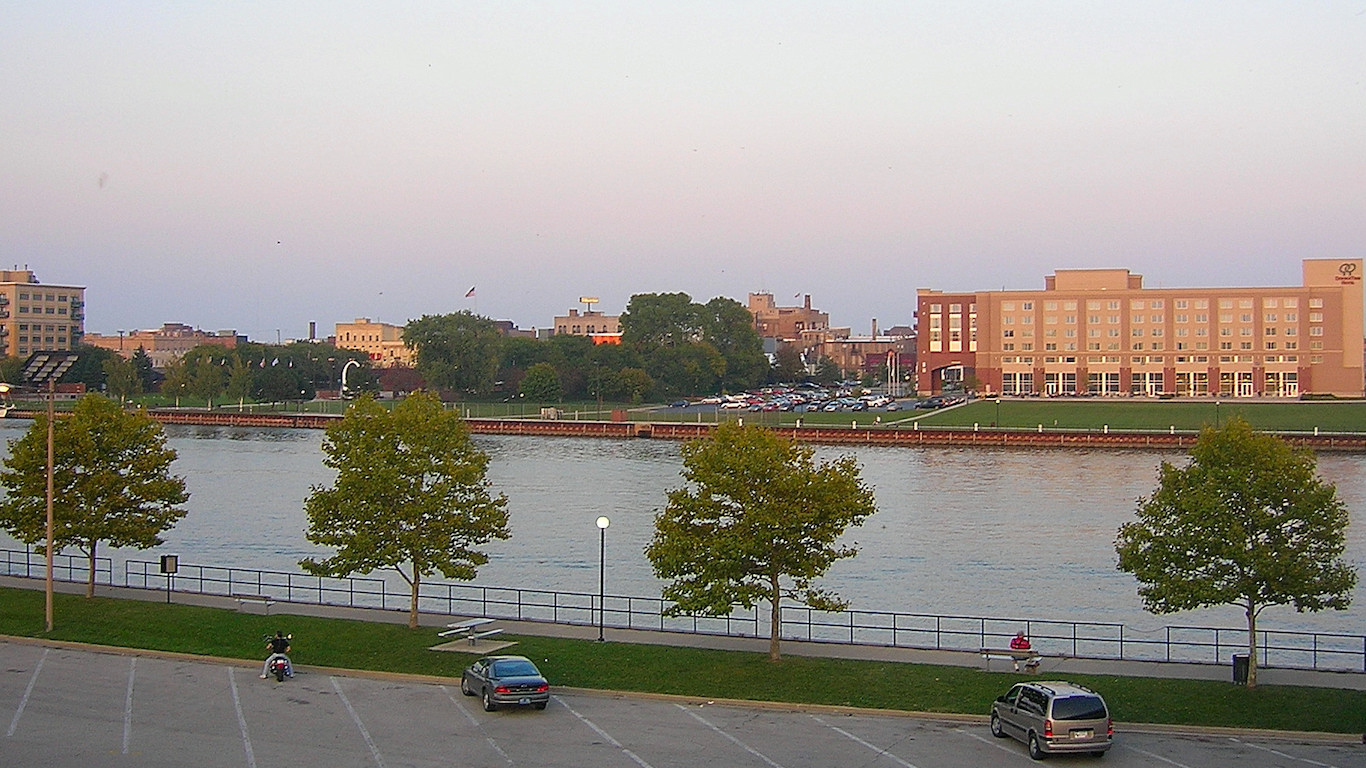
6. Bay City, MI
> Homeownership rate: 78.5%
> Median home value: $104,600
> Median household income: $46,844
The homeownership rate in Bay City is up 6.3 percentage points from 2010 to 78.5%. Meanwhile, homeownership declined nationwide. As in most areas where owning a home is relatively common, Bay City’s population is not especially young. Just 23.9% of residents are between 15 and 34 years old, one of the lower percentages of all metro areas. Yet, of householders in that age cohort, 58.7% own their homes, the second highest such ownership rate in the nation.
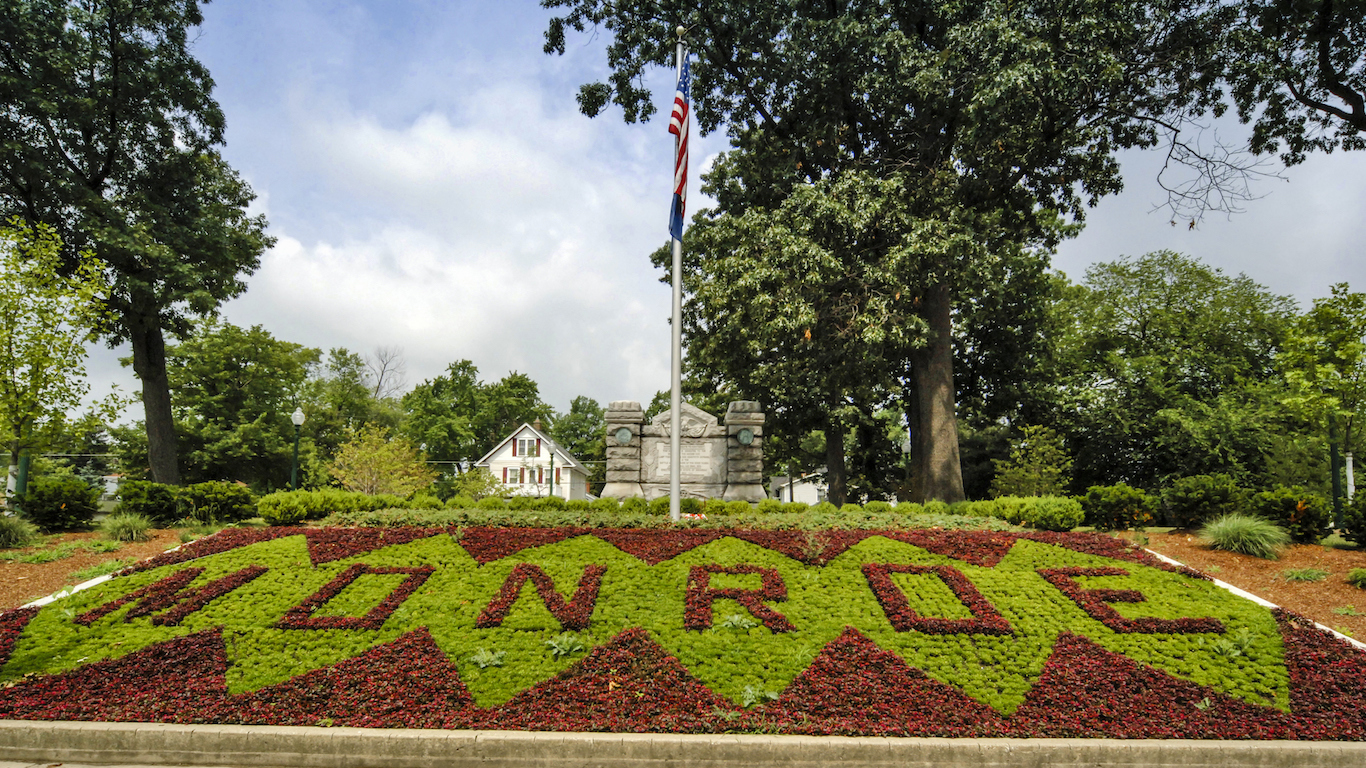
5. Monroe, MI
> Homeownership rate: 78.8%
> Median home value: $140,500
> Median household income: $57,275
Monroe residents are considerably more likely than most Americans to own their homes. With a homeownership rate of just 32.0%, householders aged 15 to 34 across the nation are far more likely than not to rent their homes. In Monroe, by contrast, 60.1% of young householders own their homes, the highest such rate of all metro areas. The 76.1% homeownership rate among householders aged 35 to 55, and the 85.9% rate among among older residents, are also each well above the respective national percentages.
[in-text-ad]

4. Punta Gorda, FL
> Homeownership rate: 79.2%
> Median home value: $146,300
> Median household income: $43,039
As is the case in a number of other metropolitan areas where owning a home is especially common, residents of Punta Gorda tend to be older than in most urban centers. Well over half of area residents are 55 or older, the second highest percentage of any U.S. metro area, and in stark contrast to the national percentage of 27.0%. Since older individuals tend to have greater financial stability, the area’s high homeownership rate is likely largely due to the number of older residents. In Punta Gorda, 86.7% of householders 55 and over own their homes, versus the 76.8% national homeownership rate for that age group.
[recirclink id=345553]
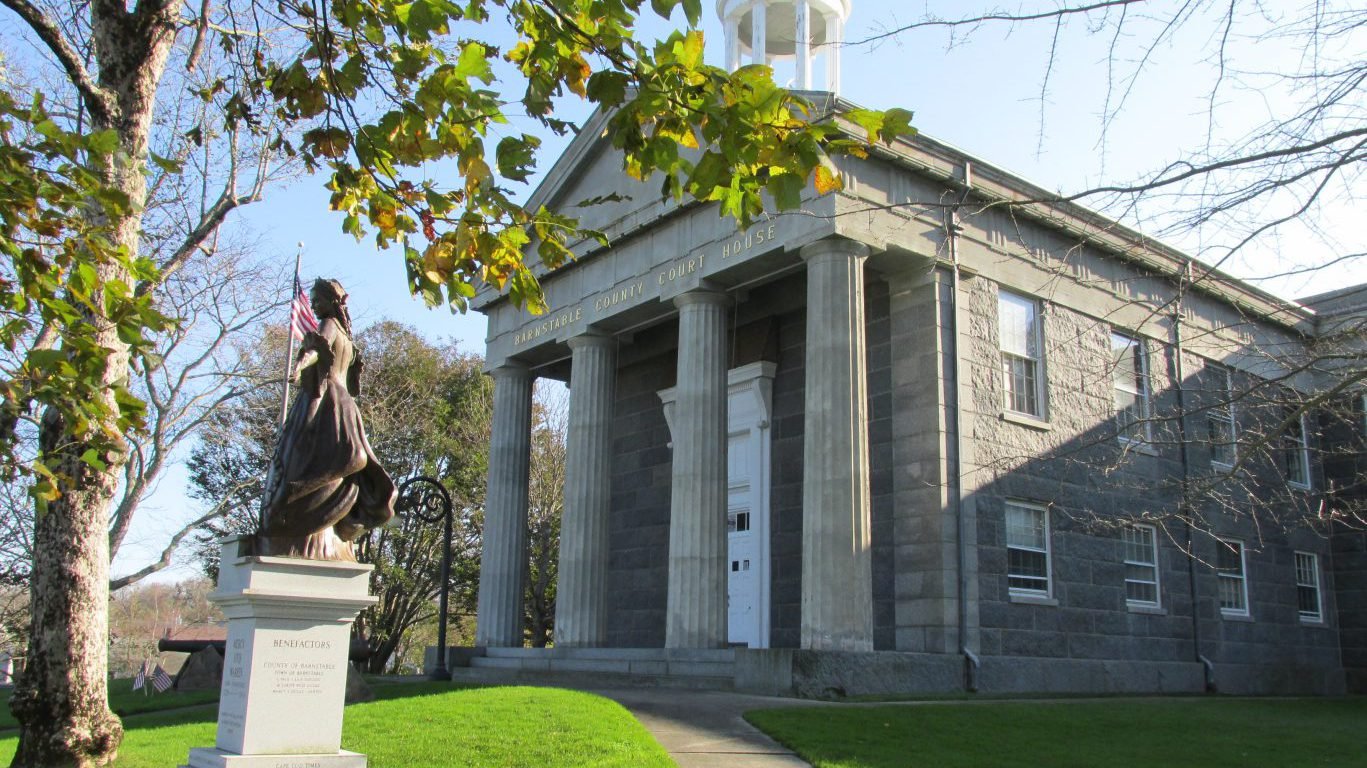
3. Barnstable Town, MA
> Homeownership rate: 79.4%
> Median home value: $359,700
> Median household income: $65,384
The 79.4% homeownership rate in the Barnstable Town metropolitan area, which encompasses the entirety of Cape Cod, is the third highest in the nation. The 63.7% share of homeowners who have a mortgage in the area is almost exactly in line with the national figure, but the amount they pay each month is considerably higher as the typical area home is worth roughly double the typical American home. Higher incomes in the area likely explain why steep housing costs have not reduced the homeownership rate. Median household income in the area is $65,384, nearly $12,000 more than the typical American household earns annually.

2. Homosassa Springs, FL
> Homeownership rate: 79.8%
> Median home value: $116,300
> Median household income: $35,671
As is the case with many Florida cities with high ownership rates, Homosassa is home to a relatively large elderly population. It is one of only three U.S. cities where over half its population aged 55 or more. The area’s elderly residents are the primary reason the Homosassa homeownership rate is the second highest in the country. Only 29.0% of area residents in the 15 to 34 age group own their homes, slightly less than the 32.0% nationwide figure. Meanwhile, 87.8% of those 55 and older own their homes, a far greater share than the 76.8% national share.
[nativounit]
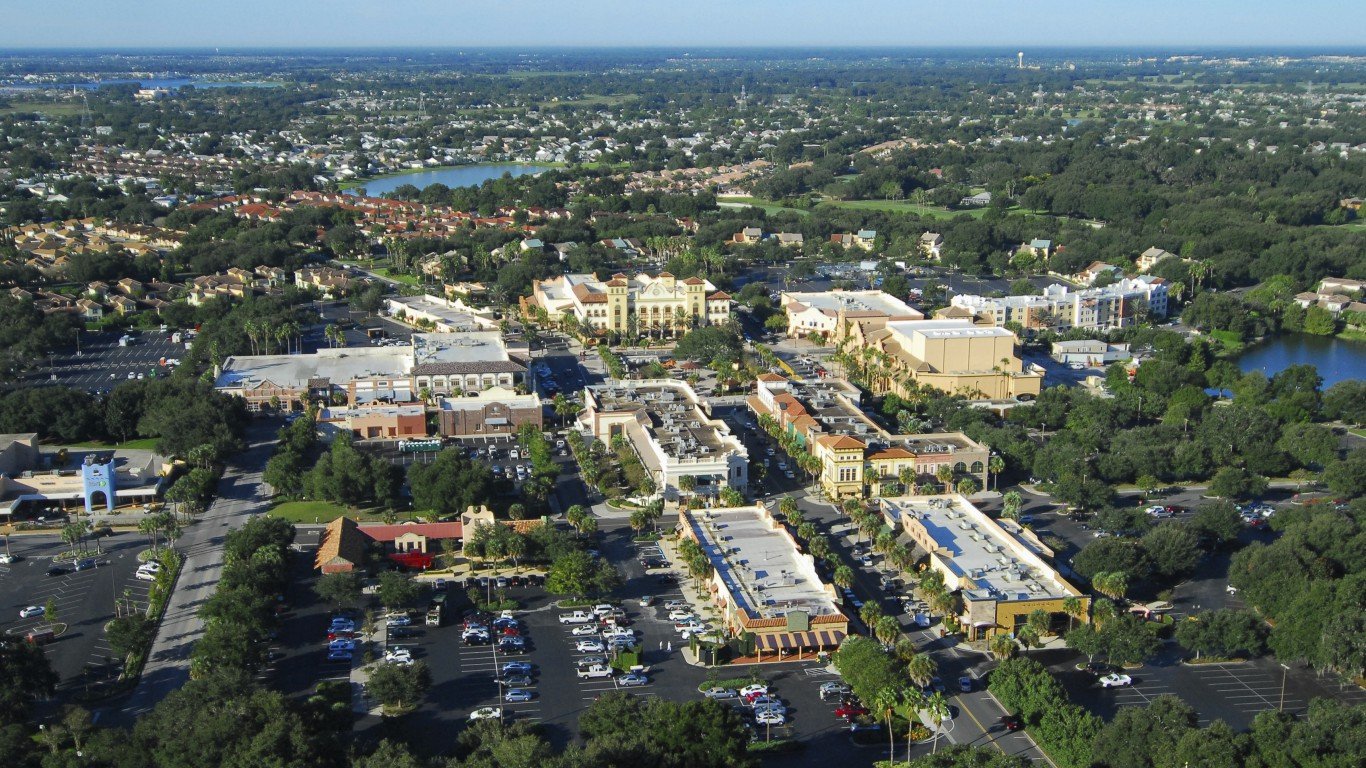
1. The Villages, FL
> Homeownership rate: 89.2%
> Median home value: $224,200
> Median household income: $50,942
The Villages is a high-end retirement community in central Florida. No metro area has a higher percentage of residents 55 and older, and in no metro area are older householders more likely to own their homes. Close to 70.0% of the population is 55 and over. Of householders in this age cohort, 93.2% own their homes. Both percentages are considerably higher than the corresponding national figures of 27.1% and 76.8%. For these reasons, The Villages leads the nation with an overall homeownership rate of 89.2%.
The Cities with the Lowest Homeownership Rates

15. San Diego-Carlsbad, CA
> Homeownership rate: 52.2%
> Median home value: $457,300
> Median household income: $66,192
Barely half of families and individuals residing in San Diego own the home in which they live. Across the country, the homeownership rate is 63.1%. As is the case with nearly every expensive home market, homeownership is extremely low in the San Diego-Carlsbad metropolitan area. The typical area home costs $457,300. Homeownership may be in fewer San Diego residents’ budgets due to the area’s high overall cost of living. The total cost of goods and services, which includes housing prices, is 11th highest of any metropolitan area.
[in-text-ad]
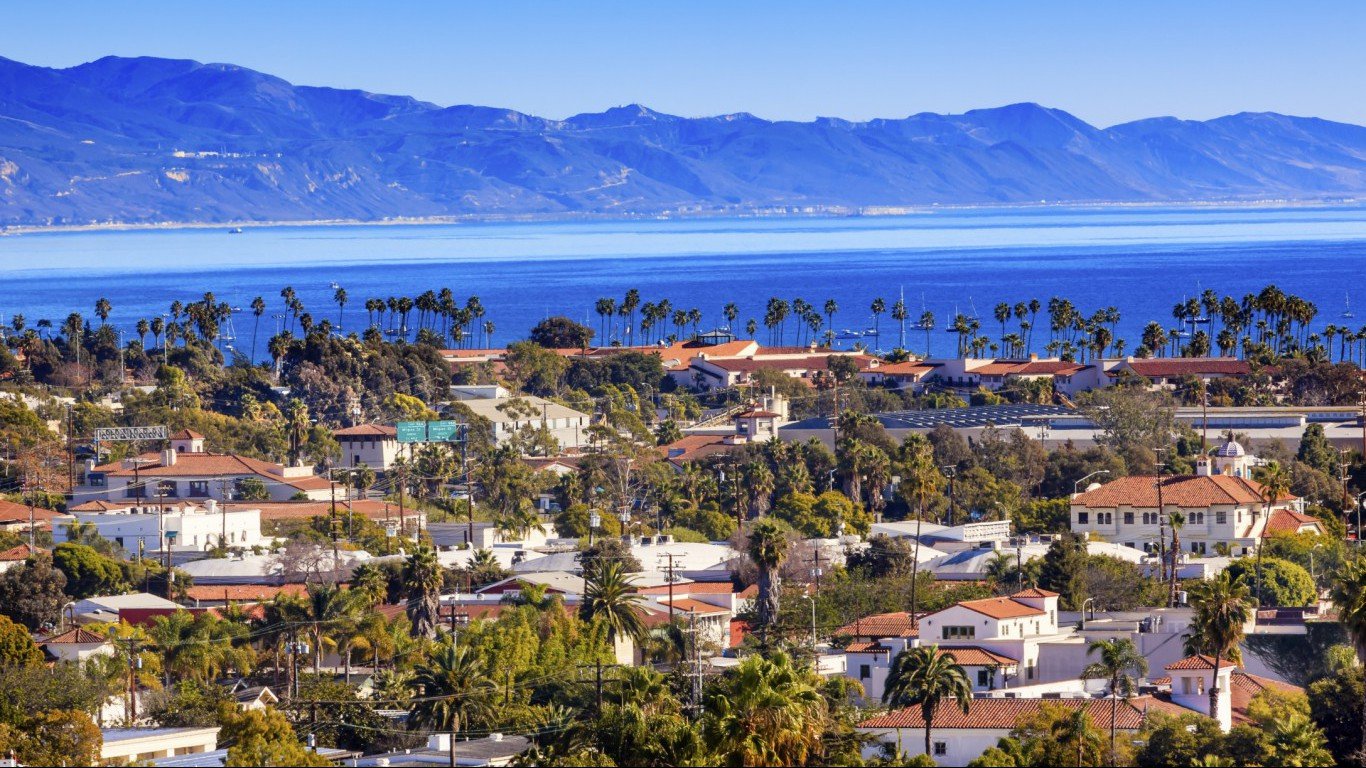
14. Santa Maria-Santa Barbara, CA
> Homeownership rate: 52.2%
> Median home value: $476,400
> Median household income: $63,833
A high cost of living is likely a major factor in Santa Maria-Santa Barbara’s low homeownership rate. Goods and services are 8.8% more expensive in the area than they are on average across the country. Rental costs are especially high. The typical renter in the Santa Maria-Santa Barbara area pays roughly $1,400 a month, far more than the $934 national median rent. A high cost of living and high rents prevent many, especially those just beginning their adult lives, from saving enough for a downpayment on a home — and homes are especially expensive in Santa Maria-Santa Barbara. The area’s median home value of $476,400 is the ninth highest in the country.
[wallst_email_signup]
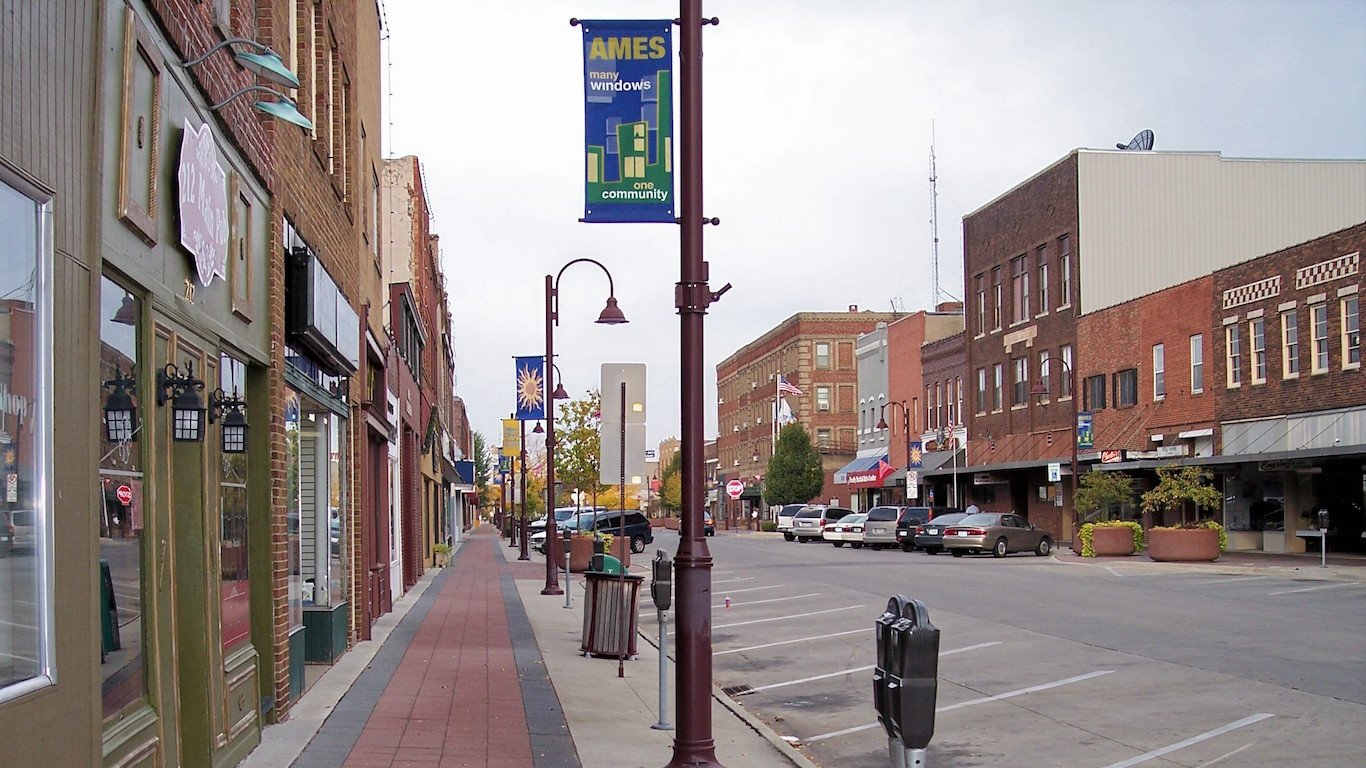
13. Ames, IA
> Homeownership rate: 51.8%
> Median home value: $167,000
> Median household income: $46,091
Ames has one of the youngest populations in the country. While 27.3% of the nation’s population are 15 to 34 years old, 46.6% of the metropolitan area’s residents are, the second highest percentage in the country. The metro area is home to the 36,000-student Iowa State University, and more than 30% of the area’s residents attend a postsecondary institution. Younger people in general, and certainly college and university students, are far less likely to own a home than the typical adult, which may explain why barely half of Ames’ householders own the property in which they live.
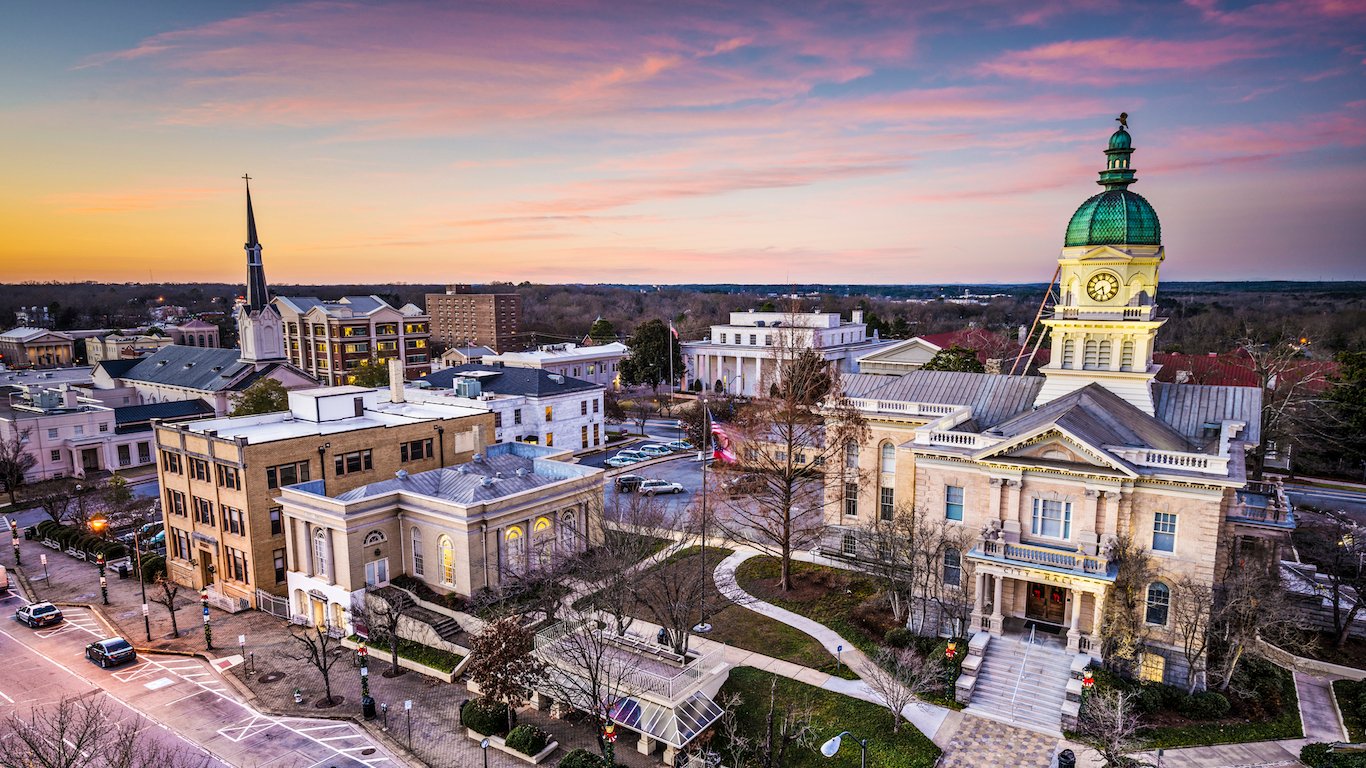
12. Athens-Clarke County, GA
> Homeownership rate: 51.4%
> Median home value: $153,200
> Median household income: $41,761
A typical Athens home is worth $153,200, $28,000 less than the median home value nationwide. Despite relatively low property costs, the area’s homeownership rate of 51.4% is among the lowest in the country. The low homeownership rate is partially attributable to a large young population, the least likely demographic to own a home. The University of Georgia, one of the largest schools in the country, is located in Athens. It is not surprising, then, that 37.2% of the area’s population is between the ages of 15 and 34. In comparison, only 27.3% of Americans fall into this age group.
[nativounit]
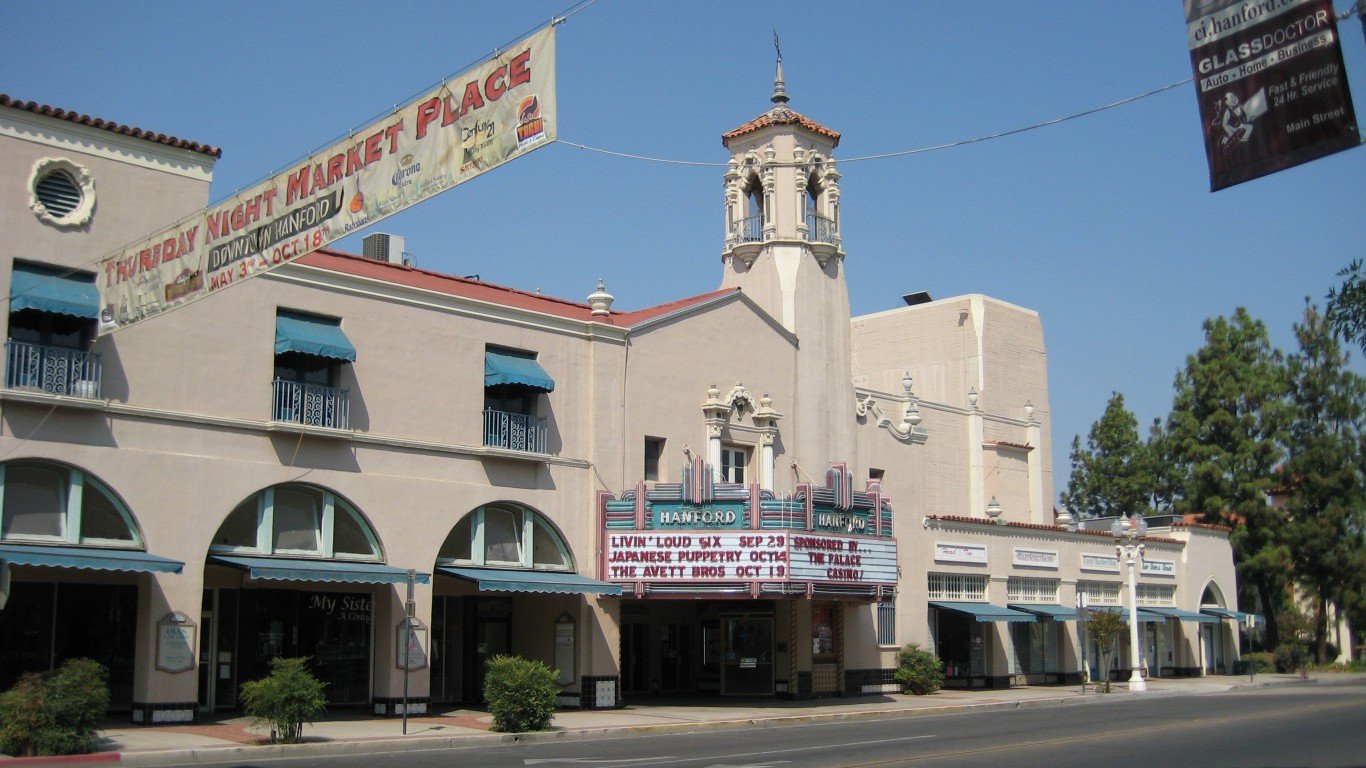
11. Hanford-Corcoran, CA
> Homeownership rate: 51.4%
> Median home value: $169,200
> Median household income: $42,784
Though the typical home value of $169,200 in Hanford-Corcoran is less than the corresponding national median, home prices may still be too high for its many poor and low-income residents. The 10.2% unemployment rate in Hanford is more than double the national rate, and the sixth highest of any metropolitan area. While 15.5% of the nation’s population lives in poverty, Hanford-Corcoran has a 26.6% poverty rate, the ninth highest in the United States. Furthermore, the typical median household income of $42,784 is more than $10,000 below the national median. As a result, even when accounting for the low home prices, the median home value is nearly four times the median household income, compared to 3.4 times nationwide.
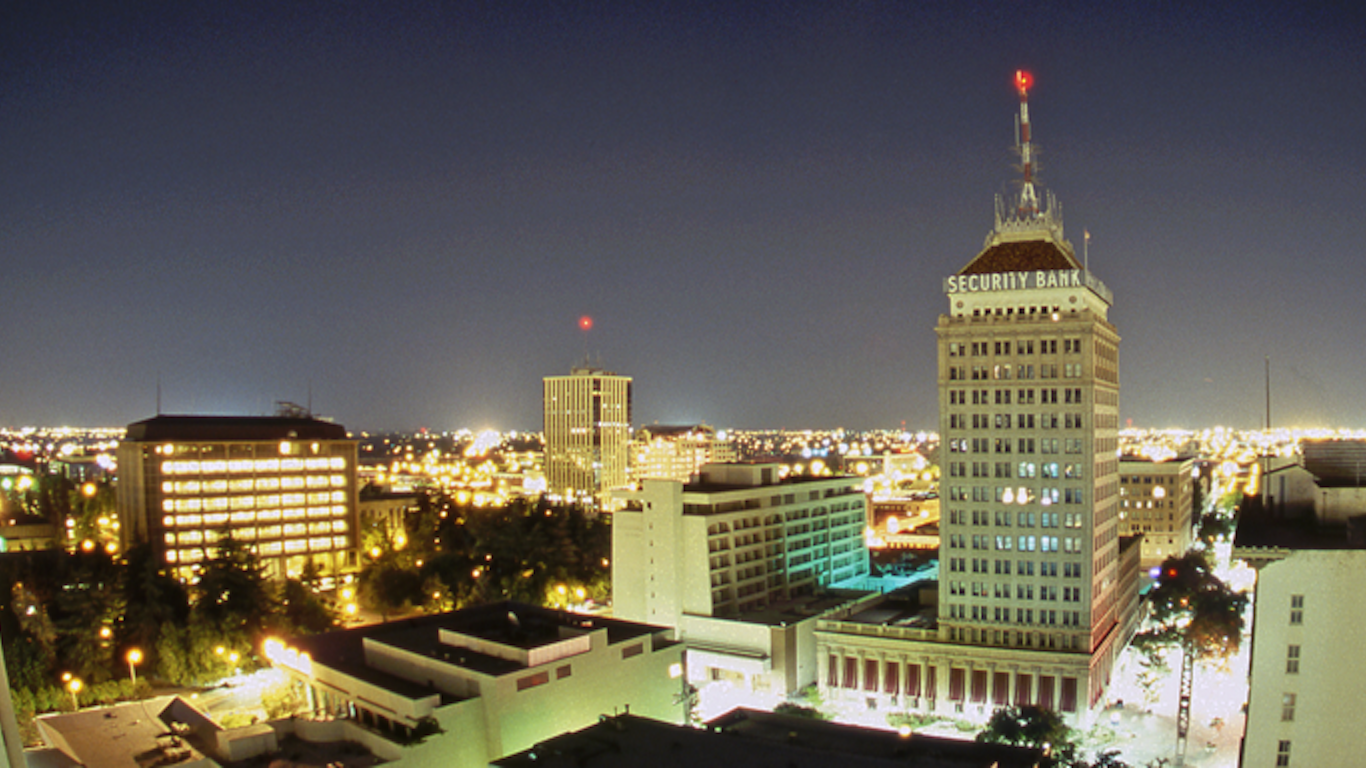
10. Fresno, CA
> Homeownership rate: 51.2%
> Median home value: $204,700
> Median household income: $43,423
Homeownership is prohibitively expensive for many Fresno residents. Median household income in the city is only $43,423, roughly $10,000 less than the national median. At the same time, property values are considerably higher than in much of the country. A typical Fresno home is worth $23,500 more than the $181,200 national median home value. The discrepancy between income and home values also likely explains the high share of area homeowners who finance with a mortgage. Of all homeowners in Fresno, 70.1% have a mortgage, a far greater share than the 63.8% of American homeowners.
[in-text-ad]

9. Salinas, CA
> Homeownership rate: 50.9%
> Median home value: $391,200
> Median household income: $57,864
Like other California cities with low homeownership rates, many Salinas residents are likely priced out of the housing market. While the incomes in the area tend to be slightly higher than they are across the country, higher pay is not enough to offset higher housing costs. A typical area home is worth $391,200, more than double the $181,200 national median home value. In Salinas, the typical mortgage holder pays $1,980 a month, over $500 more than the median mortgage payment across the country. The wide gap between incomes and property values has contributed to a 50.9% homeownership rate, one of the lowest of any U.S. metropolitan area.
[nativounit]

8. New York-Newark-Jersey City, NY-NJ-PA
> Homeownership rate: 50.7%
> Median home value: $396,700
> Median household income: $67,066
The New York metropolitan area can be characterized lately by rapidly rising home prices and rents, and low-income residents who are getting pushed farther and farther away from the city center as a result. The homeownership rate has declined by 13.4% in the past five years, compared to a national decline of 2.3%, and barely half of New York families and individuals own their homes. The typical home value of just under $396,000 is the 14th highest of any metropolitan area.
Not only are home prices high, but rent is exceedingly expensive in the city, which can prevent people from saving up money to eventually purchase a property. The median monthly rent for the metropolitan area is $1,281, the 14th highest in the country and nearly $350 higher than the national median.
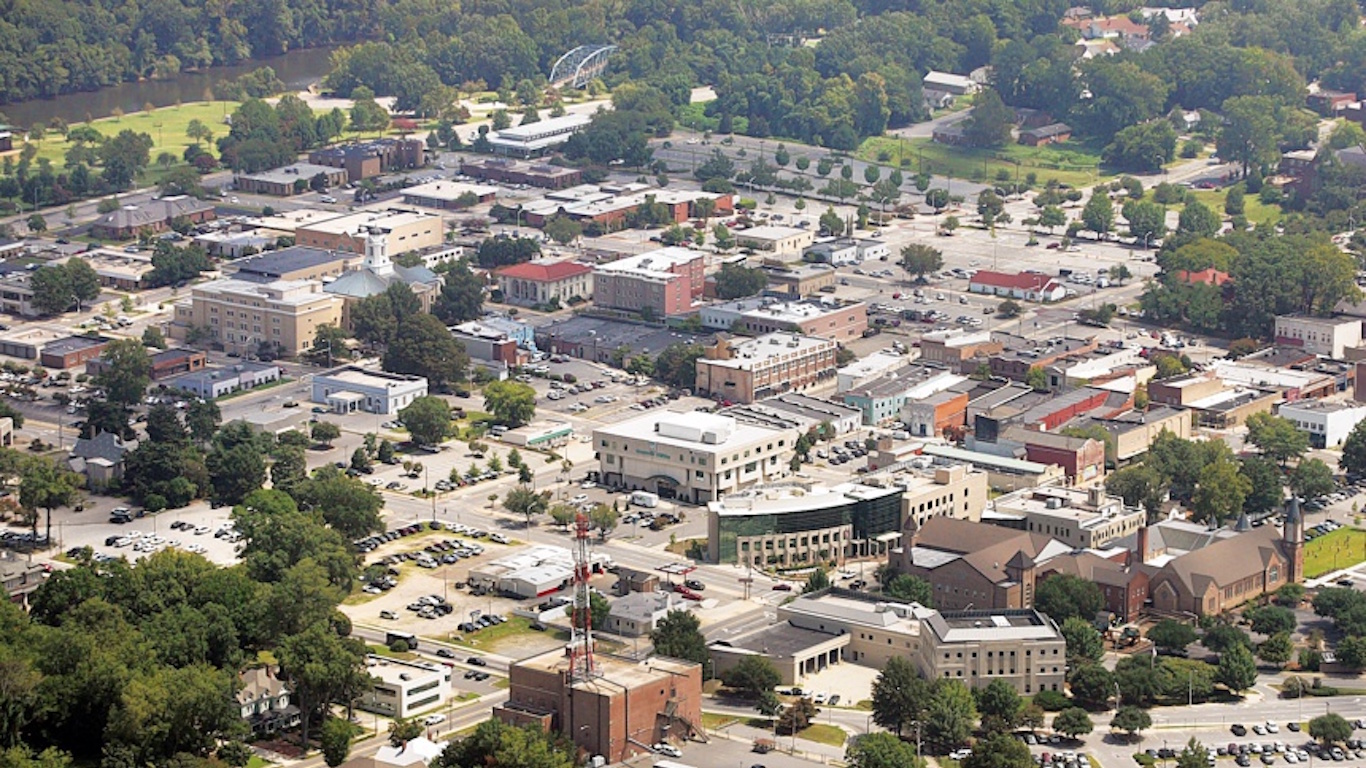
7. Greenville, NC
> Homeownership rate: 50.5%
> Median home value: $126,400
> Median household income: $41,632
Greenville is home to a number of colleges and universities, and nearly one in five metropolitan residents is currently working towards a postsecondary degree. College students are far more likely to rent than the typical adult, which may explain Greenville’s relatively low 50.5% homeownership rate. The area has also seen a significant 14.6% decline in homeownership over the past five years.
[recirclink id=346040]

6. Las Vegas-Henderson-Paradise, NV
> Homeownership rate: 50.3%
> Median home value: $188,700
> Median household income: $51,214
Las Vegas was among the areas hit hardest by the housing crisis. The housing market crash led to mass foreclosures and a surge in the city’s rental market. Between 2010 and 2014, when many in the area could no longer afford monthly mortgage payments, the homeownership rate plunged by 12.6%. Though it has been nearly a decade since the crisis hit, problems persist in the area. At just over 50%, homeownership in the metro area is among the lowest in the country. Many homeowners in Las Vegas are in dire financial straits, as one in four owe more on their home than their property is worth.
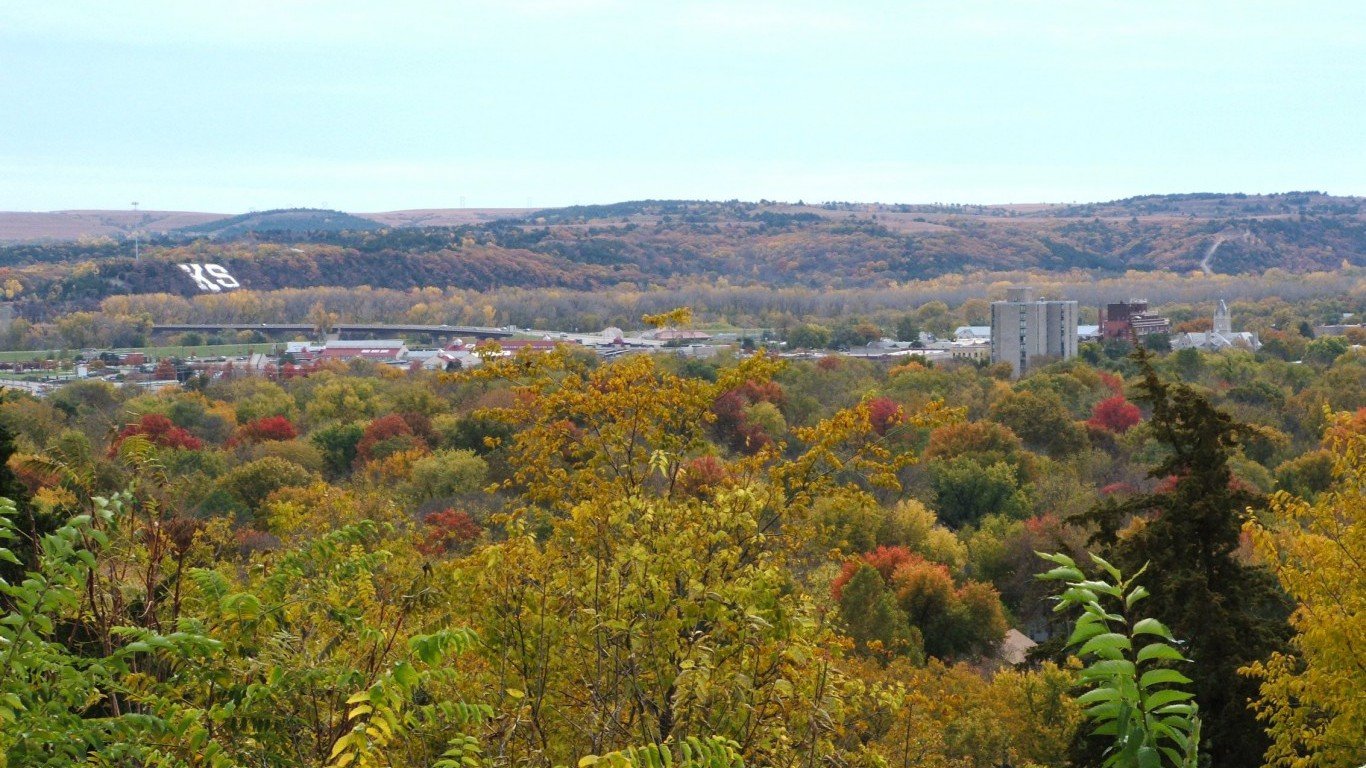
5. Manhattan, KS
> Homeownership rate: 50.3%
> Median home value: $177,200
> Median household income: $50,323
Younger people are less likely to be homeowners than their older counterparts. In Manhattan, Kansas, 46.9% of the population is between the ages of 15 and 34, the largest such share of any city in the country. The substantial number of young people, and the resultant lower homeownership rate, is attributable to the area’s large student population. Kansas State University enrolls nearly 25,000 students in the Manhattan area.
While overall homeownership in Manhattan is well below the national rate, homeownership among the area’s older residents is actually more common than in most of the country. The homeownership rate of those 55 and older is 82.0%, far higher than the corresponding 76.8% national rate.
[in-text-ad]

4. Merced, CA
> Homeownership rate: 49.8%
> Median home value: $173,000
> Median household income: $44,084
Of the 381 U.S. metropolitan areas, Merced is one of only four urban centers where fewer than half of householders own their homes. Trailing just three other cities, the homeownership rate of 49.8% is close to the lowest in the country. Merced is also one of seven metro areas in California to make this list. California was among the states hit hardest by the housing crisis, and Merced is one of many areas in the state still struggling to recover.
[nativounit]
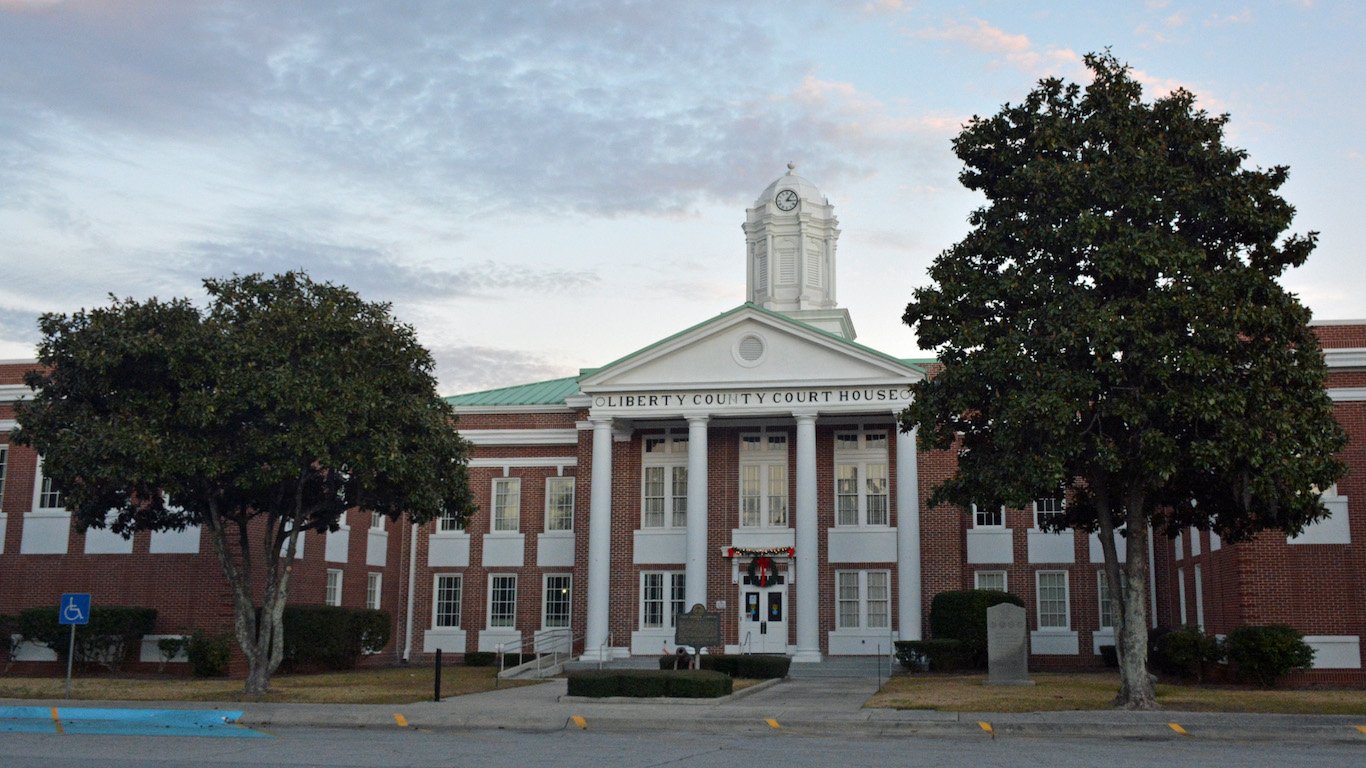
3. Hinesville, GA
> Homeownership rate: 48.5%
> Median home value: $107,700
> Median household income: $43,331
As in most metro areas on this list, not only is the homeownership rate low in Hinesville, but it has declined substantially in recent years. The percentage of housing units owned by their occupants fell from 73.4% in 2010, when it was above the national average, to its current level, just 48.5% — a precipitous drop compared with other metro areas. While in many areas a low median home value can drive up homeownership, Hinesville appears to be an exception. The typical home value in the area is just $107,700, one of the lowest in the country.

2. Los Angeles-Long Beach-Anaheim, CA
> Homeownership rate: 48.3%
> Median home value: $494,900
> Median household income: $60,514
The Los Angeles-Long Beach-Anaheim area is home to some of the most expensive housing in the country. The median home value of $494,900 is seventh highest of all metro areas and several times greater than the national median of $181,200. The typical home value is also more than eight times the area’s median household income, which at $60,514 is actually higher than the national median. Across the country, homes tend to be worth just over three times the typical household income.
As further testament to the high cost of housing, 73.1% of owner-occupied homes have a mortgage, well above the national percentage of 63.8%. Not only are fewer individuals buying homes with cash, but fewer homeowners have managed to pay off their home loans.
[wallst_email_signup]
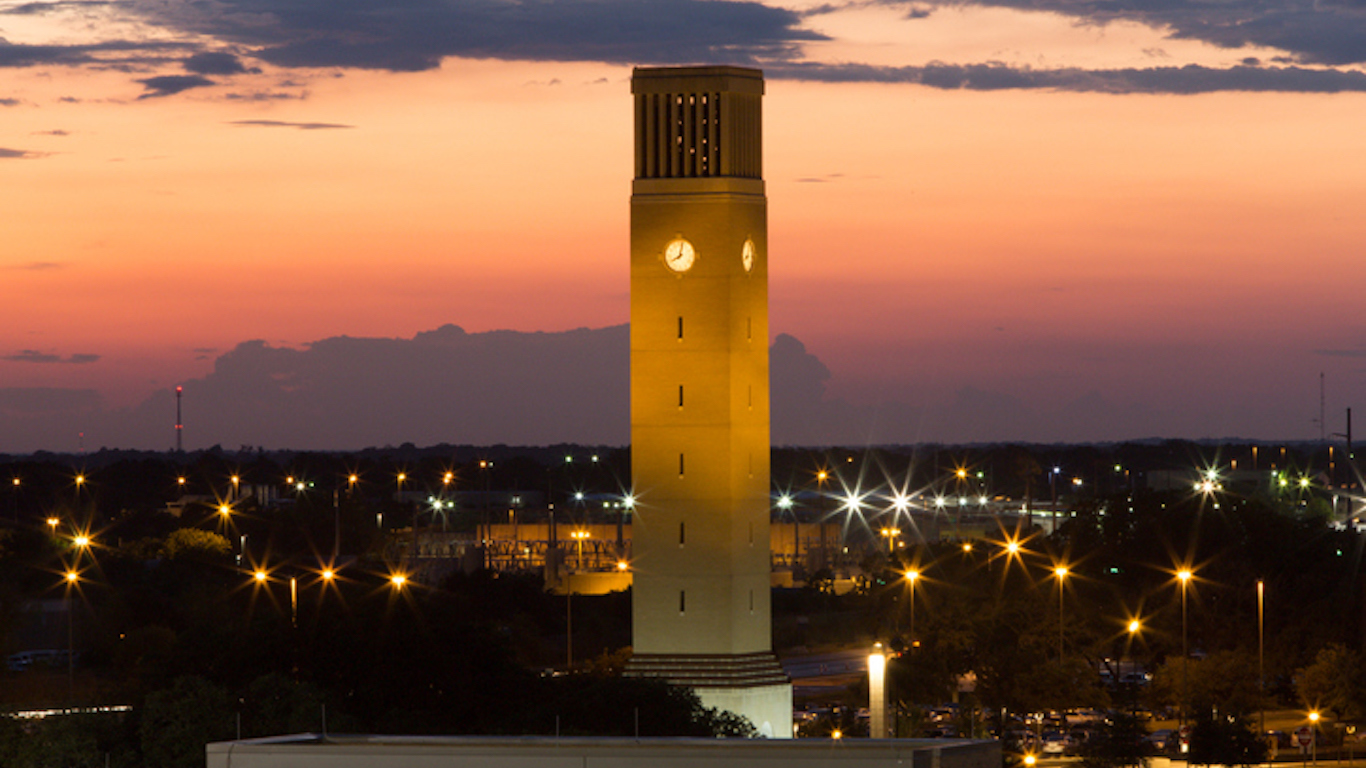
1. College Station-Bryan, TX
> Homeownership rate: 47.7%
> Median home value: $149,600
> Median household income: $42,116
The College Station-Bryan area has the lowest homeownership rate of all U.S. metro areas, at 47.7%. As is the case in a handful of other metro areas, the relatively high share of university students living in College Station, home to Texas A&M University — one of the nation’s oldest and largest university systems — likely skews the homeownership rate downward. More than one in four area residents are enrolled in a post-secondary institution.
Poor economic conditions and financial instability likely also contribute to the low home ownership. The area’s poverty rate of 26.3%, for example, is one of the highest in the country.
Contact [email protected] for any questions or corrections.