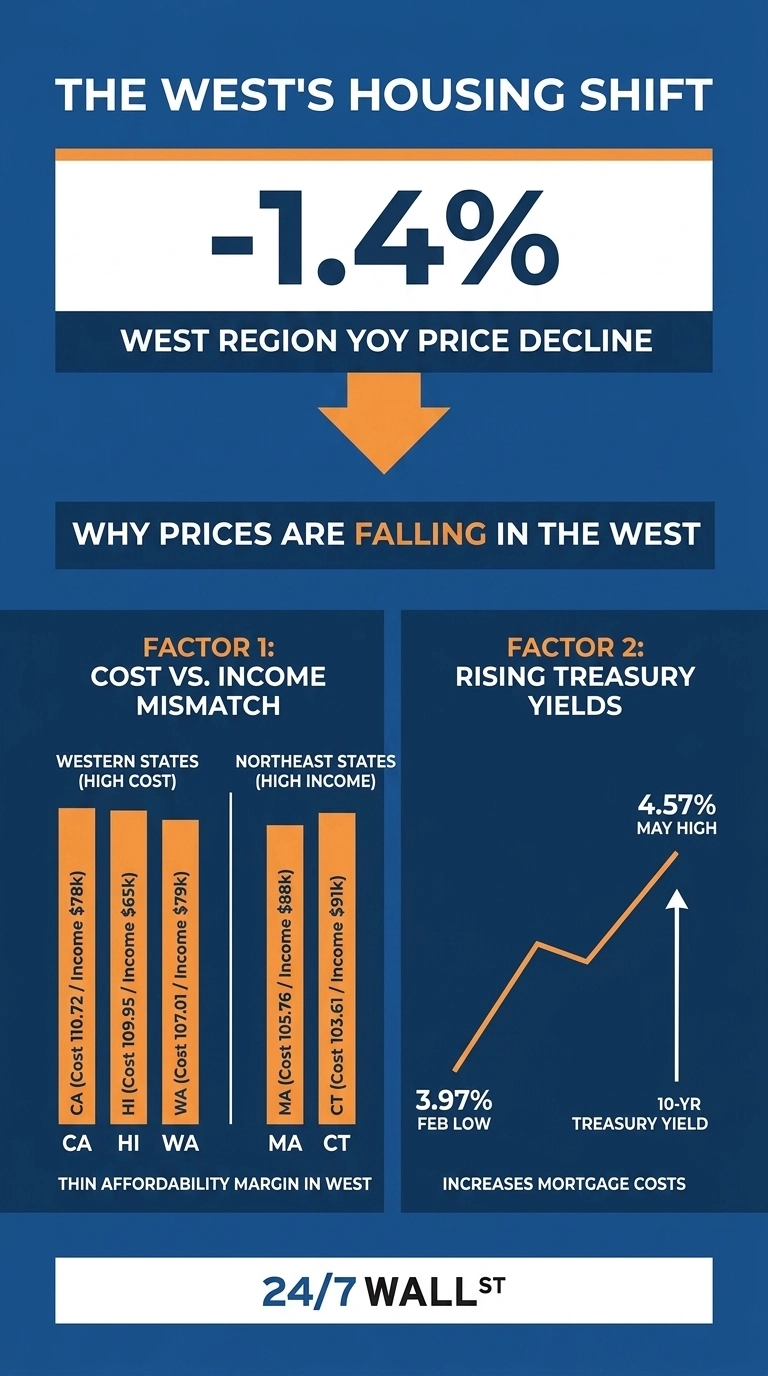
The National Association of Realtors’ April 2026 existing home sales report carries a national headline suggesting the housing market is still grinding higher, but beneath that average lies a regional split that changes the story. The West posted a 1.4% year-over-year price decline, the only one of the four Census regions where median sale prices actually fell. Everywhere else, prices kept climbing. Location now determines whether homeowners are watching their equity build or slip.
This is the frame that matters: the national number averages a falling West into a still-rising rest of the country. A buyer in Phoenix or a seller in Sacramento is in a measurably different market than a buyer in Boston or a seller in Atlanta. The same NAR report describes both realities, and the regional divergence is what the single national figure hides.
Why the West Is Breaking First
The Western correction is rooted in an affordability ceiling that other regions have not hit as hard. Bureau of Economic Analysis data show California has a cost-of-living index of 110.72, the second-highest in the country, paired with a real per capita income of $78,015. Hawaii pairs an index of 109.951 with a real income of just $65,095. Washington and Oregon sit in similar territory.
Compare that to high-cost Northeast states. Massachusetts shows a cost index of 105.757 and a real income of $88,481. Connecticut sits at 103.61 and $91,770. The Northeast has comparable prices with meaningfully higher purchasing power. Western states show a thinner income cushion against their cost base. When mortgage rates climbed, Western buyers ran out of room first because their real income was already stretched against their cost base.
The Rate Backdrop Hits the West Harder
The 10-year Treasury yield closed June 3 at 4.48%, up from a February low of 3.97% and sitting in the 98.4th percentile of the trailing 12-month range. Because 30-year mortgage rates track the 10-year rate closely, a roughly 60-basis-point move over three months has translated into materially higher monthly payments. On a $750,000 California loan, that rate move matters in absolute dollars in a way it does not on a $250,000 Midwest loan. Identical rate moves create unequal regional pain.
The Western States Where Pressure Concentrates
Inside the regional number, a few state-level affordability profiles stand out:
- California: Cost index 110.72, real income $78,015. The largest gap between price level and purchasing power is in the country outside of Hawaii.
- Hawaii: Cost index 109.951, real income only $65,095. The sharpest affordability mismatch in the dataset.
- Washington: Cost index 107.013, real income $79,908. High prices without the income premium of comparable Northeast metros.
- Oregon: Cost index 103.361, real income $68,633.
- Wyoming: The Western outlier with a low cost index of 92.691 and the highest per capita income in the region at $86,609. Different market dynamics entirely.
The Macro Layer
The buyer hesitation showing up in Western listings also reflects macro pressure. University of Michigan Consumer Sentiment came in at 49.8 in April 2026, the lowest reading in the trailing 12 months and well into recessionary territory below the 60 threshold. Housing starts dropped to 1.465 million annualized units in April, down from 1.507 million in March. CPI remained firm enough that rate relief looks distant.
Real GDP growth came in at 2.0% in 2026 Q1, with personal consumption at a modest 1.6%. Per capita disposable income reached $68,617, while the savings rate slid to 4.0%. Households have more nominal income and less cushion, a combination that hurts most where prices are highest.
What the Report Actually Says
The NAR data documents a regional divergence within a still-rising national headline. Three regions held or extended gains. One region, anchored by states where the cost-of-living to real-income gap was already the widest in the country, gave back 1.4% on the year.
The mechanism is straightforward: when rates rise and sentiment sinks, the markets with the thinnest affordability margin correct first. For a Western homeowner, that means equity built during the post-2020 surge is being tested. For a Western buyer, it means the first real opening since prices ran away. The national average says the housing market is fine. The regional breakdown says the West is the place where it stopped being fine.
Contact [email protected] for any questions or corrections.