 [cnxvideo id=”625491″ placement=”ros”]Since the Affordable Care Act was enacted in 2010, millions of Americans have gained health insurance coverage. The national uninsured rate declined from 16.3% in 2010 to 9.1% in 2015 — the first time in U.S. history more than 90% of Americans have had health insurance.
The vast majority of U.S. metropolitan areas reported an increase in health insurance coverage between 2011 and last year. In some cities, however, the share of residents with health insurance has grown faster than in others. To determine the cities where health insurance coverage is soaring, 24/7 Wall St. reviewed data from the U.S. Census Bureau over the five-year period through 2015.
All 25 cities had health insurance coverage rates lower than the national coverage rate in 2011. Over the five-year period, these cities’ coverage rates increased by at least 10 percentage points, outpacing the national coverage improvement of 5.7 percentage points. The largest increase was in the Wenatchee, Washington area, where the health insurance coverage rate increased from 78.2% in 2011 to 92.4% in 2015, a 14.2 percentage point increase.
Click here to see the 25 cities where health insurance coverage is soaring.
The Affordable Care Act was likely the leading cause of the increase in health insurance coverage. Under the ACA states could expand Medicaid to more low-income Americans. In states that accepted this provision, persons under 65 years who earn incomes up to 138% of the federal poverty level can qualify for Medicaid.
However, 19 states chose not to accept the federal funding and opted out of the Medicaid provision. Cities in these states tend to have lower health insurance coverage than cities in other states. Further, the areas where health insurance coverage improved slowly or not at all between 2011 and 2015 tended to be in the states that chose not to adopt the Medicaid expansion. Of the 25 cities with the largest increases in health insurance coverage, 22 are in states that expanded Medicaid under the ACA.
Because Medicaid expansion disproportionately helps areas with poorer populations, most of the cities with the largest increases in health insurance coverage remain among the poorer metro areas in the nation.
To determine the cities where health insurance coverage is increasing the most, 24/7 Wall St. reviewed the percentage point change between 2011 and 2015 in health insurance coverage rates in each U.S. metro area. Data for metropolitan statistical areas, including uninsured rates and poverty rates came from the U.S. Census Bureau’s 2011 and 2015 American Community Surveys. National uninsured rates came from the Census Bureau’s Current Population Survey. The total number of people added to the insured population between 2011 and 2015 of each metro area was calculated by taking the difference between the number of uninsured residents in 2011 and 2015, which were rounded to the nearest thousand.
These are the 25 cities where health insurance coverage is soaring.
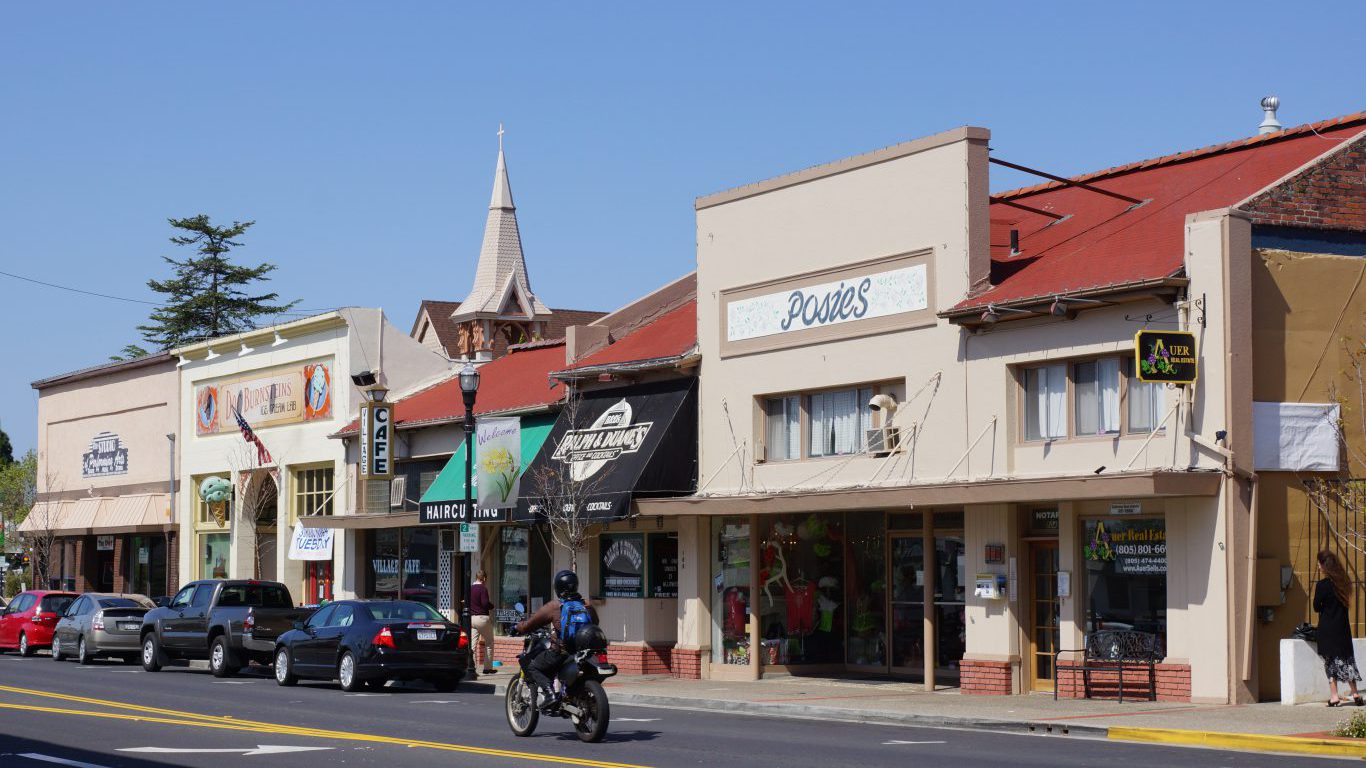
25. San Luis Obispo-Paso Robles-Arroyo Grande, CA
> Insured rate chg. 2011-2015: +10.0
> Pct. with health insurance 2011: 83.6%
> Pct. with health insurance 2015: 93.6%
> Growth of insured pop.: +26,000
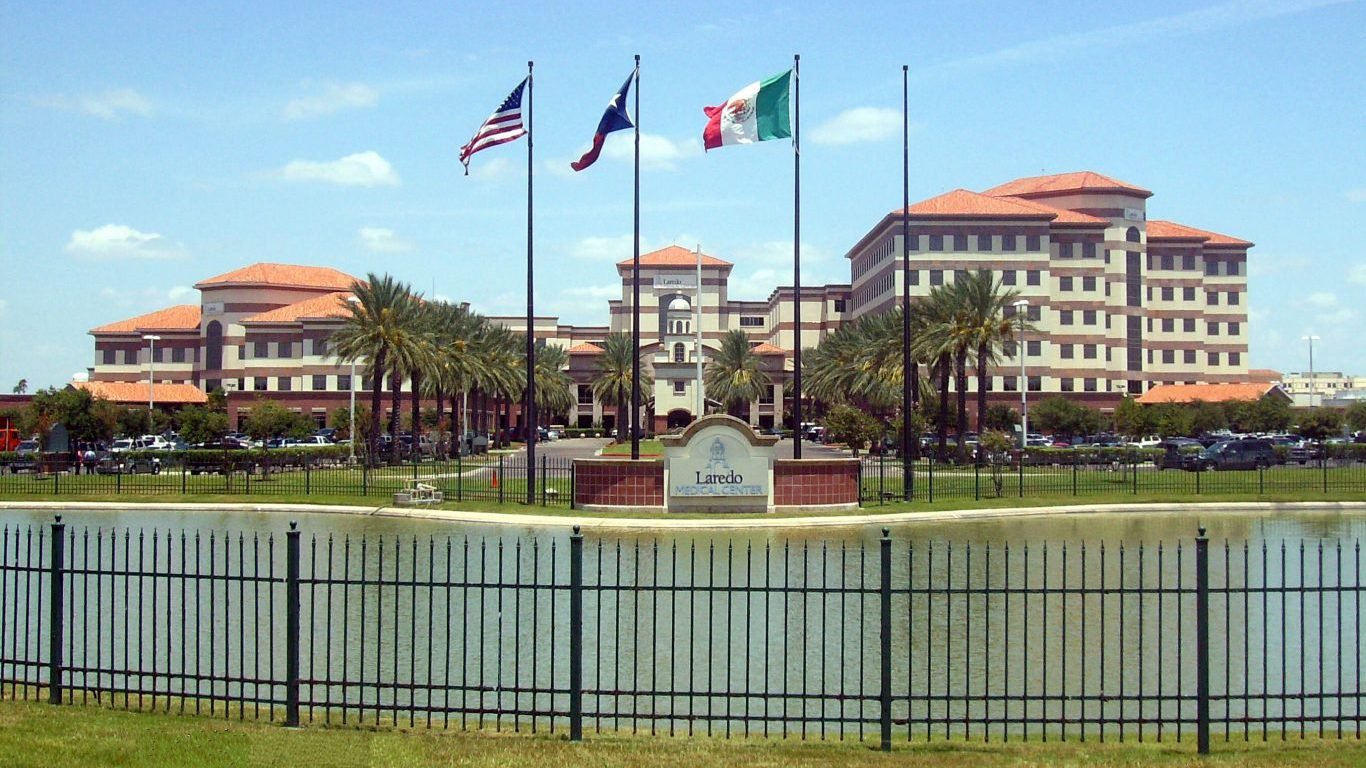
24. Laredo, TX
> Insured rate chg. 2011-2015: +10.1
> Pct. with health insurance 2011: 63.7%
> Pct. with health insurance 2015: 73.8%
> Growth of insured pop.: +22,000
[nativounit]
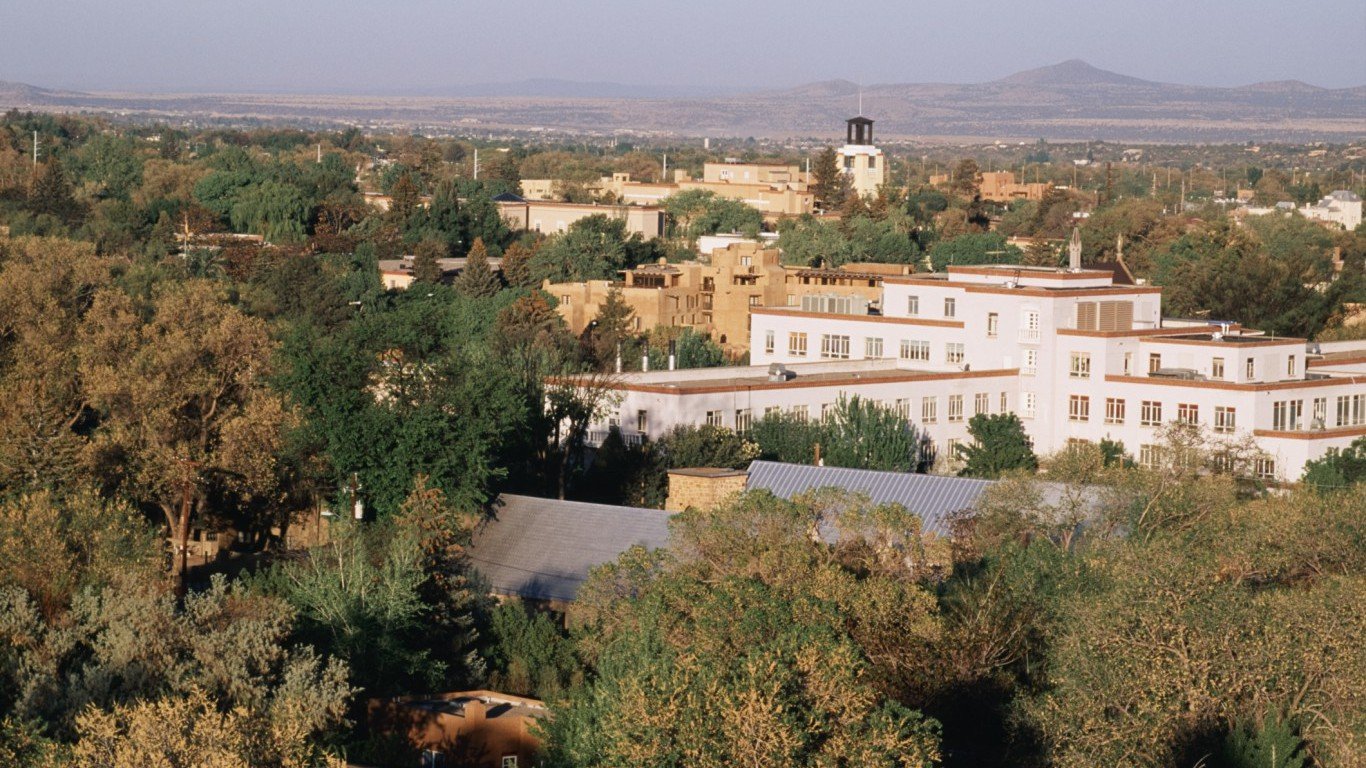
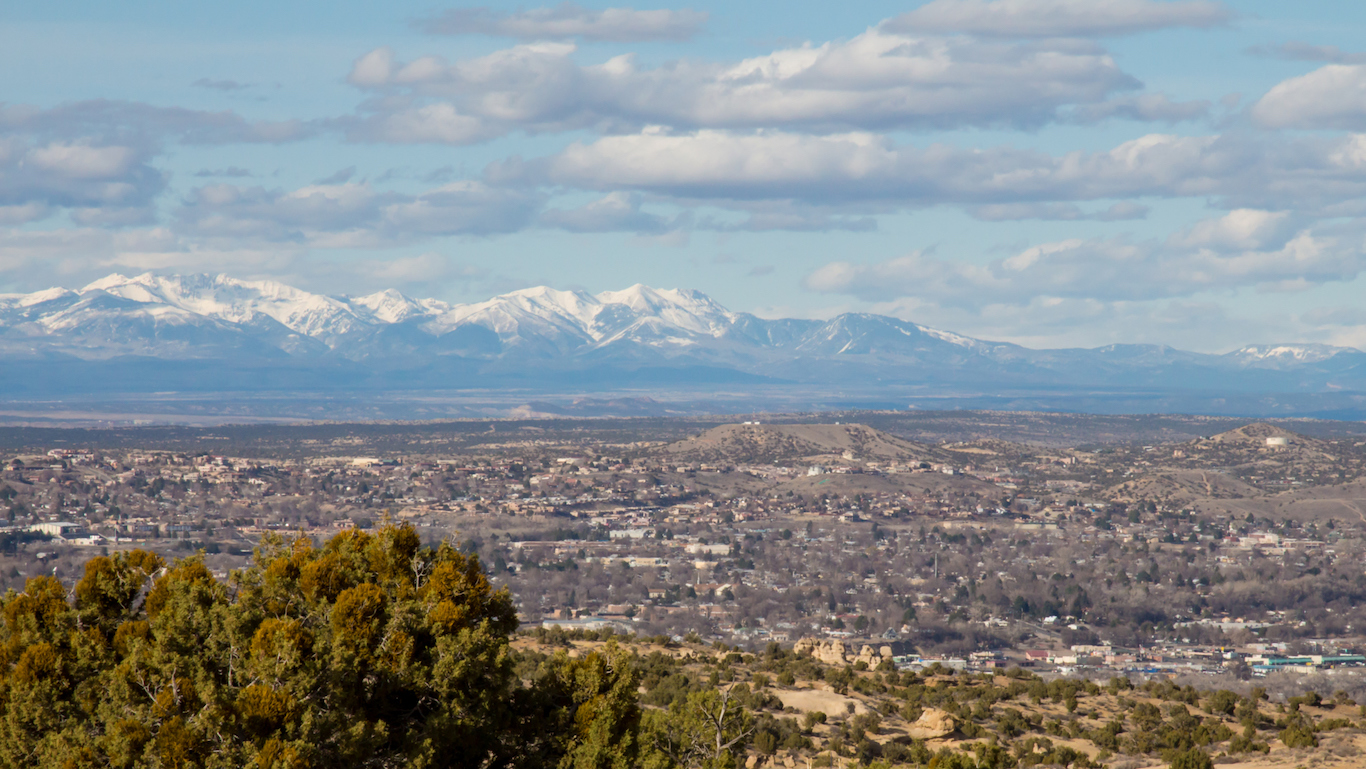
23. Santa Fe, NM
> Insured rate chg. 2011-2015: +10.1
> Pct. with health insurance 2011: 78.5%
> Pct. with health insurance 2015: 88.6%
> Growth of insured pop.: +14,000
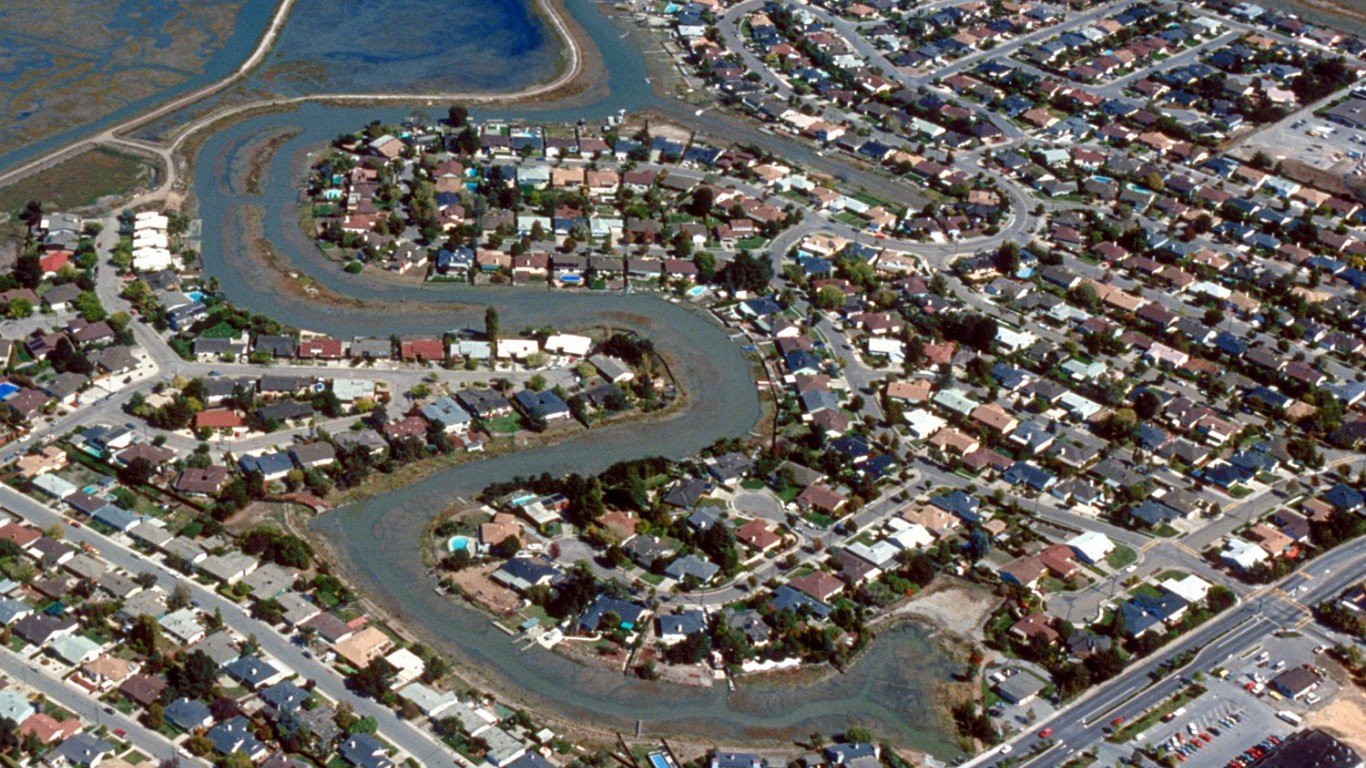
22. Madera, CA
> Insured rate chg. 2011-2015: +10.1
> Pct. with health insurance 2011: 78.4%
> Pct. with health insurance 2015: 88.5%
> Growth of insured pop.: +14,000
[recirclink id=356614]
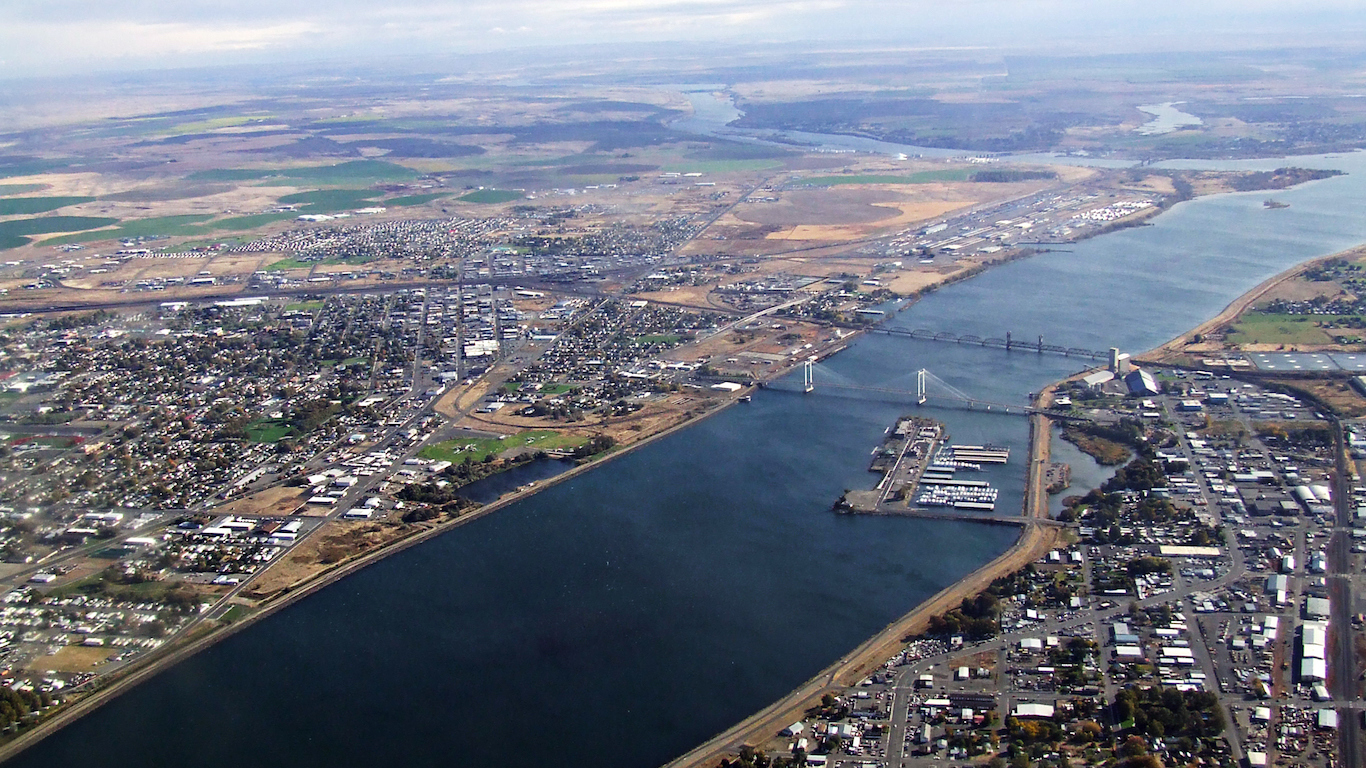
21. Kennewick-Richland, WA
> Insured rate chg. 2011-2015: +10.1
> Pct. with health insurance 2011: 81.4%
> Pct. with health insurance 2015: 91.5%
> Growth of insured pop.: +25,000

20. Napa, CA
> Insured rate chg. 2011-2015: +10.1
> Pct. with health insurance 2011: 84.2%
> Pct. with health insurance 2015: 94.3%
> Growth of insured pop.: +14,000

19. Salem, OR
> Insured rate chg. 2011-2015: +10.2
> Pct. with health insurance 2011: 83.1%
> Pct. with health insurance 2015: 93.3%
> Growth of insured pop.: +39,000
[nativounit]
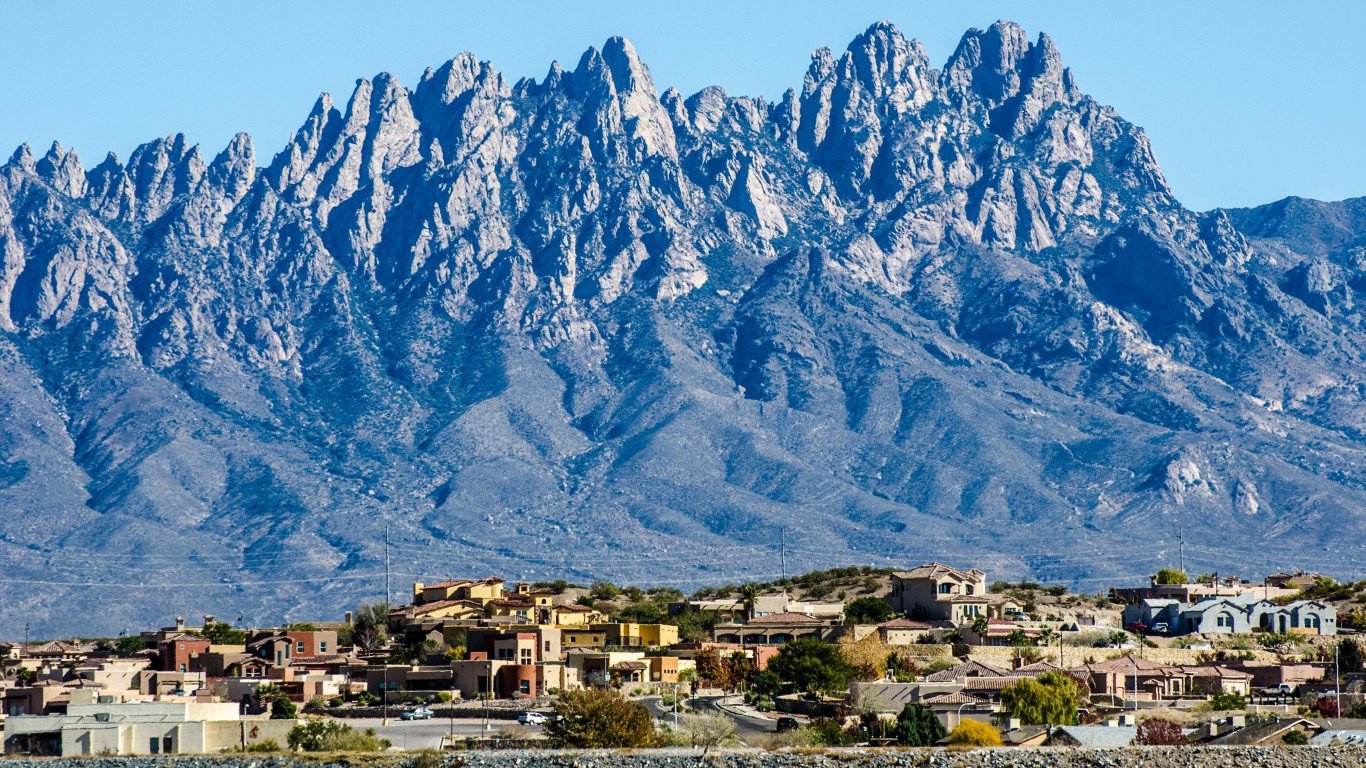
18. Las Cruces, NM
> Insured rate chg. 2011-2015: +10.2
> Pct. with health insurance 2011: 79.2%
> Pct. with health insurance 2015: 89.4%
> Growth of insured pop.: +21,000

17. Monroe, LA
> Insured rate chg. 2011-2015: +10.6
> Pct. with health insurance 2011: 76.6%
> Pct. with health insurance 2015: 87.2%
> Growth of insured pop.: +18,000
[wallst_email_signup]

16. Riverside-San Bernardino-Ontario, CA
> Insured rate chg. 2011-2015: +11.0
> Pct. with health insurance 2011: 79.6%
> Pct. with health insurance 2015: 90.6%
> Growth of insured pop.: +451,000
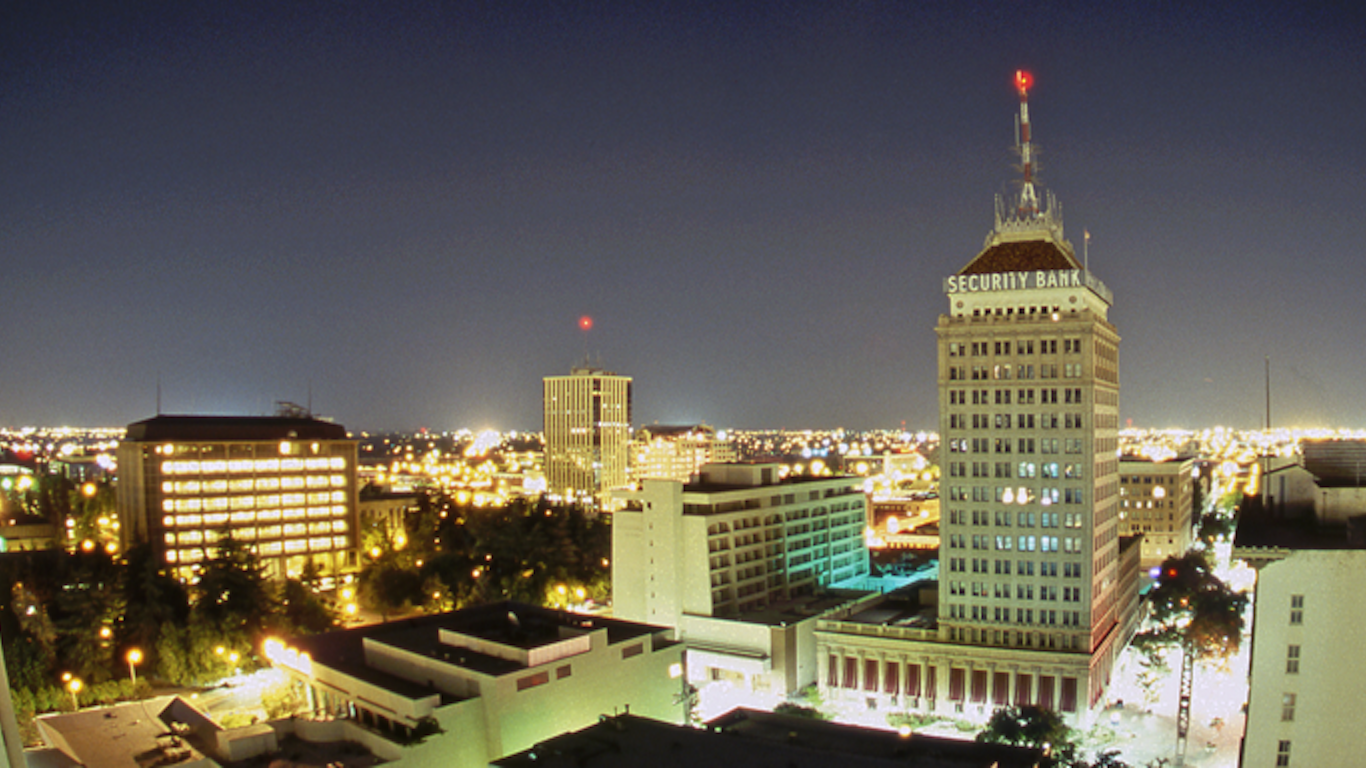
15. Fresno, CA
> Insured rate chg. 2011-2015: +11.0
> Pct. with health insurance 2011: 79.3%
> Pct. with health insurance 2015: 90.3%
> Growth of insured pop.: +99,000
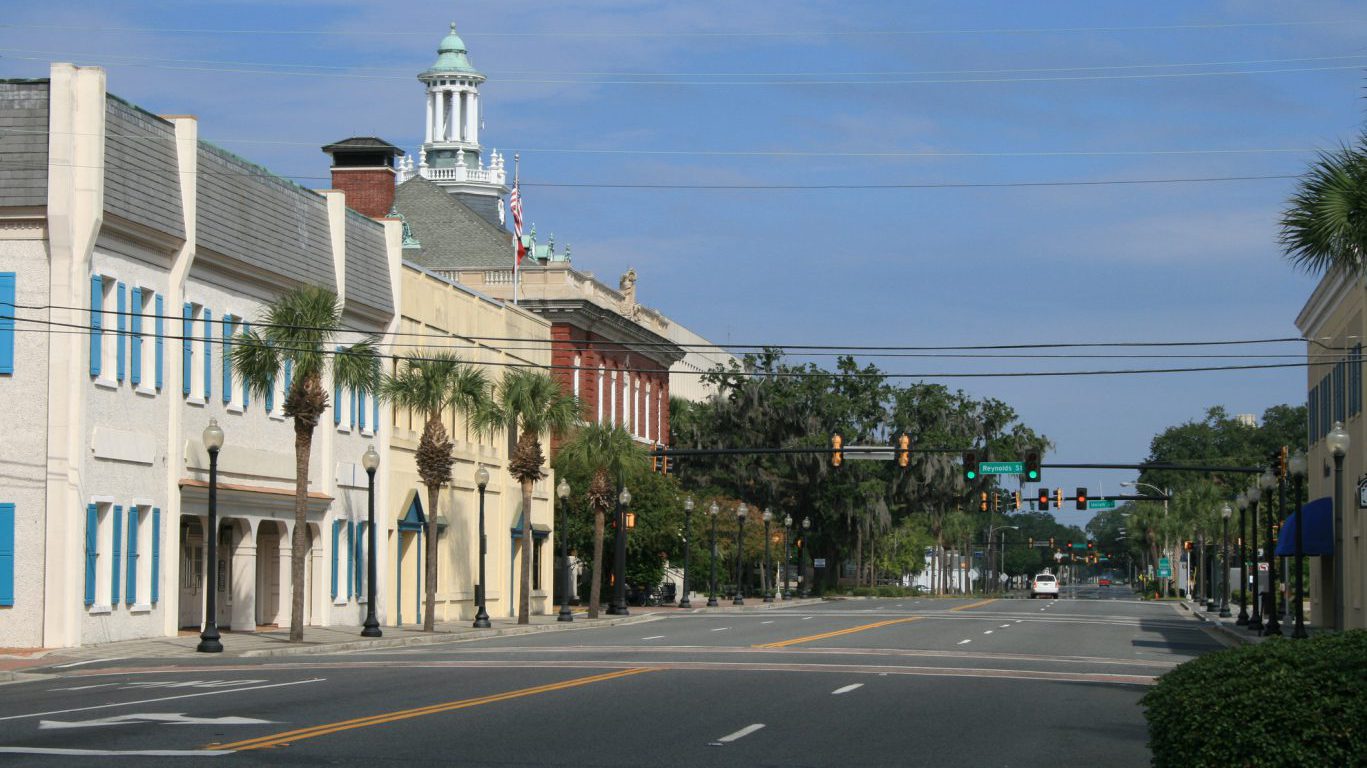
14. Brunswick, GA
> Insured rate chg. 2011-2015: +11.1
> Pct. with health insurance 2011: 73.7%
> Pct. with health insurance 2015: 84.8%
> Growth of insured pop.: +11,000
[recirclink id=357300]
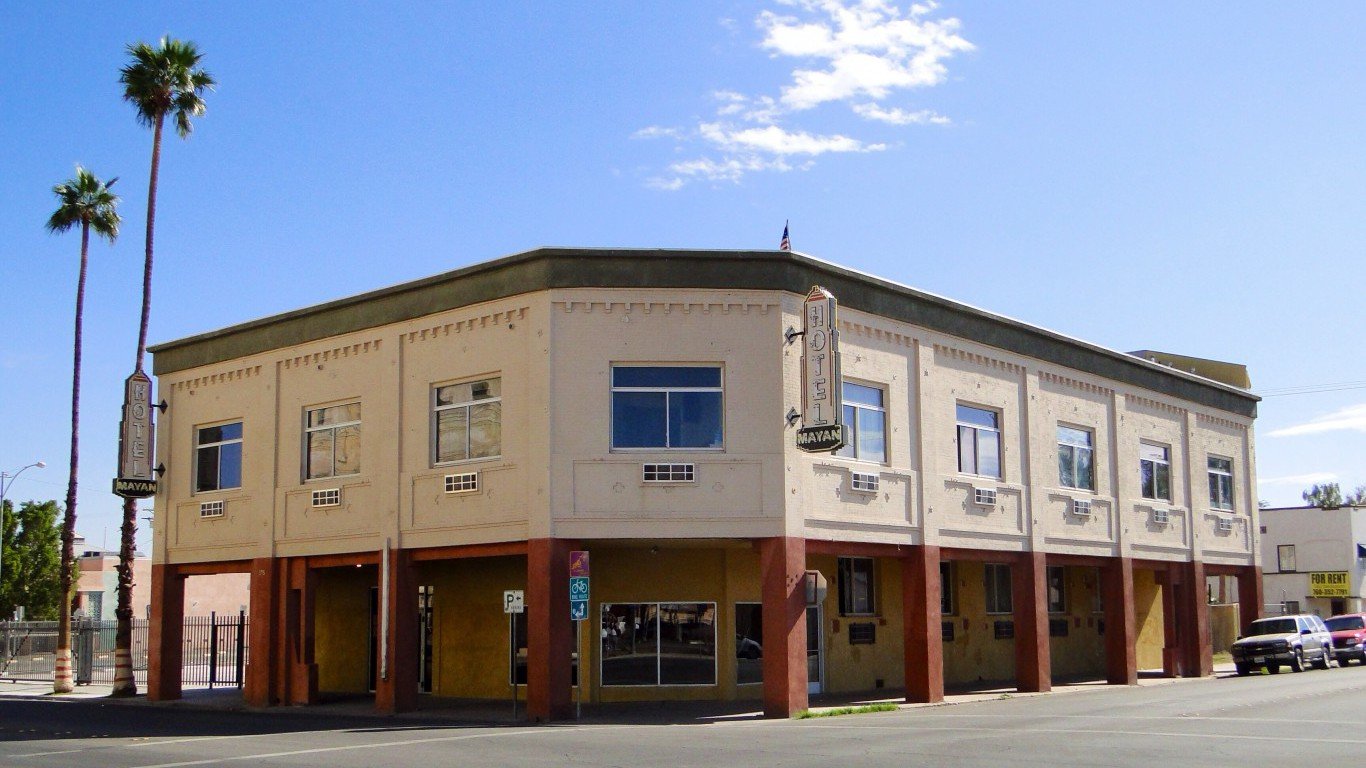
13. El Centro, CA
> Insured rate chg. 2011-2015: +11.2
> Pct. with health insurance 2011: 78.9%
> Pct. with health insurance 2015: 90.1%
> Growth of insured pop.: +18,000

12. Salinas, CA
> Insured rate chg. 2011-2015: +11.5
> Pct. with health insurance 2011: 77.8%
> Pct. with health insurance 2015: 89.3%
> Growth of insured pop.: +44,000
[nativounit]
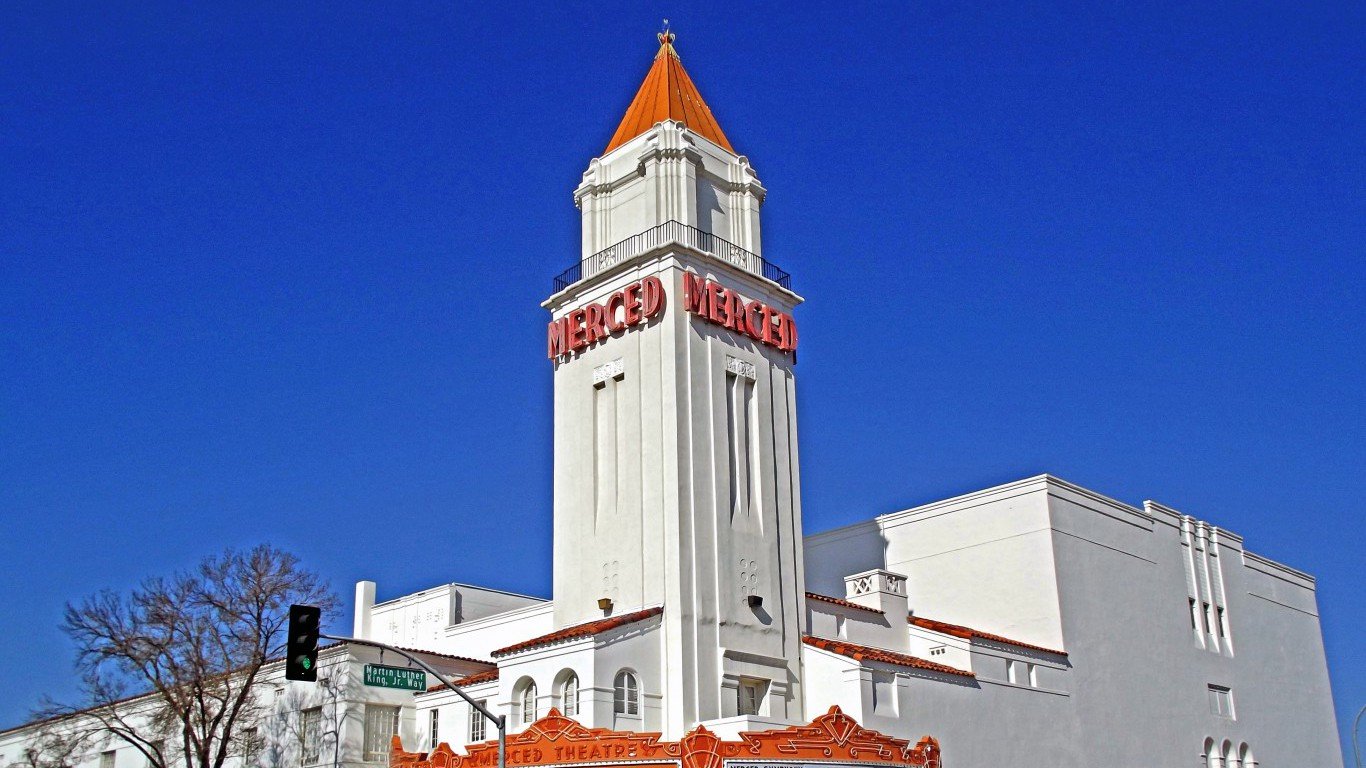
11. Merced, CA
> Insured rate chg. 2011-2015: +11.8
> Pct. with health insurance 2011: 79.3%
> Pct. with health insurance 2015: 91.1%
> Growth of insured pop.: +30,000

10. Chico, CA
> Insured rate chg. 2011-2015: +11.9
> Pct. with health insurance 2011: 81.3%
> Pct. with health insurance 2015: 93.2%
> Growth of insured pop.: +26,000

9. Bakersfield, CA
> Insured rate chg. 2011-2015: +12.0
> Pct. with health insurance 2011: 79.5%
> Pct. with health insurance 2015: 91.5%
> Growth of insured pop.: +96,000
[wallst_email_signup]
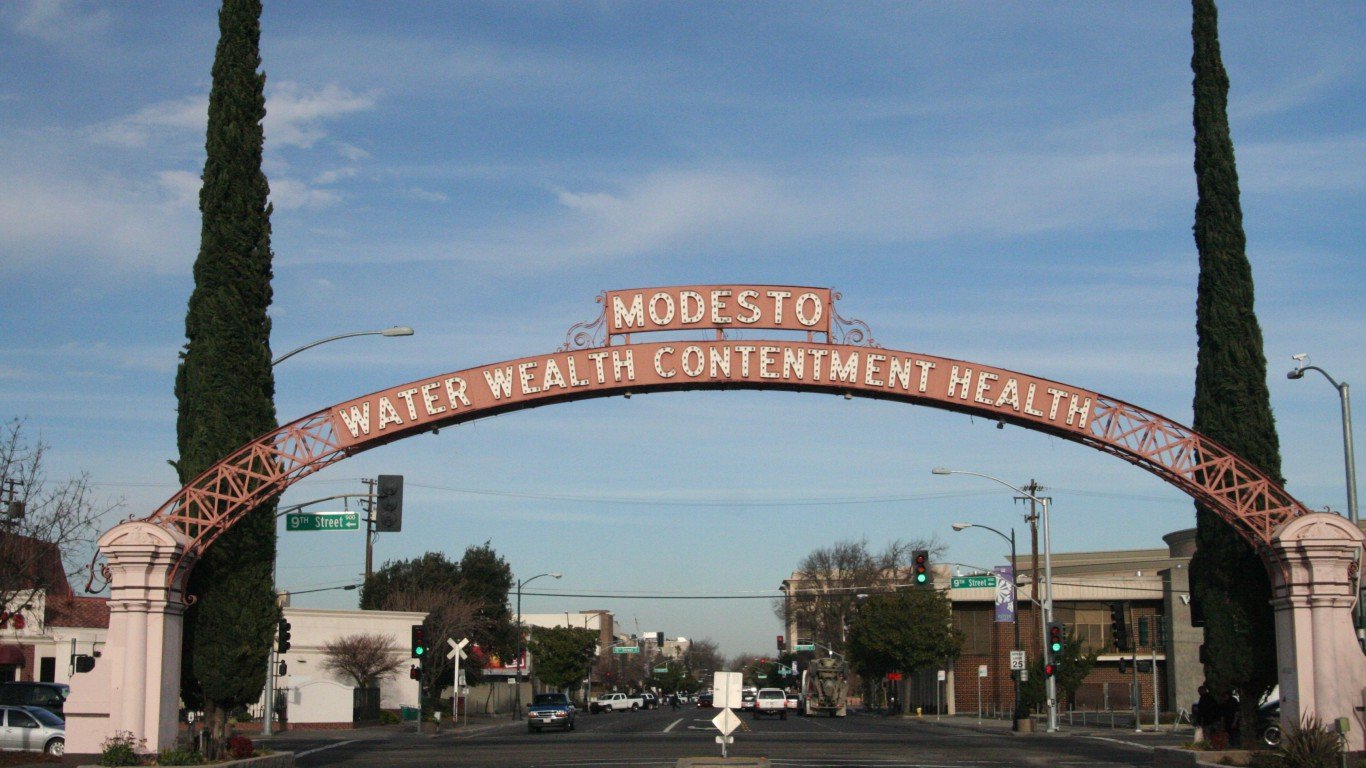
8. Modesto, CA
> Insured rate chg. 2011-2015: +12.1
> Pct. with health insurance 2011: 81.4%
> Pct. with health insurance 2015: 93.5%
> Growth of insured pop.: +61,000
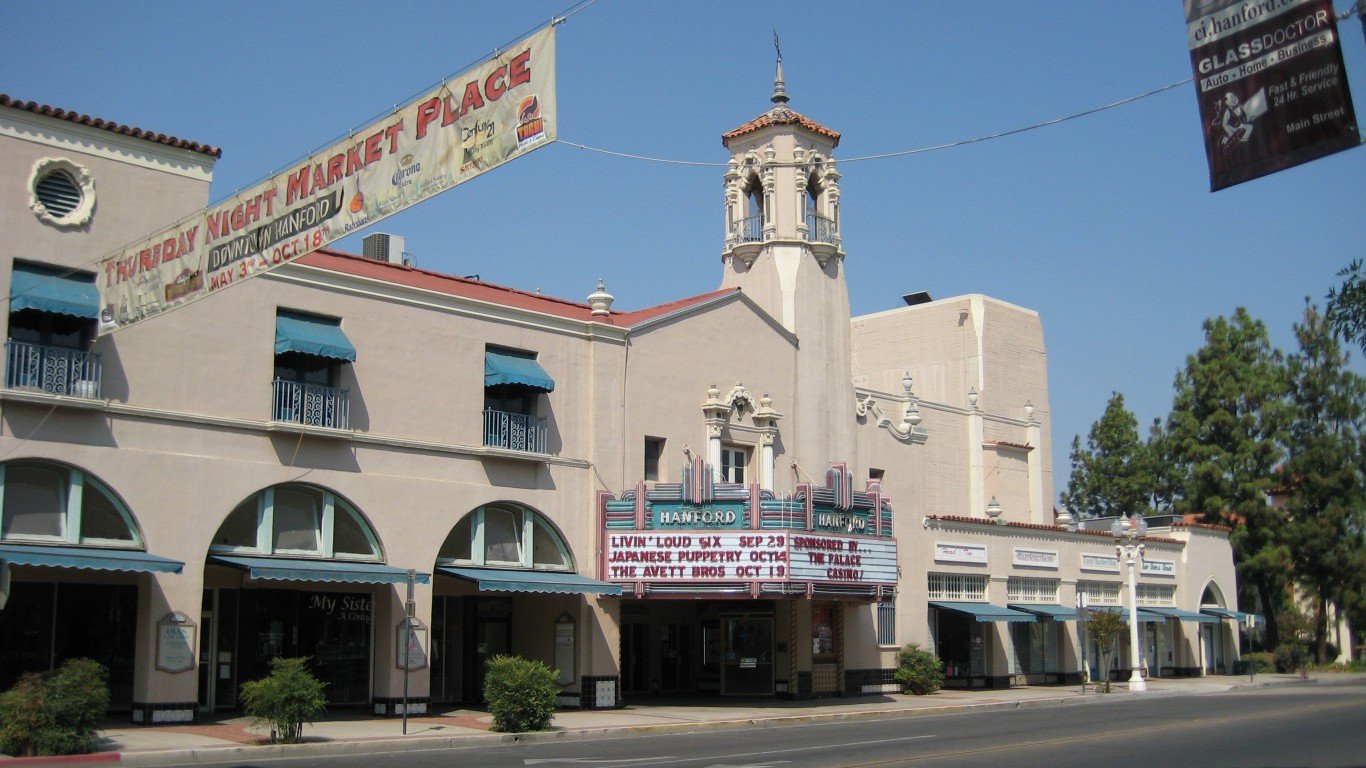
7. Hanford-Corcoran, CA
> Insured rate chg. 2011-2015: +12.3
> Pct. with health insurance 2011: 80.7%
> Pct. with health insurance 2015: 93.0%
> Growth of insured pop.: +16,000
[nativounit]
6. Farmington, NM
> Insured rate chg. 2011-2015: +12.3
> Pct. with health insurance 2011: 72.7%
> Pct. with health insurance 2015: 85.0%
> Growth of insured pop.: +17,000

5. Medford, OR
> Insured rate chg. 2011-2015: +13.0
> Pct. with health insurance 2011: 79.6%
> Pct. with health insurance 2015: 92.6%
> Growth of insured pop.: +26,000
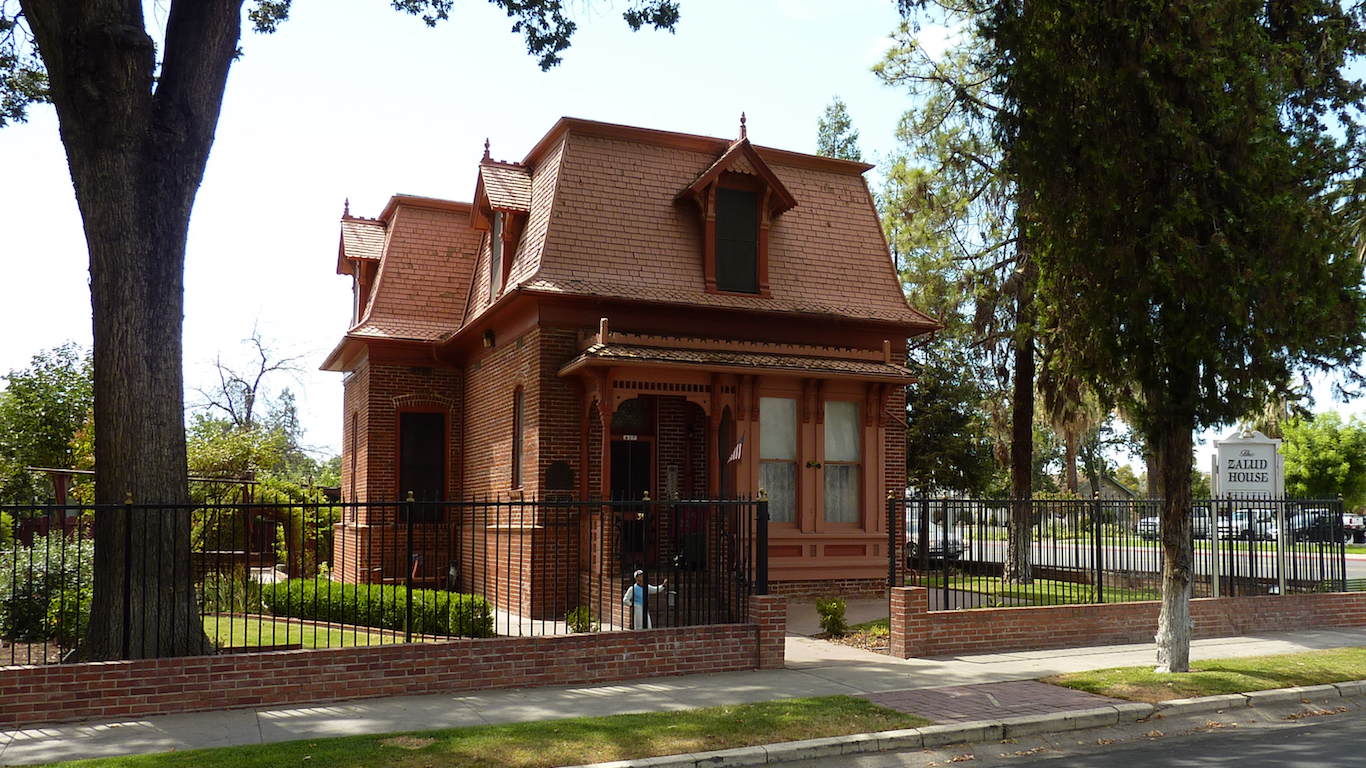
4. Visalia-Porterville, CA
> Insured rate chg. 2011-2015: +13.2
> Pct. with health insurance 2011: 77.0%
> Pct. with health insurance 2015: 90.2%
> Growth of insured pop.: +58,000
[nativounit]

3. Reno, NV
> Insured rate chg. 2011-2015: +13.2
> Pct. with health insurance 2011: 77.6%
> Pct. with health insurance 2015: 90.8%
> Growth of insured pop.: +54,000

2. Myrtle Beach-Conway-North Myrtle Beach, SC-NC
> Insured rate chg. 2011-2015: +13.2
> Pct. with health insurance 2011: 73.9%
> Pct. with health insurance 2015: 87.1%
> Growth of insured pop.: +16,000
[recirclink id=356833]

1. Wenatchee, WA
> Insured rate chg. 2011-2015: +14.2
> Pct. with health insurance 2011: 78.2%
> Pct. with health insurance 2015: 92.4%
> Growth of insured pop.: +16,000
Contact [email protected] for any questions or corrections.