Moving from one city to another is much more common in the United States than it used to be. No matter the reasons for the move — buying a house, looking for a new job, leaving home for the first time — it is always a major undertaking. A host of factors play an important role in deciding where to move, including the quality of schools, the strength of the local economy and job market, safety, culture, and even climate. Americans facing this decision have much to consider.
To determine America’s best cities to live in, 24/7 Wall St. reviewed data on the 550 U.S. cities with populations of 65,000 or more as measured by the U.S. Census Bureau. Based on a range of variables, including crime rates, employment growth, access to restaurants and attractions, educational attainment, and housing affordability, 24/7 Wall St. identified America’s 50 Best Cities to Live.
[in-text-ad]
Deciding where to live, or whether your current city meets your standards, can be a highly subjective assessment. In an interview with 24/7 Wall St., Elise Gould, senior economist with nonprofit think tank the Economic Policy Institute, noted several personal factors that cannot be easily measured. The presence of a family support system or an individual’s personal preference for oceans or mountains, she explained, can have a major bearing on the decision of where to move — or whether to move at all.
Click here to see America’s best cities to live.
Click here to see America’s worst cities to live.
Click here to see our full methodology.
Gould also acknowledged that the reasons for relocating differ considerably depending on the person or family. With children, the quality and presence of public schools becomes important; as a young person, the age of a population may be a significant factor; and, for someone without a large disposable income, the presence of certain amenities may be entirely irrelevant.
Still, for most Americans, a few social and economic characteristics largely account for a city’s desirability and overall quality. “People move for work,” Gould said. For many families on the move, the prospect of obtaining a job is often the most important — if not the only — consideration. For this reason, 24/7 Wall St. weighed this factor heavily when identifying the best places to live.
In 45 of the 50 best cities to live, the annual unemployment rates are below the national rate, and with a few exceptions, all 50 cities reported job growth at least in line with the national job growth rate. Incomes in these cities, when adjusted for cost of living, exceed the national annual household income of $55,775 in the vast majority of cases.
Many of the cities on this list are very expensive places to live. In Broomfield, Colorado, even after adjusting for the city’s high cost of living, the typical household income of $76,231 a year remains well above the national median. Conversely, many of the best cities have a relatively low cost of living, and already high incomes therefore become even higher.
The populations of many of these cities are also growing very fast. Over the past five years, the populations of all but a handful of the 50 cities grew substantially faster than the national five-year population growth rate of 3.9%. Commenting on expensive cities with growing populations, Gould said, “the benefits must be outweighing those high costs.”

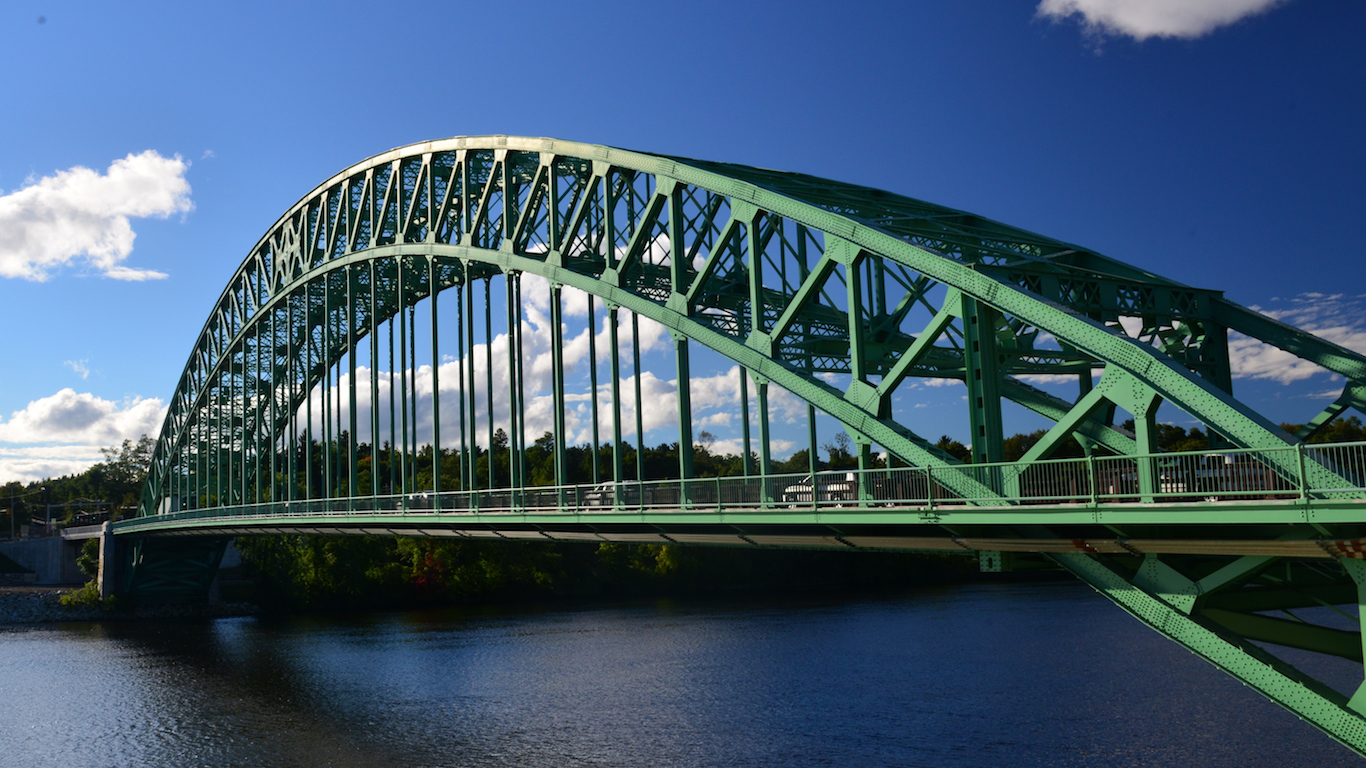
50. Portland, Maine
> Population: 66,872
> Median home value: $267,100
> Poverty rate: 15.5%
> Pct. with at least a bachelor’s degree: 50.0%
While Portland is by far the largest city in Maine, it is by no means among the nation’s largest urban centers. Still, Portland has more attractions and amenities relative to the size of its population than nearly any U.S. city. The city is in the top five in restaurants per capita, and no major U.S. city has more museums, sports teams, or sport clubs per capita. The city is also a great place to live for those who love nature and the outdoors. The area is home to a number of parks, and Portland is rated among the best for air quality.
[in-text-ad]
Many city residents are able to find work within Portland, which reduces commute times and travel expenses. More than one in 10 working city residents walk to their job, one of the highest such shares of any U.S. city.

49. Hoover, Alabama
> Population: 84,839
> Median home value: $277,900
> Poverty rate: 4.7%
> Pct. with at least a bachelor’s degree: 54.1%
More than half of all adults living in Hoover have earned at least a bachelor’s degree, a far higher share than is typical in both the state and the country. With an educated population, incomes in the city are high. Not only does the typical city household earn $77,365 a year, but also a dollar goes further in Hoover than it does nationwide. Goods and services cost about 9% less in Hoover than they do across the country on average.
There are plenty of venues for culture and leisure in Hoover. The city has a higher concentration of restaurants, theater companies, recreational centers, movie theaters, and libraries than most U.S. cities.
[nativounit]

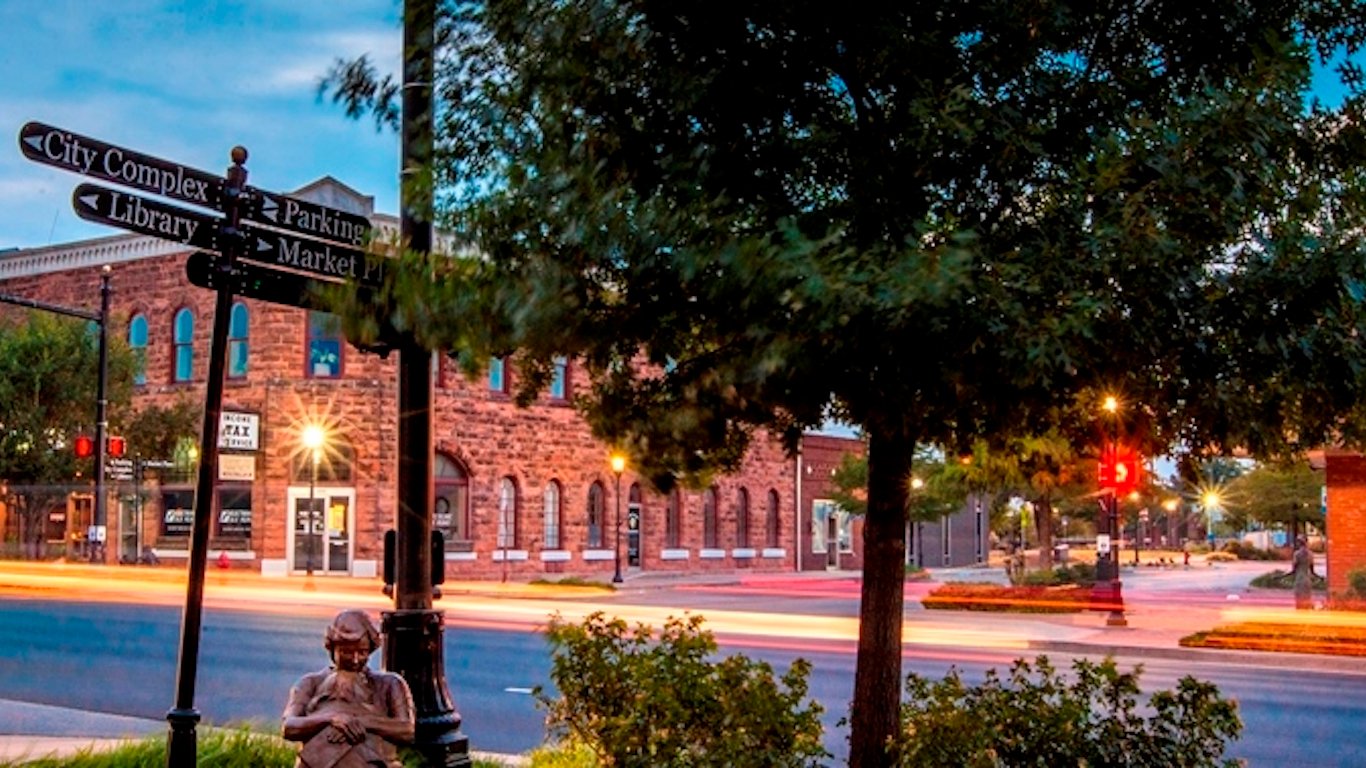
48. Concord, North Carolina
> Population: 87,693
> Median home value: $167,900
> Poverty rate: 10.8%
> Pct. with at least a bachelor’s degree: 32.4%
Concord is one of the best cities to live in America. Just a short drive from Charlotte, North Carolina’s largest city, Concord residents can enjoy the amenities of a major metropolis without the higher housing costs associated with large cities. While the typical Concord household earns $53,000 annually, similar to earnings in Charlotte, the typical home in Concord is nearly $21,000 less expensive than in Charlotte.
Concord is also far safer than much of the rest of the state. There were 153 violent crimes per 100,000 residents in Concord in 2015, less than half the statewide crime rate of 347 incidents per 100,000 North Carolinians.
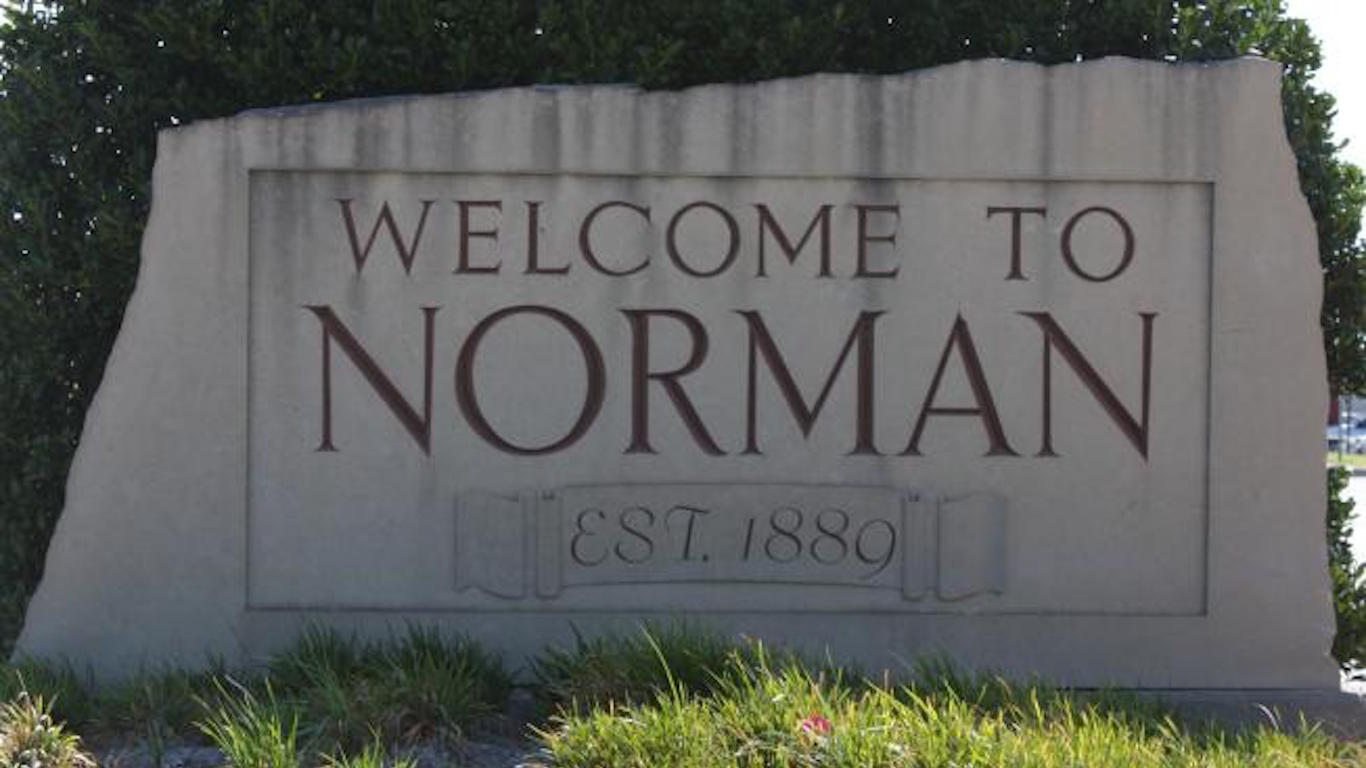
47. Norman, Oklahoma
> Population: 120,297
> Median home value: $180,000
> Poverty rate: 16.8%
> Pct. with at least a bachelor’s degree: 40.1%
The population of Norman has grown by 23.4% over the past decade, more than twice the U.S. growth rate over the same time. One major driver may have been the availability of jobs in the area. Just 3.1% of Norman’s workforce is unemployed, a far lower annual unemployment rate than both Oklahoma’s and the nation’s. The largest employer in the city, the University of Oklahoma, may also play a role in the city’s high educational attainment. More than two in five Norman adults have at least a bachelor’s degree, one of the highest proportions of any city in Oklahoma.
Located within Tornado Alley, Norman has a high risk of natural disaster. The National Weather Center, based in Norman, collaborates with university and national scientific organizations to better understand the atmosphere and improve forecasts. The Center employs approximately 550 Oklahoma residents and has a major economic impact on the city.
[recirclink id=358577]

46. Portland, Oregon
> Population: 632,187
> Median home value: $348,300
> Poverty rate: 15.8%
> Pct. with at least a bachelor’s degree: 48.6%
Home to well over half a million people, Portland is considerably larger than the typical city on this list. Like many of the nation’s best cities, Portland is also growing. The city’s population grew by 23.1% over the past decade, double the national growth over that period.
A well educated city, 48.6% of adults in the Oregon city have earned at least a bachelor’s degree, a far larger share than is common nationwide. The city is also notable for its higher than average concentration of venues for entertainment and leisure. The city is home to more restaurants, theatre companies, and bars per capita than all but only a handful of other U.S. cities.
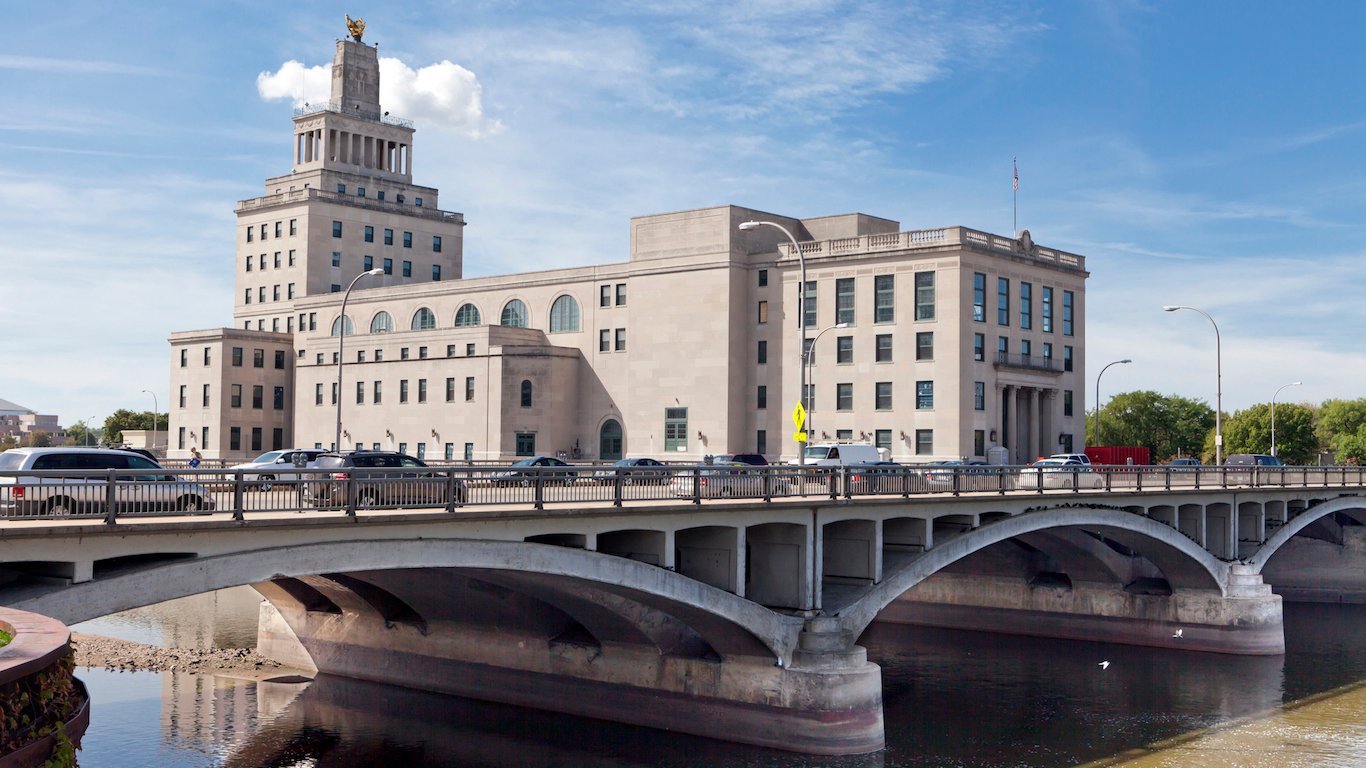
45. Cedar Rapids, Iowa
> Population: 130,405
> Median home value: $135,100
> Poverty rate: 14.1%
> Pct. with at least a bachelor’s degree: 29.0%
Cedar Rapids is one of the most affordable cities in the country. The price of a typical Cedar Rapids home of $135,100 is worth just 2.6 times the annual income of a typical area household of $55,011. With housing prices nationwide costing 3.5 times the national annual median household income, Cedar Rapids homeowners effectively save one year’s salary buying a home, compared to the typical American property owner. On average, goods and services in Cedar Rapids cost 11% less than in the U.S. as a whole.
[in-text-ad]
There is also no shortage of amenities and cultural venues to spend money on in Cedar Rapids. With the Cedar Rapids Museum of Art, the National Czech and Slovak Museum, and the African American Museum of Iowa, Cedar Rapids has a high concentration of museums. The city also has a relatively large number of bars and sports teams.
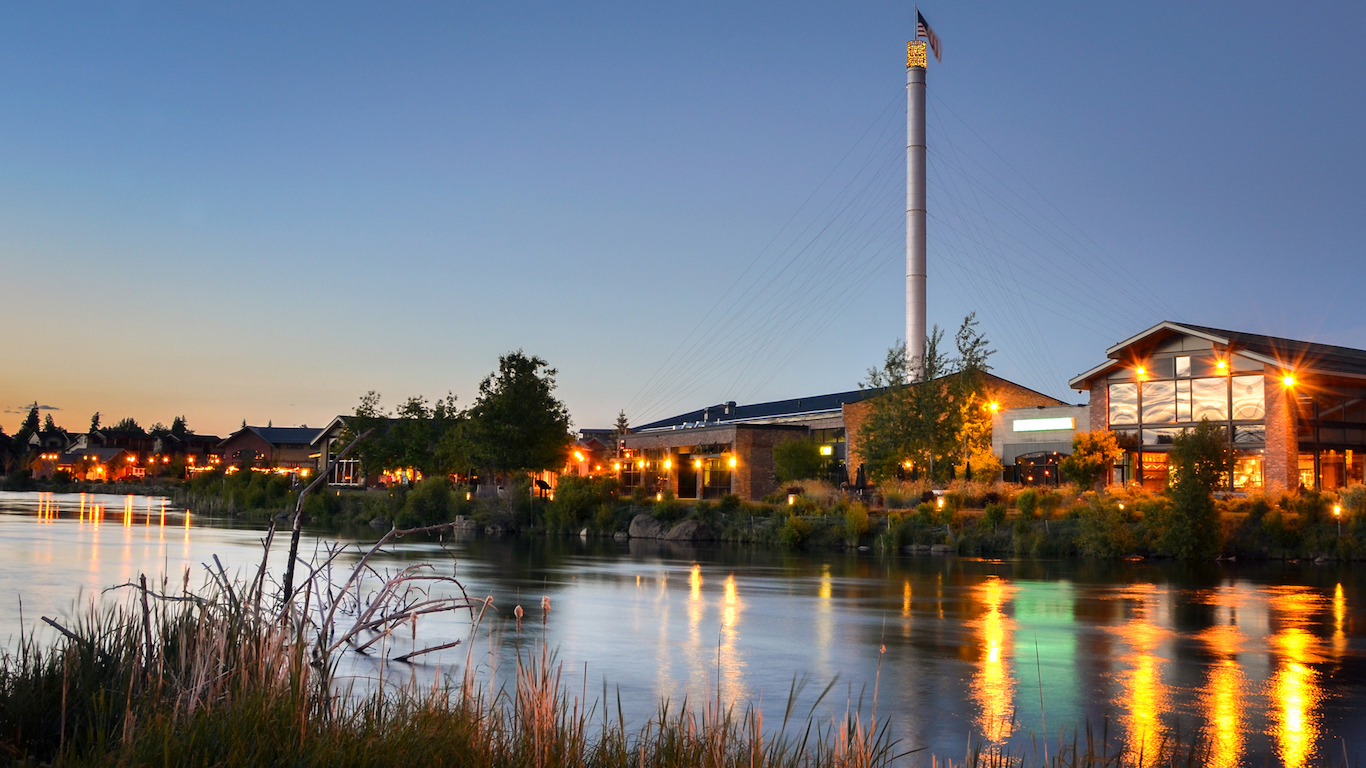
44. Bend, Oregon
> Population: 87,017
> Median home value: $331,300
> Poverty rate: 14.0%
> Pct. with at least a bachelor’s degree: 47.2%
Few U.S. cities have grown in recent years as rapidly as Bend, Oregon. The city’s population growth of 31.6% over the past decade far outpaced the national population growth rate of 11.5%. The local economy has handily accommodated the boom. Employment in Bend grew by 12.8% between 2013 and 2015, faster than in every other large U.S. city. The city’s 4.8% 2015 unemployment rate is slightly below both the respective state rate of 5.7%.
Bend has much to offer residents and visitors in the way of leisure activities and recreation. Residents of fewer than two dozen American cities have access to a greater concentration of golf courses, ski resorts, and fitness centers. Bend also has a relatively large share of restaurants and bars.
[nativounit]

43. South Jordan, Utah
> Population: 66,639
> Median home value: $354,000
> Poverty rate: 2.1%
> Pct. with at least a bachelor’s degree: 43.1%
South Jordan is one of the safest cities in the country. There were just 55 violent crimes per 100,000 South Jordan residents in 2015, much lower than the national violent crime rate of 373 incidents per 100,000 Americans. Like most cities where crime is uncommon, relatively few residents in South Jordan are struggling to make ends meet. Just 2.1% of the population lives in poverty, a smaller share than nearly any other U.S. city.
South Jordan is expanding rapidly and continues to attract high-income residents. The median household income of nearly $100,000 a year is far higher than the nationwide median income of $55,775 a year. Likely attracting new residents is the city’s 4,100-acre planned community, Daybreak, which started construction in 2004 and is expected to have as many as 20,000 housing units by completion.

42. St. George, Utah
> Population: 80,207
> Median home value: $229,400
> Poverty rate: 15.2%
> Pct. with at least a bachelor’s degree: 26.7%
St. George, Utah residents have a very high quality of life, at least in part because the city is relatively affordable. Goods and services are, on average, 4% less expensive in St. George than they are across the country. In addition, property tax rates are about half what they are on average nationwide.
City residents spend an average of only 15 minutes commuting to work, far less time than most American city dwellers. When they are not working, St. George residents can choose from a range of entertainment and cultural venues. City residents have easy access to a higher than average concentration of fitness and recreation centers, movie theatres, museums, and golf courses.
[wallst_email_signup]
41. Edmond, Oklahoma
> Population: 90,090
> Median home value: $232,500
> Poverty rate: 9.3%
> Pct. with at least a bachelor’s degree: 52.5%
Over the last decade, Edmond’s population has expanded by 25.7%, far more rapidly than the typical population growth rate nationwide. Economic opportunity, a major reason many people move, likely explains the population boom in Edmond.
The typical area household earns $73,885 annually, about $25,000 more than the statewide median income. In addition to higher incomes, a dollar goes relatively far in Edmond as goods and services are roughly 17% cheaper in the city than they are on average across the country. The local public school system, two local hospitals, and the University of Central Oklahoma are major employers in the city. Only 2.8% of the city’s workforce is out of a job, one of the smallest annual jobless rates of any U.S. city.
40. Appleton, Wisconsin
> Population: 75,255
> Median home value: $137,700
> Poverty rate: 13.1%
> Pct. with at least a bachelor’s degree: 31.6%
Though the median income in Appleton is slightly lower than it is in across the state of Wisconsin, the small city, just north of Lake Winnebago, has plenty to offer its 75,000 residents. A relatively safe place, Appleton’s violent crime rate is well below both the corresponding state and nationwide rates. Appleton’s economy is also relatively healthy as only 4.1% of the workforce is unemployed, a smaller share than in Wisconsin and the country.
[in-text-ad]
Appleton residents have plenty of cultural and entertainment venues to choose from. The city has a higher concentration of bars, restaurants, and museums than all but a handful of other U.S. cities.
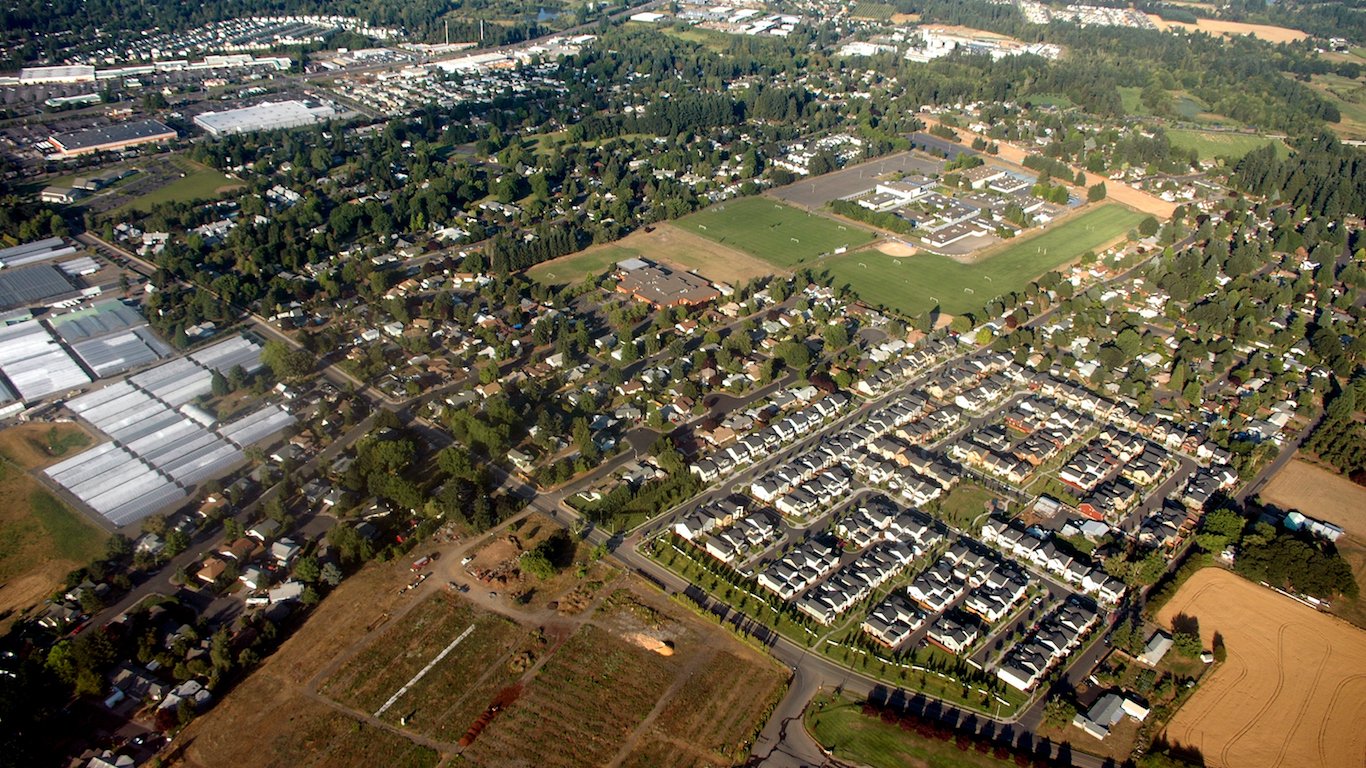
39. Hillsboro, Oregon
> Population: 102,360
> Median home value: $276,600
> Poverty rate: 12.0%
> Pct. with at least a bachelor’s degree: 40.0%
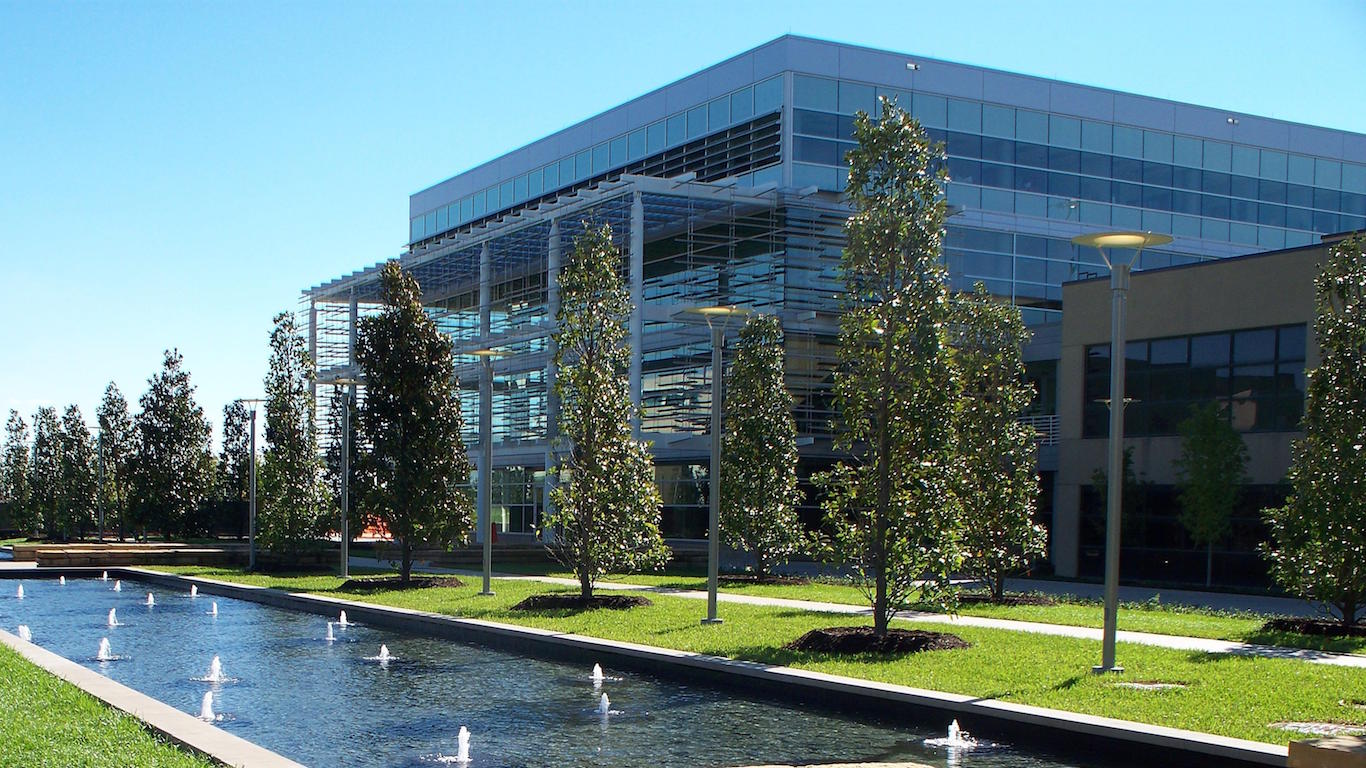
Hillsboro’s unemployment rate of 4.6% is lower than both the 5.7% statewide and 5.3% national unemployment rates. One of the largest employers in the area is semiconductor manufacturer Intel, which recently expanded its Ronler Acres campus in Hillsboro. The flourishing technology industry likely contributes to the high median household income in the city, which at $72,242 a year is among the highest in Oregon.
Located a short commute from Portland, Hillsboro residents can enjoy the amenities of a larger city without the higher real estate costs. The price of a typical Portland home is $348,300, approximately $72,000 more than the price of a typical Hillsboro home.
[recirclink id=358027]
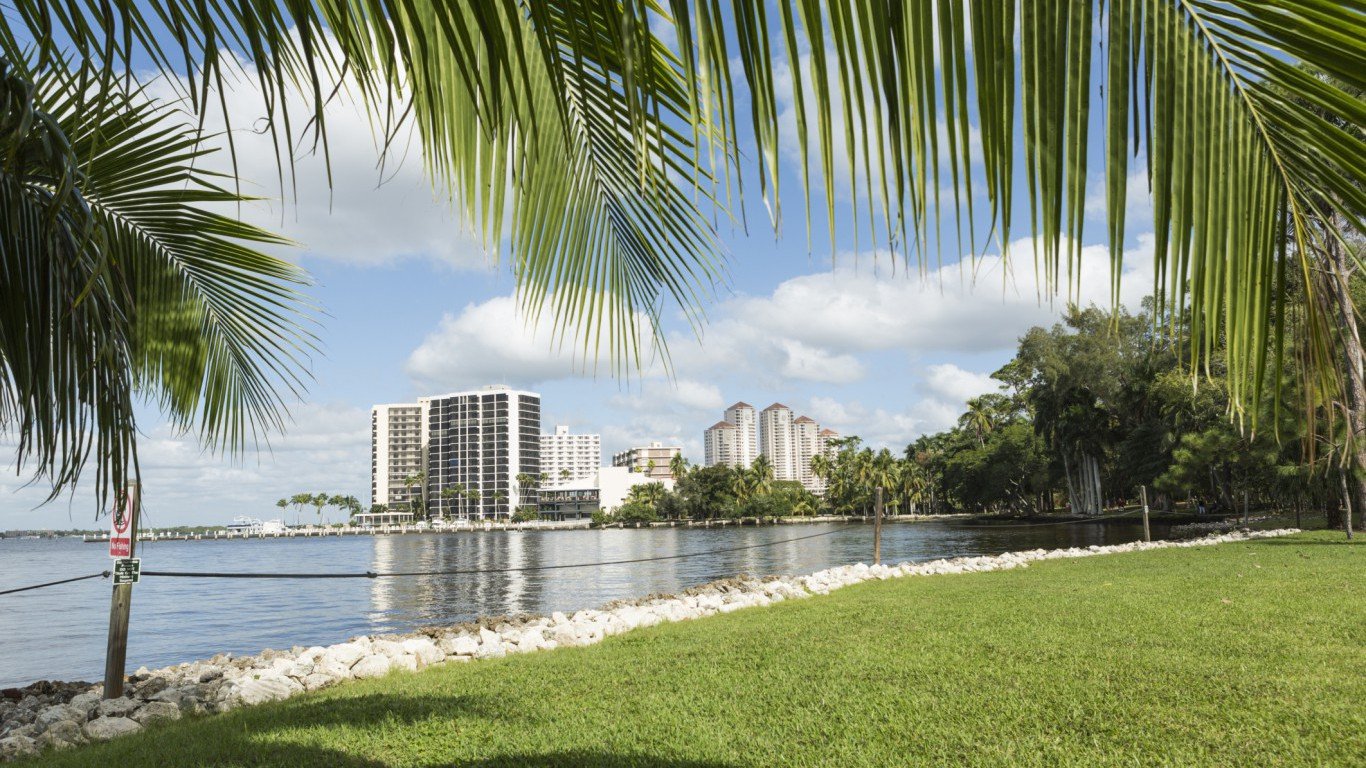
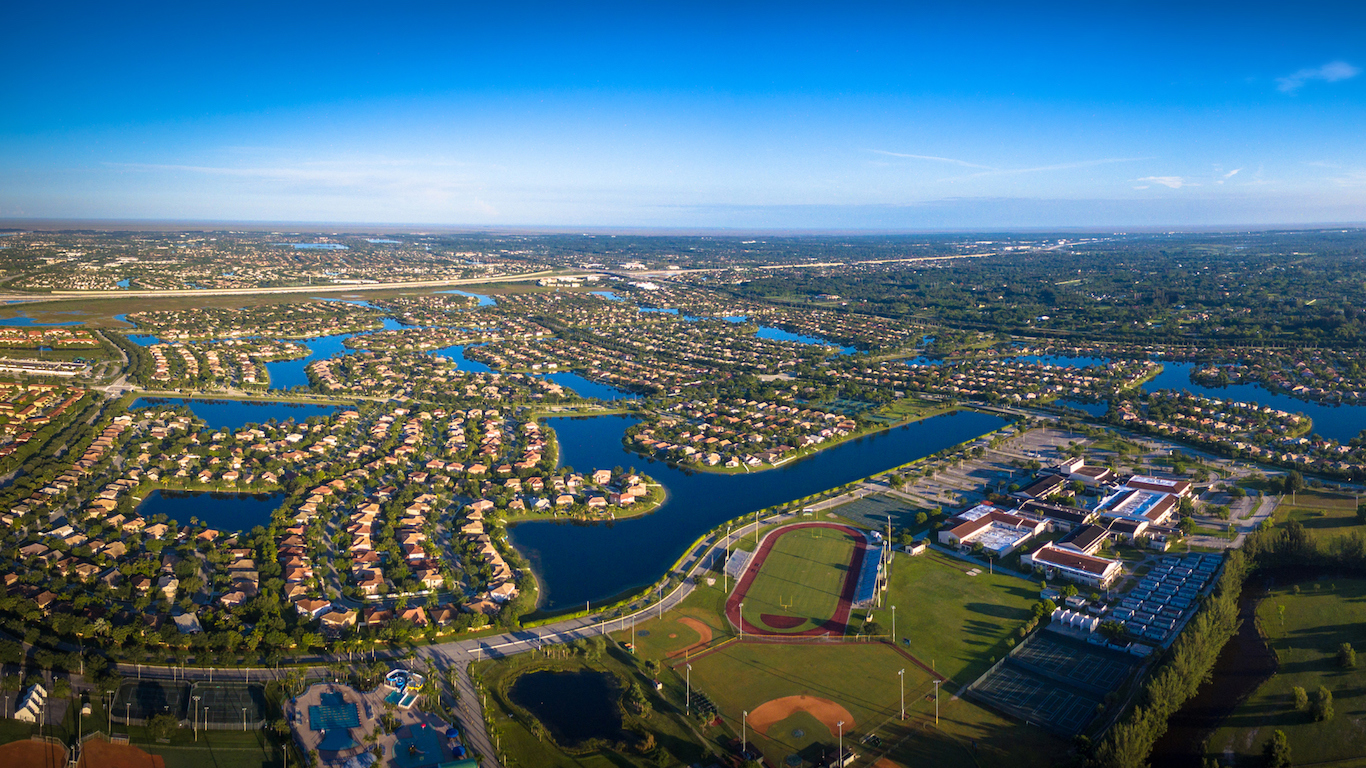
38. Cape Coral, Florida
> Population: 175,230
> Median home value: $189,900
> Poverty rate: 14.3%
> Pct. with at least a bachelor’s degree: 22.9%
The Cape Coral population has grown by 30.4% over the past decade, nearly three times the pace of the national 10-year growth rate. Many of those flocking to Cape Coral likely moved for a job. Between 2013 and 2015, the number of jobs in the Cape Coral increased by 9.2%, more than in nearly every other U.S. city.
Those moving to Cape Coral may also be attracted by its numerous amenities. Cape Coral residents have access to a high concentration of golf courses and marinas. Known as the “Waterfront Wonderland,” Cape Coral has over 400 miles of canals, more than any other city in the world. A majority of the extensive canal system is navigable and provides seafaring residents access to a wealth of waterfront restaurants, bars, and shops.
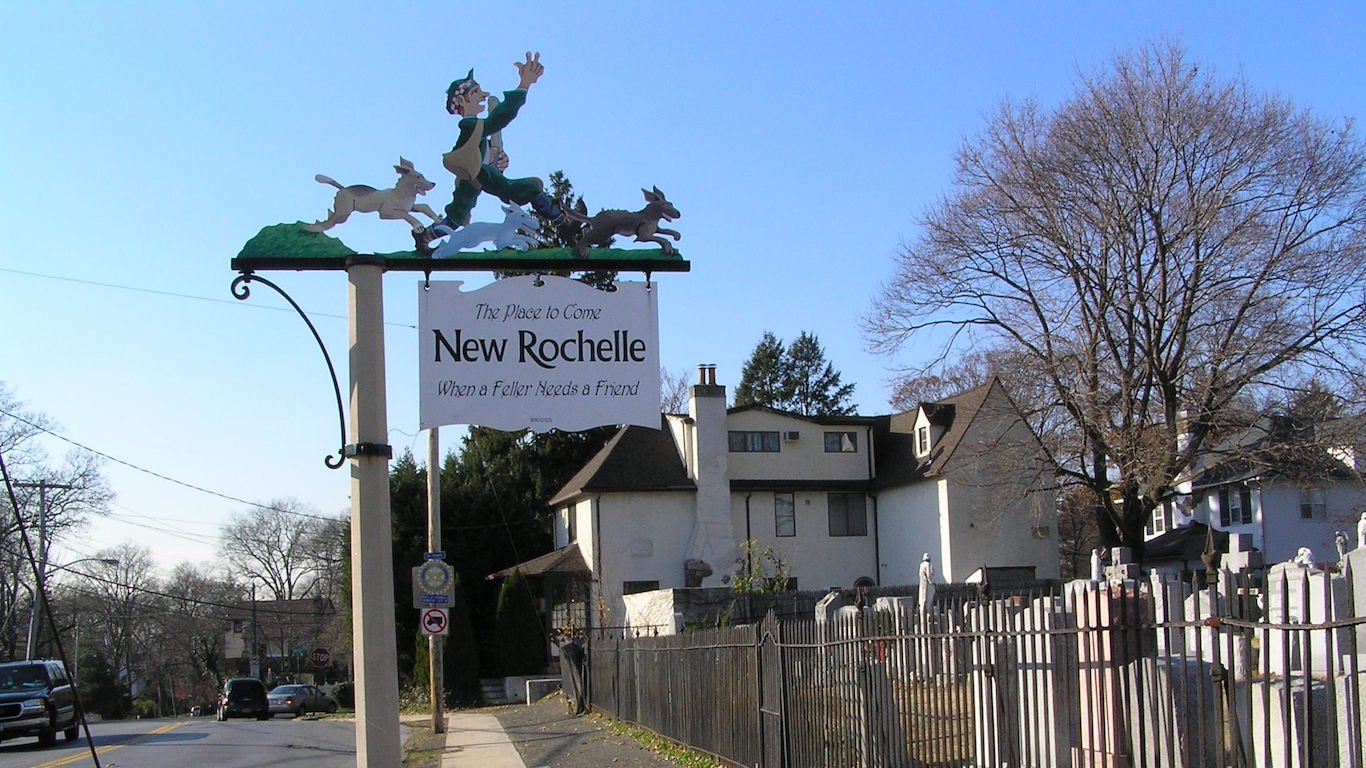
37. New Rochelle, New York
> Population: 79,838
> Median home value: $571,800
> Poverty rate: 11.5%
> Pct. with at least a bachelor’s degree: 45.6%
A 30 minute train ride from Manhattan, residents of New Rochelle can enjoy the countless attractions of New York City without the danger of living in a large metropolis. There were 586 violent crimes per 100,000 residents in New York City in 2015, while the violent crime rate in New Rochelle was just 213 incidents per 100,000 residents.
New Rochelle is economically diverse. While New Rochelle is home to some of the wealthiest neighborhoods in the country, the city also has pockets of low-income households and considerable needs for affordable housing. Overall, the median household income in New Rochelle of $76,496 a year is higher than the $60,850 median annual household income statewide.
[nativounit]
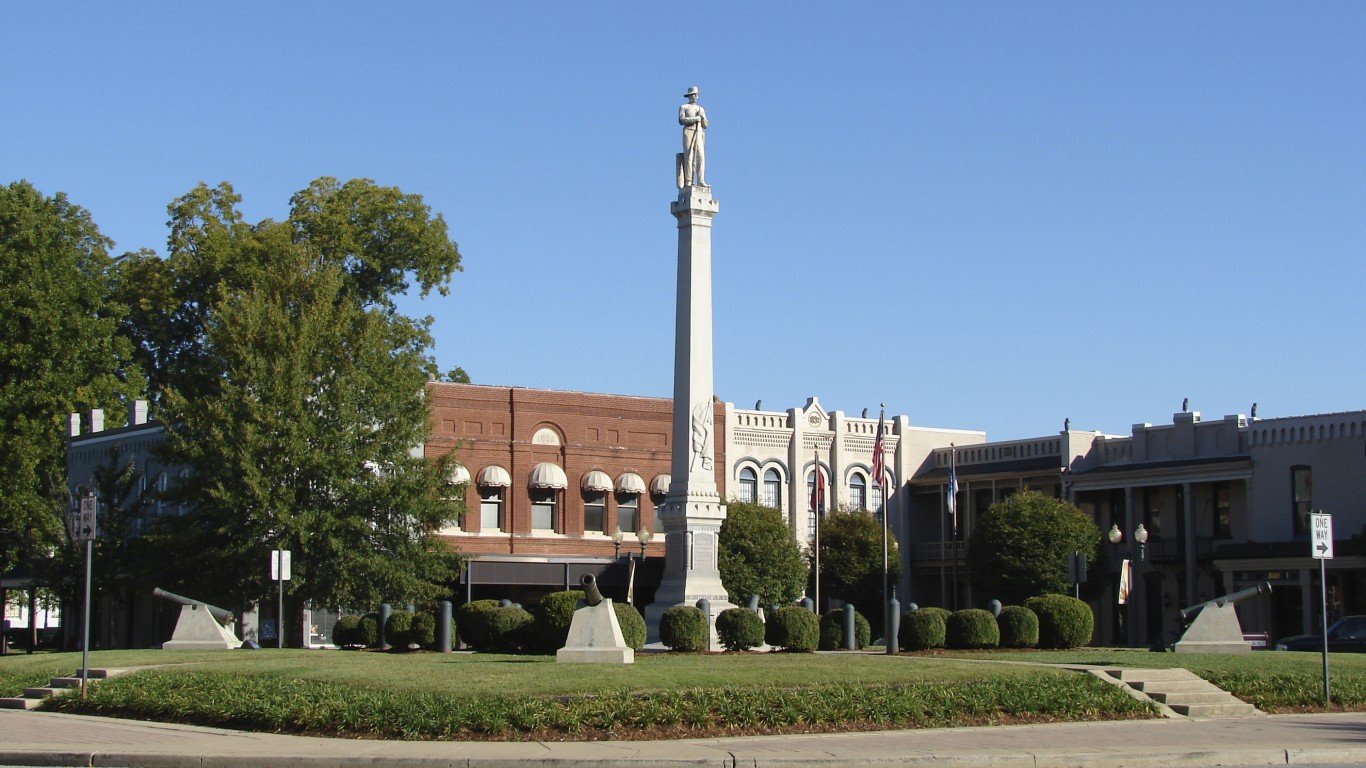
36. Franklin, Tennessee
> Population: 72,635
> Median home value: $347,700
> Poverty rate: 8.7%
> Pct. with at least a bachelor’s degree: 57.7%
Franklin has long been one of the wealthiest cities in Tennessee. The typical household in the city earns $91,786 a year, nearly twice the $47,275 median annual household income statewide. A battleground during the Civil War, Franklin is home to a number of historic sites and museums. It also has a high concentration of other attractions, including restaurants and fitness centers.
Located a short distance from Nashville, most Franklin residents commute outside of the city for work. Franklin is also one of the fastest growing economies in Tennessee. The number of jobs in the city grew 4.9% between 2013 and 2015, outpacing all nearly every city in the state. The largest employers in the city are Community Health Systems and Nissan, both of which added jobs over the decade.
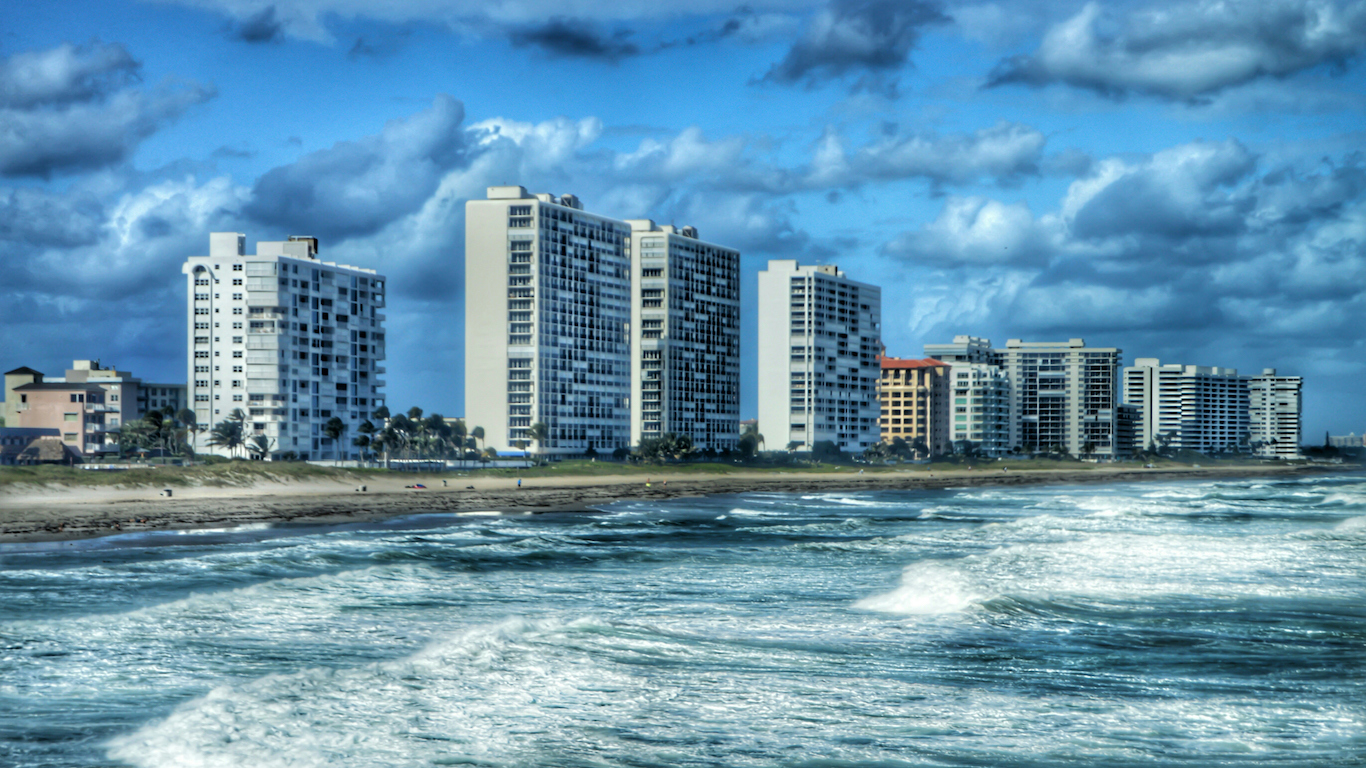
35. Boca Raton, Florida
> Population: 93,226
> Median home value: $402,100
> Poverty rate: 10.2%
> Pct. with at least a bachelor’s degree: 53.9%
Boca Raton is an affluent and safe city on the Atlantic Coast of Florida. It is also a popular retirement destination for many older Americans. The typical household earns $71,678 annually, far more than the $55,775 national annual median household income. Over the last five years, the city’s population grew by 10.2%, more than double the U.S. population growth rate over that time. As the baby boom generation ages, Boca Raton will likely continue its rapid expansion.
[in-text-ad]
Boca Raton has also taken efforts to maintain a certain aesthetic. For example the city’s strict zoning codes does not permit outdoor car dealerships. Additionally, many of the buildings are designed with Mediterranean and Spanish colonial influence, the dominant architectural style during the city’s first wave of growth in the 1920s.
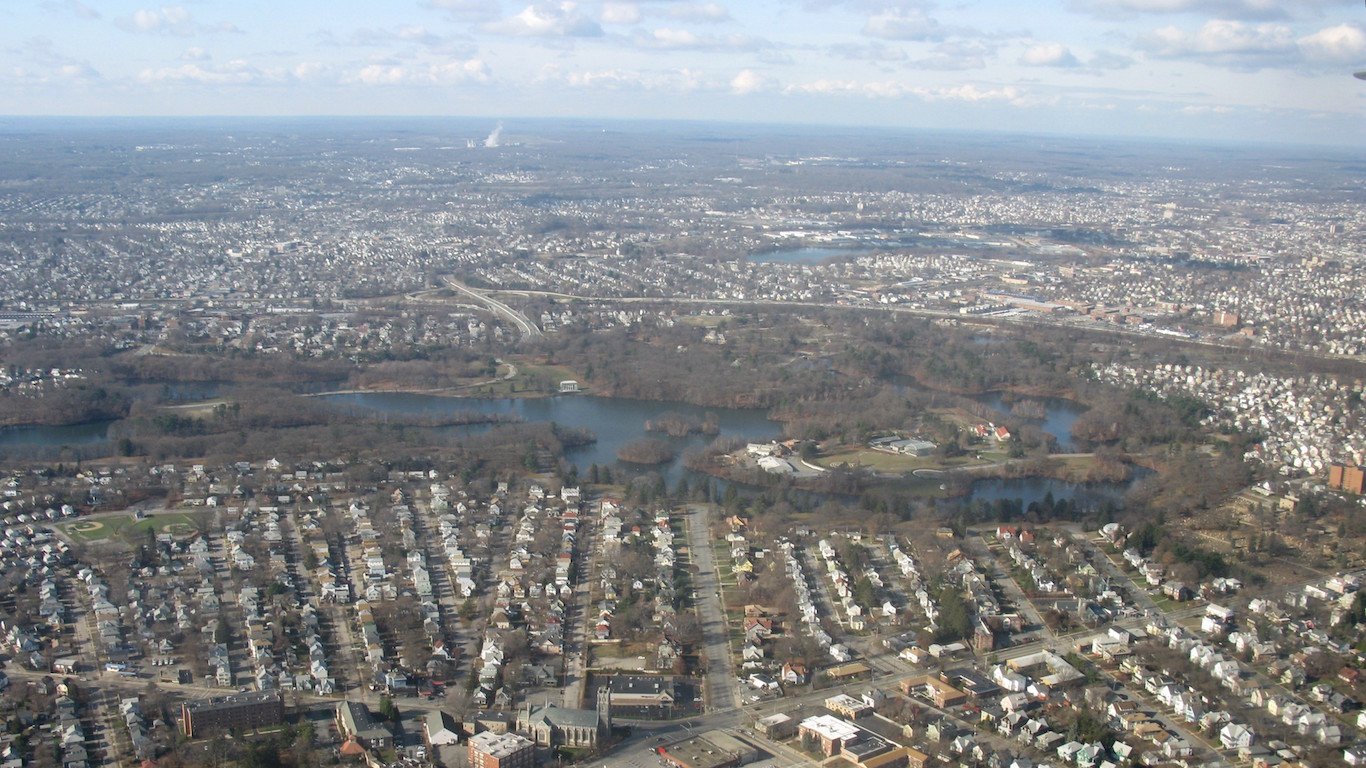
34. Cranston, Rhode Island
> Population: 81,077
> Median home value: $223,300
> Poverty rate: 10.8%
> Pct. with at least a bachelor’s degree: 32.2%
Cranston is the most livable city in Rhode Island and one of the most livable in New England. City residents can take advantage of cultural venues in neighboring Providence, the largest city in the state, while enjoying some better living conditions in their home city. The violent crime rate in Cranston is only a quarter of the rate in Providence. Also, with a lower unemployment rate, working-age adults in Cranston are more likely to be gainfully employed than their counterparts in Providence.
Salaries are also relatively high among Cranston residents. The typical household earns nearly $62,000 a year, about $4,000 more than the statewide median income. High salaries in the city help to offset the area’s high cost of living.
[wallst_email_signup]
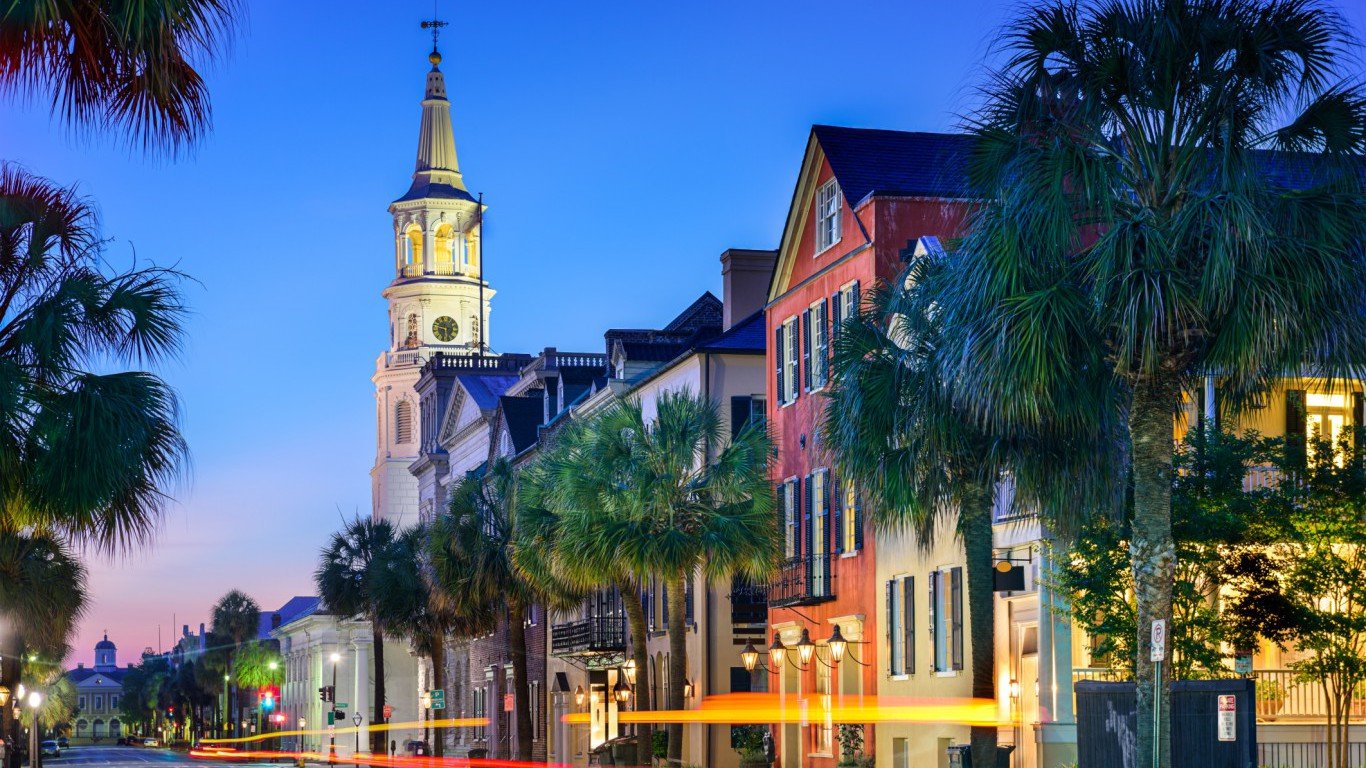
33. Charleston, South Carolina
> Population: 135,524
> Median home value: $293,500
> Poverty rate: 12.5%
> Pct. with at least a bachelor’s degree: 50.2%
Americans who prefer inexpensive housing and warm climates often relocate to the Southeast. Charleston’s population has increased by 13.1% over the past five years, more than three times the national five-year growth rate. Many new residents are likely attracted by the low cost of real estate in the city. Housing in Charleston is 20% cheaper than the national average. Charleston also has a warm, temperate climate, and the air quality is close to the best of any major city.
While Charleston is tourist friendly, with some of the most restaurants, museums, and hotels per capita in the country, the city also has a strong talent pool and manufacturing sector. More than 50% of all Charleston adults have at least a bachelor’s degree, a larger share than the 31% national attainment rate. The city also has a booming aviation sector that includes a Boeing facility and a U.S. Air Force base and contributes $13.8 billion to the region’s economy annually.
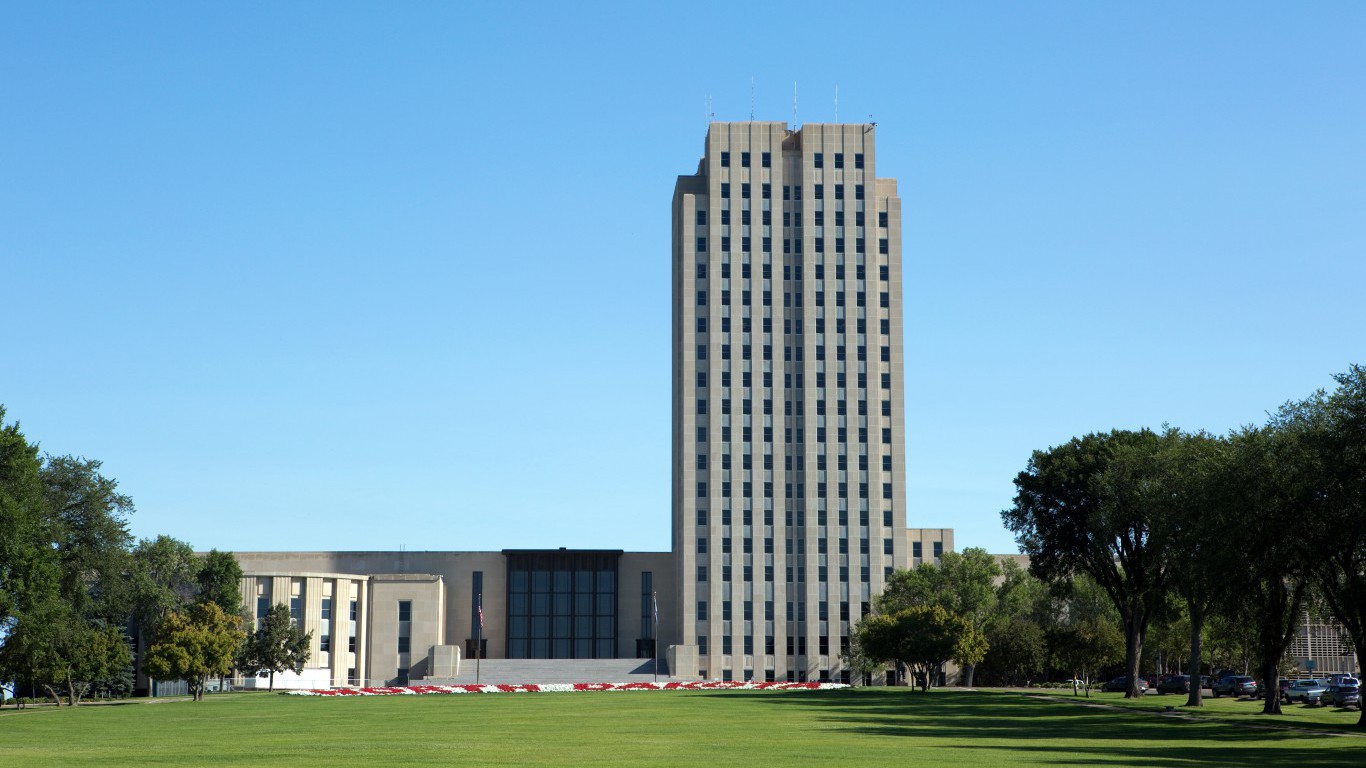
32. Bismarck, North Dakota
> Population: 70,240
> Median home value: $225,600
> Poverty rate: 12.9%
> Pct. with at least a bachelor’s degree: 35.1%
The typical Bismarck household earns $57,596 annually, less than the income of a typical North Dakota household of $60,557 a year. When adjusted for Bismarck’s low cost of living, however, the city’s median household income rises by approximately $8,000. Housing in Bismarck is about 45% less expensive than it is on average across the country.
North Dakota’s economy heavily relies on oil production. With the price of oil falling in recent years, the state’s economy has suffered too. Bismarck’s economy, however, has been more resilient, maintaining moderate growth and low unemployment. Just 2.3% of the city’s workforce is unemployed, lower than the respective 2.7% and 5.3% state and national unemployment rates.
[nativounit]
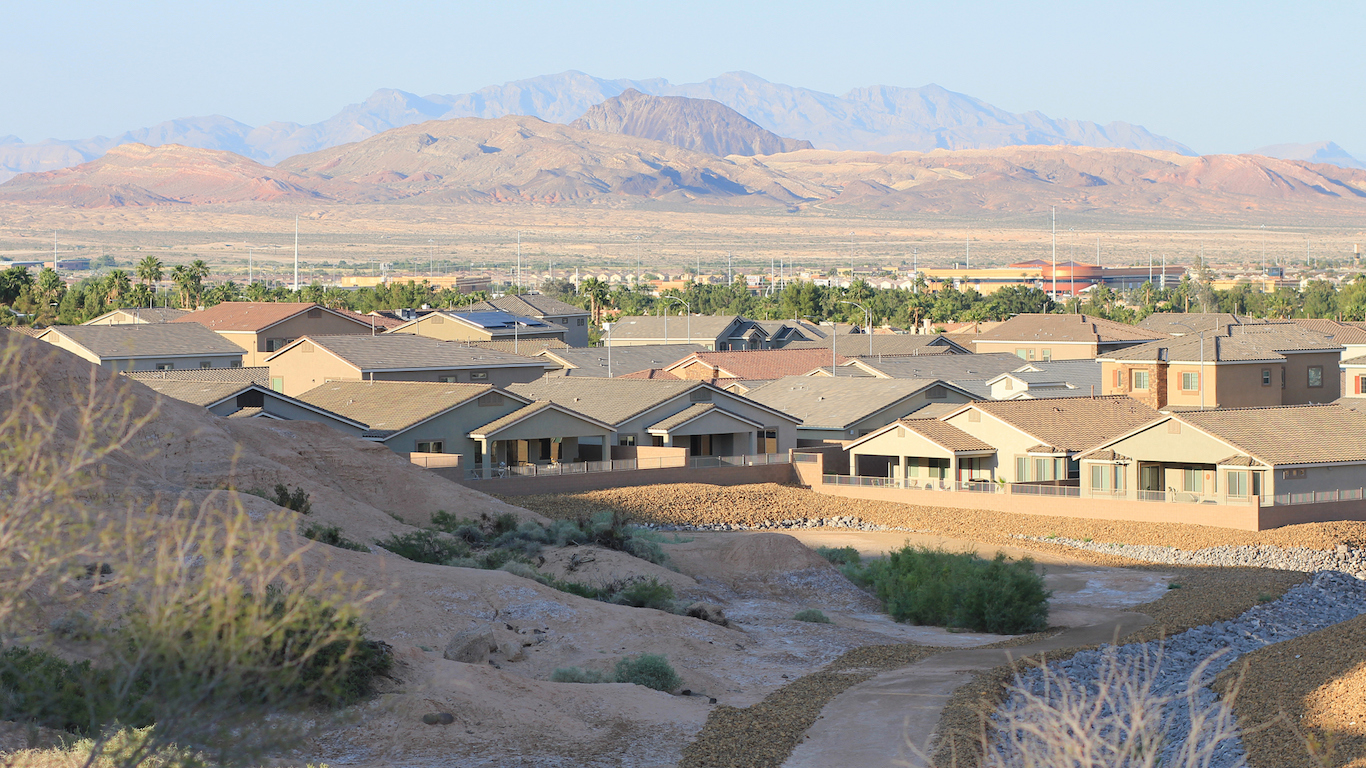
31. Henderson, Nevada
> Population: 285,658
> Median home value: $273,800
> Poverty rate: 8.5%
> Pct. with at least a bachelor’s degree: 31.3%
Henderson’s 27.7% population growth rate in the past decade is one of the most dramatic booms in the country. Population growth is often — at least partially — attributable to businesses locating to the city. Due to a business-friendly tax climate, multiple companies and employers, including Ocean Spray and Levi Strauss and Company, have set up operations in Henderson. Between 2013 and 2015, employment in Henderson grew by 7.6%, more than all but a few U.S. cities.
Quality of life in Henderson is partially made possible by high incomes. The typical area household earns $64,035 a year, nearly $12,000 more than the statewide median income. Poverty is also scarce in Henderson. Only 8.5% of city residents live below the poverty line, the lowest poverty rate of any city in the state, and well below the 14.7% national poverty rate.

30. Clifton, New Jersey
> Population: 86,341
> Median home value: $331,800
> Poverty rate: 10.9%
> Pct. with at least a bachelor’s degree: 27.3%
Clifton is one of the best cities to live in the country, at least in part due to its accessibility. There are 11 airports within a reasonable distance of the northern New Jersey city, while most cities have no more than five within reasonable distance. City residents also have substantial access to public transportation.
[in-text-ad]
Clifton is located within commuting distance of New York City, and residents benefit from the jobs and cultural attractions that come from living near a major city. Even without traveling to NYC, Clifton is rich with restaurants, bars, and movie theaters. Perhaps evidence of the quality of life in Clifton, the city’s population has exploded over the past 10 years, increasing by 18.8% compared to the 11.5% U.S. population growth over the same period.
29. Pembroke Pines, Florida
> Population: 166,624
> Median home value: $249,500
> Poverty rate: 5.2%
> Pct. with at least a bachelor’s degree: 37.0%
With the Everglades to the west, Fort Lauderdale to the north, and Miami to the south, Pembroke Pines residents have access to a range of outdoor activities and other amenities. Average temperatures in Pembroke Pines range from about 68 degrees Fahrenheit in the winter months to 83 degrees in the summer, a climate likely considered by many residents an advantage to living in the area.
While the typical household in the city earns more than the typical household nationwide, after adjusting for cost of living, household income levels in Pembroke Pines fall well below national levels. Though living in Pembroke Pines is not cheap, it is relatively safe. Approximately 221 violent crimes were reported last year per 100,000 residents, far less than the 462 violent crimes reported per 100,000 residents across Florida.
[nativounit]
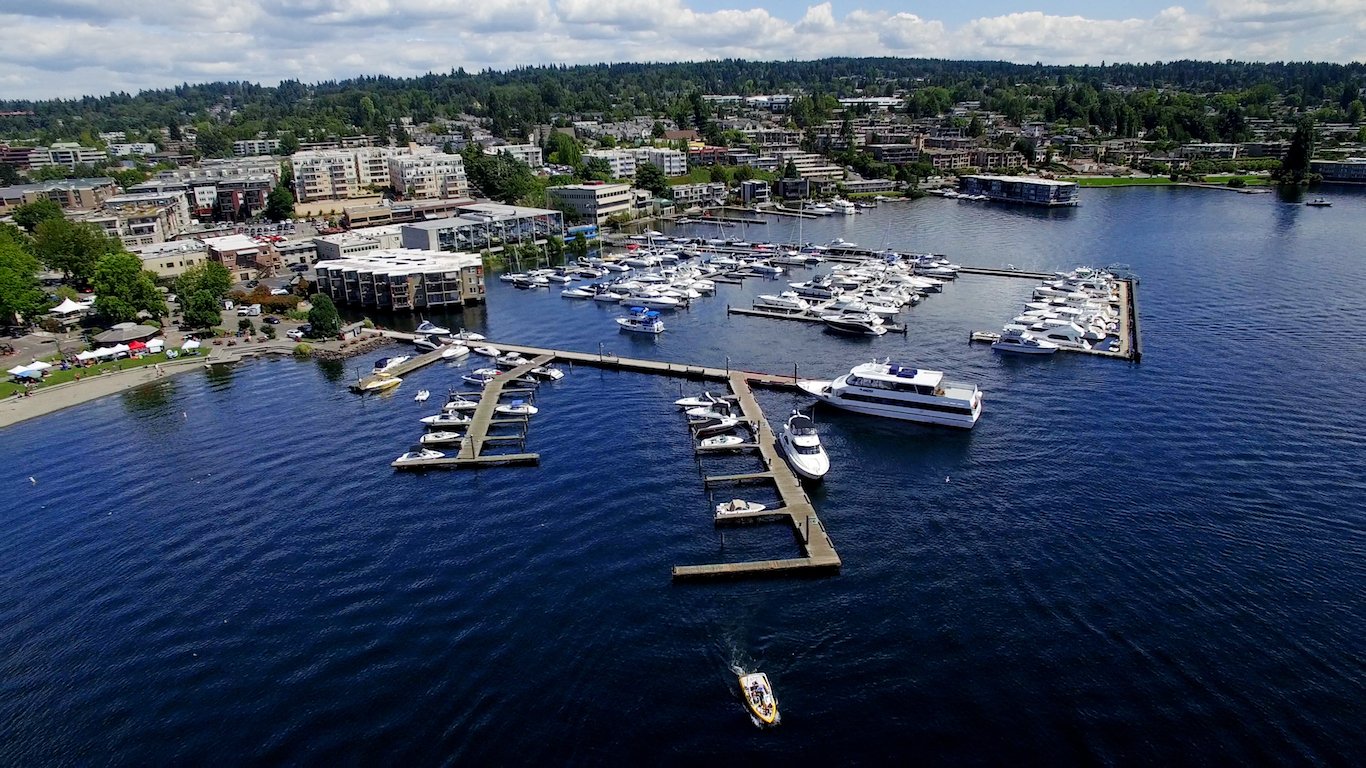
28. Kirkland, Washington
> Population: 87,267
> Median home value: $529,200
> Poverty rate: 6.3%
> Pct. with at least a bachelor’s degree: 58.3%
Financially well-off people are not necessarily the most satisfied with their cities. However, high incomes usually ensure that at least basic necessities are met and are a strong indication of regional economic health. High incomes also tend to accompany other desirable social measures. This appears to be the case in Kirkland, Washington. Even after adjusting for the relatively high cost of living, the typical household in the city earns more than $100,000 annually, nearly double the national median household income.
Even among the nation’s best cities, most report more than 100 violent crimes for every 100,000 people in a year. Kirkland’s violent crime rate, at 89 per 100,000 residents, is exceptionally low and in stark contrast with the national violent crime rate of 373 incidents per 100,000 U.S. residents.
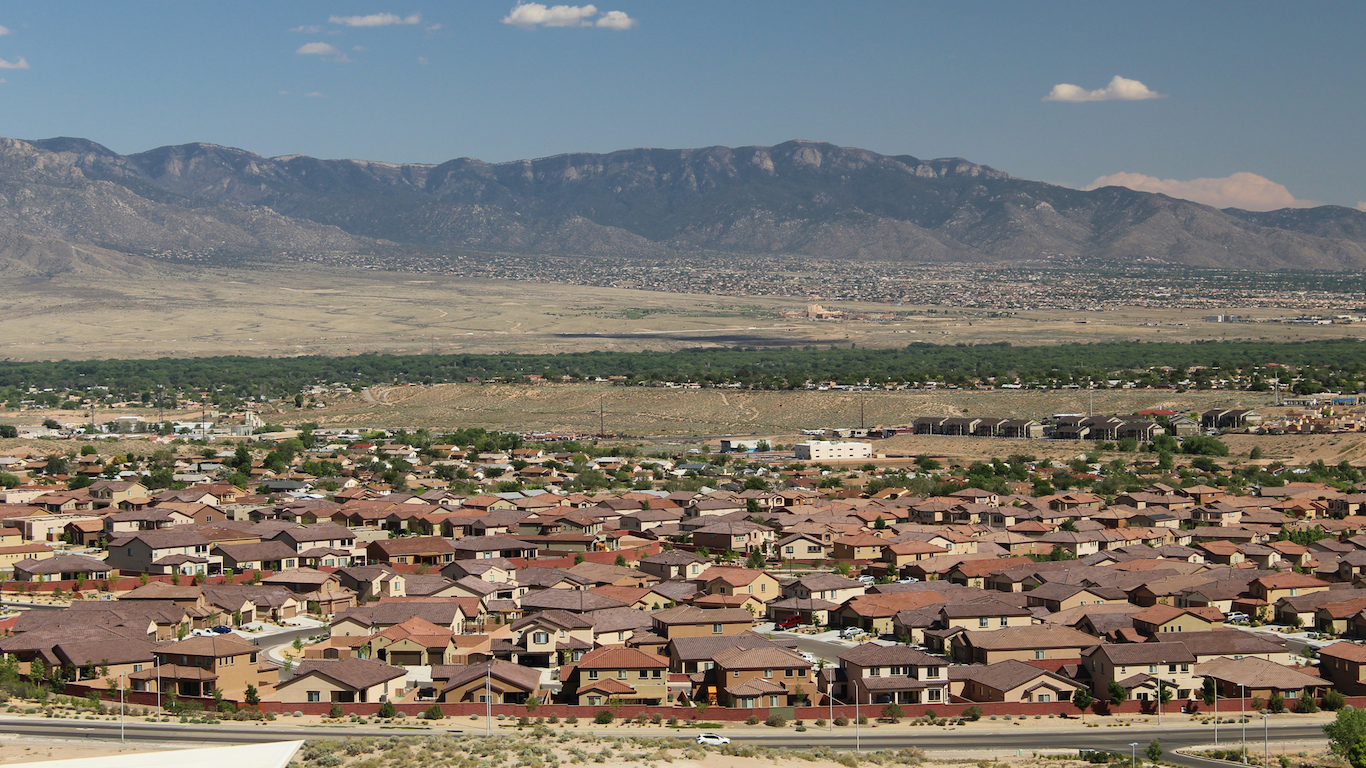
27. Rio Rancho, New Mexico
> Population: 94,155
> Median home value: $180,900
> Poverty rate: 8.7%
> Pct. with at least a bachelor’s degree: 29.2%
Rio Rancho’s population growth rate of nearly 50% over the 10 years through 2015 is considerably faster than the 10-year national population growth rate of 11.5%. Such growth can usually be attributed to a thriving job market. However, employment growth in Rio Rancho has slowed in recent years. The number of jobs in the city grew by just 1.5% from 2013 through last year, slower than the nationwide employment growth of 4.0% over that period. Similarly, unlike most of the cities on this list, the unemployment rate of 6.1% is higher than the annual national rate.
However, Rio Rancho still has plenty of economic advantages. The poverty rate of 8.7%, for example, is well below the national rate and less than half the New Mexico rate. Also, while affordable neighborhoods are frequently located in relatively poor areas, Rio Rancho is both wealthy and relatively affordable.
[recirclink id=359008]
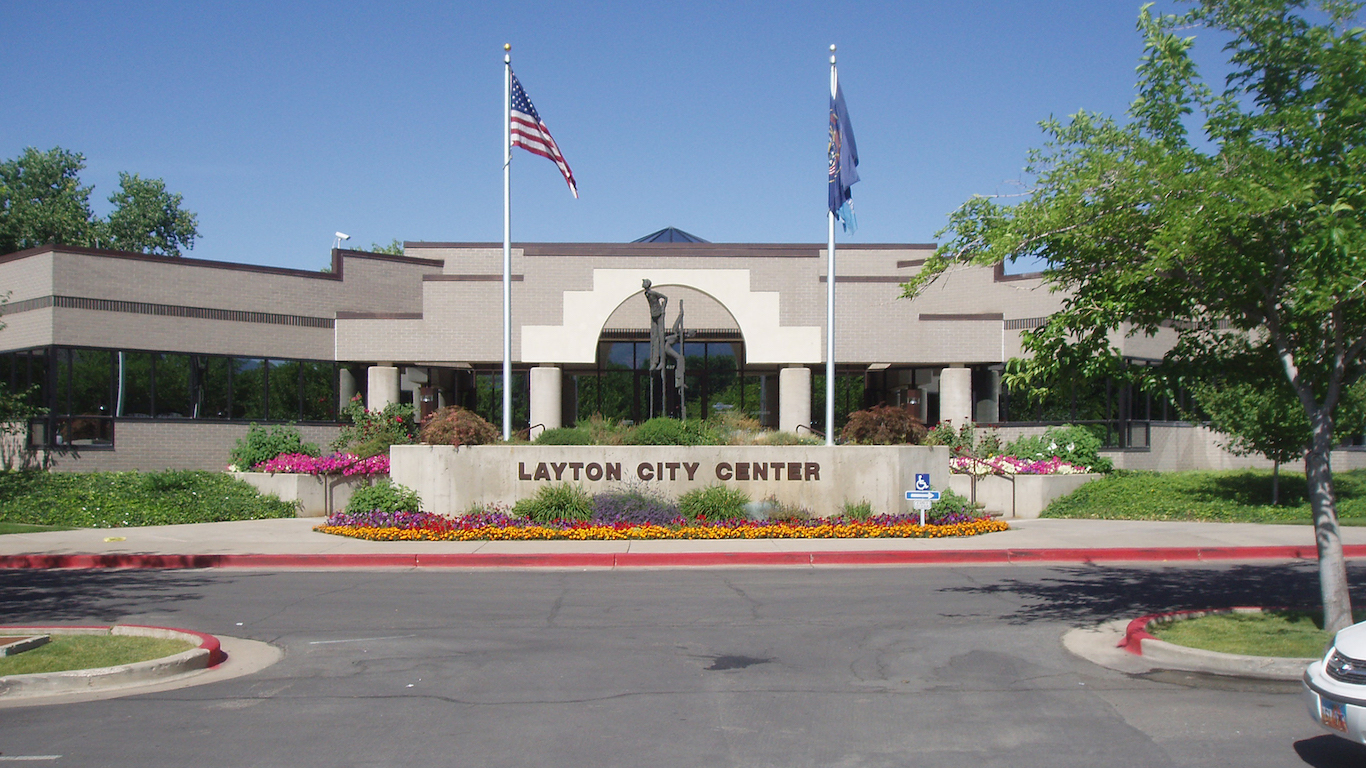
26. Layton, Utah
> Population: 74,142
> Median home value: $220,000
> Poverty rate: 9.7%
> Pct. with at least a bachelor’s degree: 29.5%
Layton residents live within commuting distance of Salt Lake City, giving them easy access to the cultural amenities of the largest city in the state without the higher cost of living or the higher crime rates.
In the last half decade, population growth in Layton has outpaced that of every other city in Utah with the exception of St. George. The city’s five-year 9.7% population growth rate is nearly three times the national population growth rate over the same time period.
25. Nashua, New Hampshire
> Population: 87,975
> Median home value: $245,200
> Poverty rate: 10.8%
> Pct. with at least a bachelor’s degree: 35.0%
Nashua is the most livable city in New Hampshire and the third most livable in New England. Situated in Hillsborough County near the Massachusetts state border, Nashua residents have access to a greater concentration of outdoor recreation venues such as golf courses, ski resorts, and nature parks than most Americans.
[in-text-ad]
Like many cities in the region, Nashua is rarely affected by extreme weather events and natural disasters.

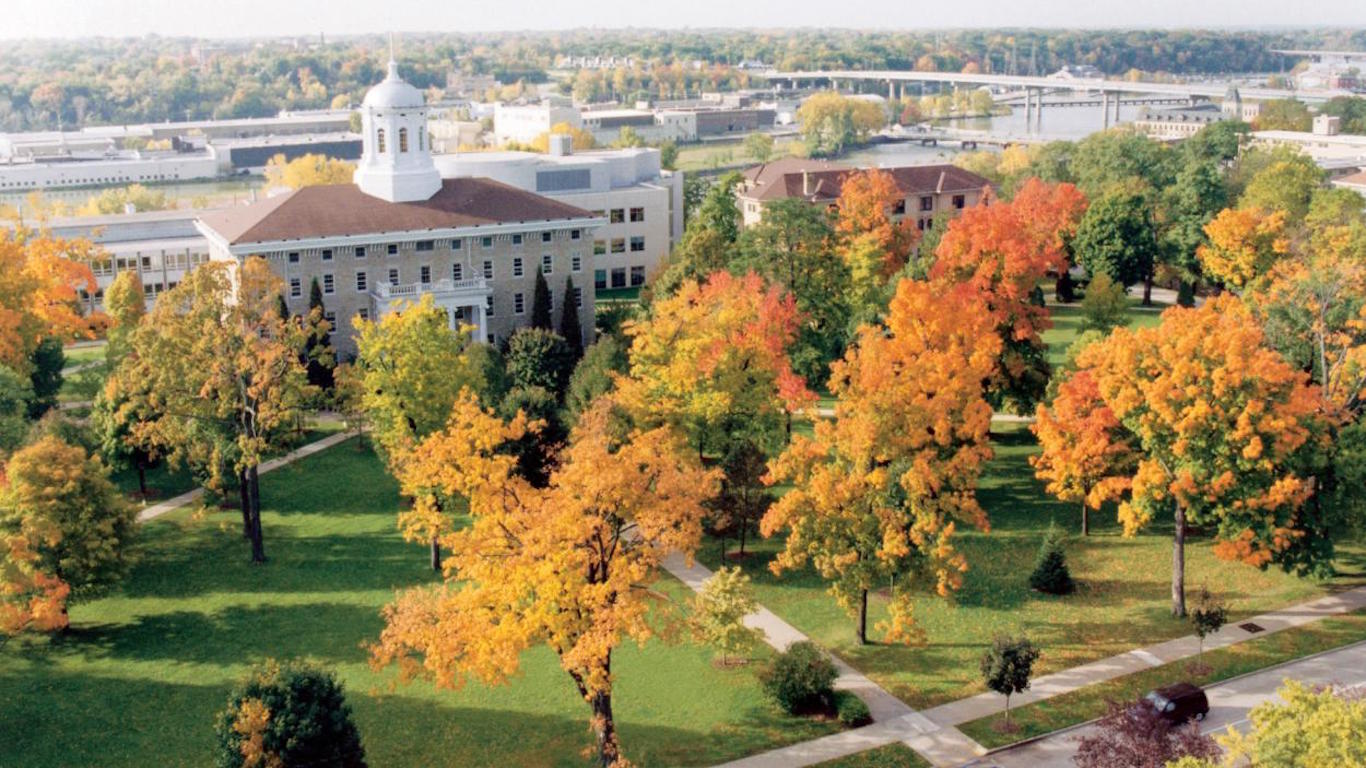
24. Waukesha, Wisconsin
> Population: 71,976
> Median home value: $197,900
> Poverty rate: 9.2%
> Pct. with at least a bachelor’s degree: 35.9%
In general, Waukesha residents are doing well financially. While the cost of goods and services in the area is comparable with the average cost of living nationwide, the typical city household earns $60,734 annually, about $5,000 more than median household income nationwide. Poverty is also relatively uncommon in Waukesha, with 9.2% of city residents living in poverty compared to 14.7% of Americans nationwide.
Waukesha residents have access a number of recreational and leisure amenities nearby, including a high concentration of bars, movie theaters and golf courses. Also, Milwaukee, the state’s largest city, is only a short drive away. This gives Waukesha residents access to the cultural amenities of the larger city without having to face its higher crime rates on a daily basis.
[nativounit]
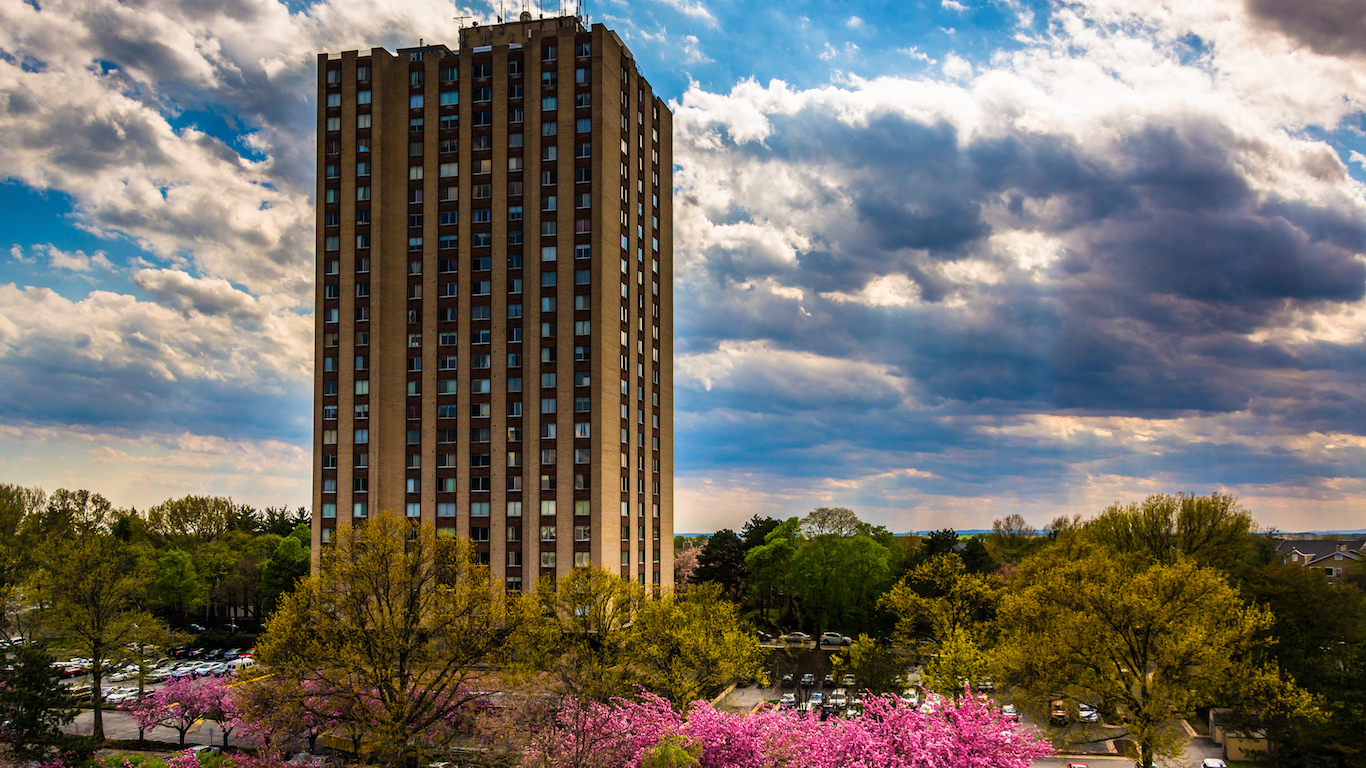
23. Gaithersburg, Maryland
> Population: 67,445
> Median home value: $356,800
> Poverty rate: 8.2%
> Pct. with at least a bachelor’s degree: 52.4%
The concentration of restaurants in Gaithersburg is twice as high than it is nationwide, and the concentration of fitness and exercise centers is three times as high. While such venues for leisure are perhaps more accessible in Gaithersburg, they are also more expensive — as are housing and other costs. The typical household in the city earns $85,854 annually. Adjusted for the cost of living, which is 25% higher than the national average, household income falls to $68,848 a year – still considerably higher than the national median household income of $55,775 a year.

22. Virginia Beach, Virginia
> Population: 452,745
> Median home value: $262,900
> Poverty rate: 7.9%
> Pct. with at least a bachelor’s degree: 32.8%
Unlike most of the cities on this list, Virginia Beach is relatively large. Home to more than 450,000 residents, it is the largest city in the state. A coastal city in southern Virginia, Virginia Beach has plenty to offer for leisure and recreation. There are more than 4,000 acres of parks and refuges, a modern art museum, a performing arts venue, and an aquarium.
High incomes in the area offset a relatively high cost of living. The typical Virginia Beach household earns $67,281 a year, about $11,500 more than the typical American household and $1,000 more than the statewide median income.
[wallst_email_signup]
21. Newton, Massachusetts
> Population: 88,809
> Median home value: $809,700
> Poverty rate: 4.3%
> Pct. with at least a bachelor’s degree: 76.6%
More than three-quarters of adults in Newton have at least a bachelor’s degree, high even compared with Massachusetts as a whole — the state’s over 40% college attainment rate is the highest of any state. A college degree is one of the surest paths to a high income, and Newton residents are some of the nation’s wealthiest. Even after adjusting for the city’s relatively high cost of living, the typical household earns $114,201 annually — eighth highest nationwide.
As is common in cities with high-income populations, Newton’s violent crime rate of 83 incidents per 100,000 residents is one of the lowest in the country. It is a fraction of the national violent crime rate of 373 incidents per 100,000 people.
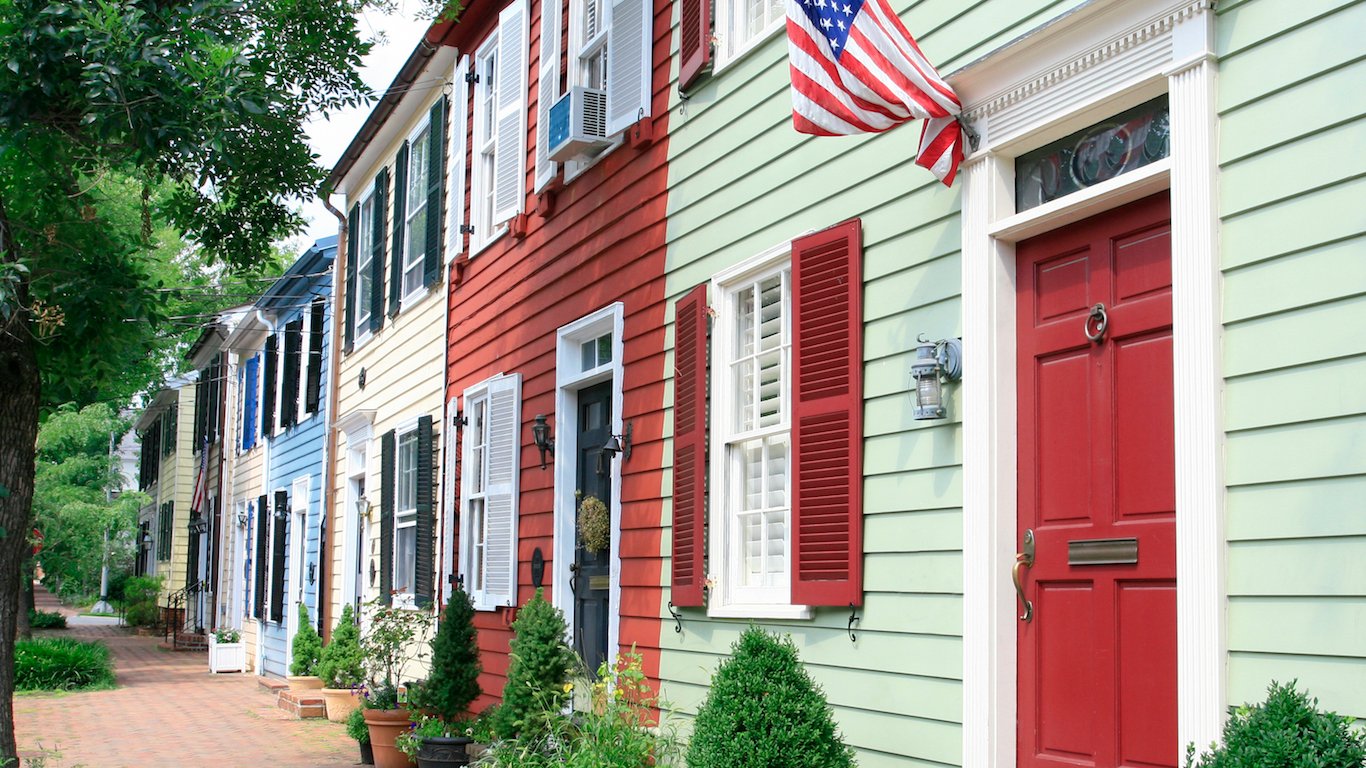
20. Alexandria, Virginia
> Population: 153,511
> Median home value: $541,700
> Poverty rate: 9.1%
> Pct. with at least a bachelor’s degree: 59.8%
Like many of the best cities, Alexandria is located within commuting distance of a major city. While living in safer neighborhoods, Alexandria residents have access to Washington D.C.’s good schools and amenities. The nation’s capital is also home to some of the nation’s highest paying jobs, which likely accounts for the relatively high incomes in Alexandria. Although when adjusting for the cost of living, median household income in the city drops from over $90,000 a year to $65,211 a year, it is still well above the national annual median income.
[in-text-ad]
Alexandria also appears to be an appealing destination for Americans seeking to relocate. Over the five years through 2015, the city’s population growth rate of 8.9% was more than double the national five-year population growth rate of 3.9%.

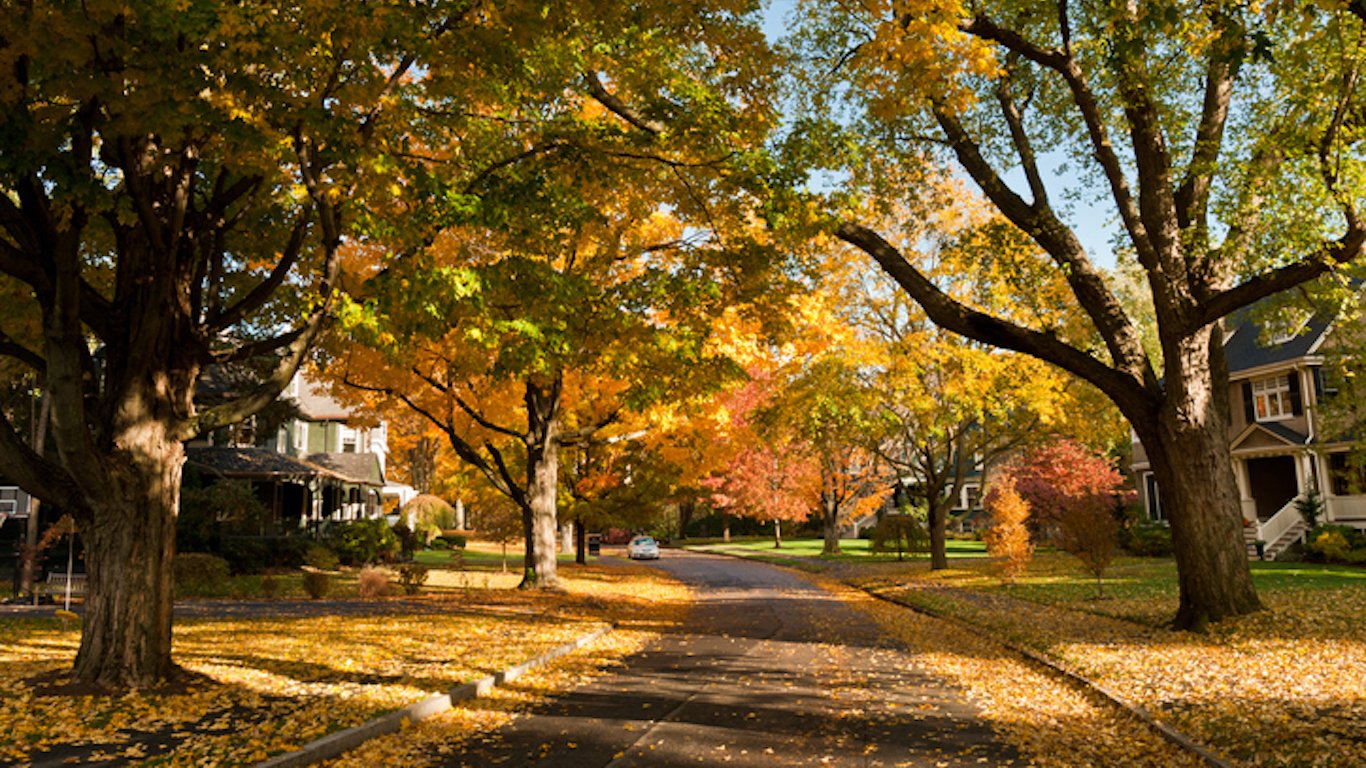
19. Eagan, Minnesota
> Population: 66,288
> Median home value: $260,600
> Poverty rate: 5.8%
> Pct. with at least a bachelor’s degree: 48.6%
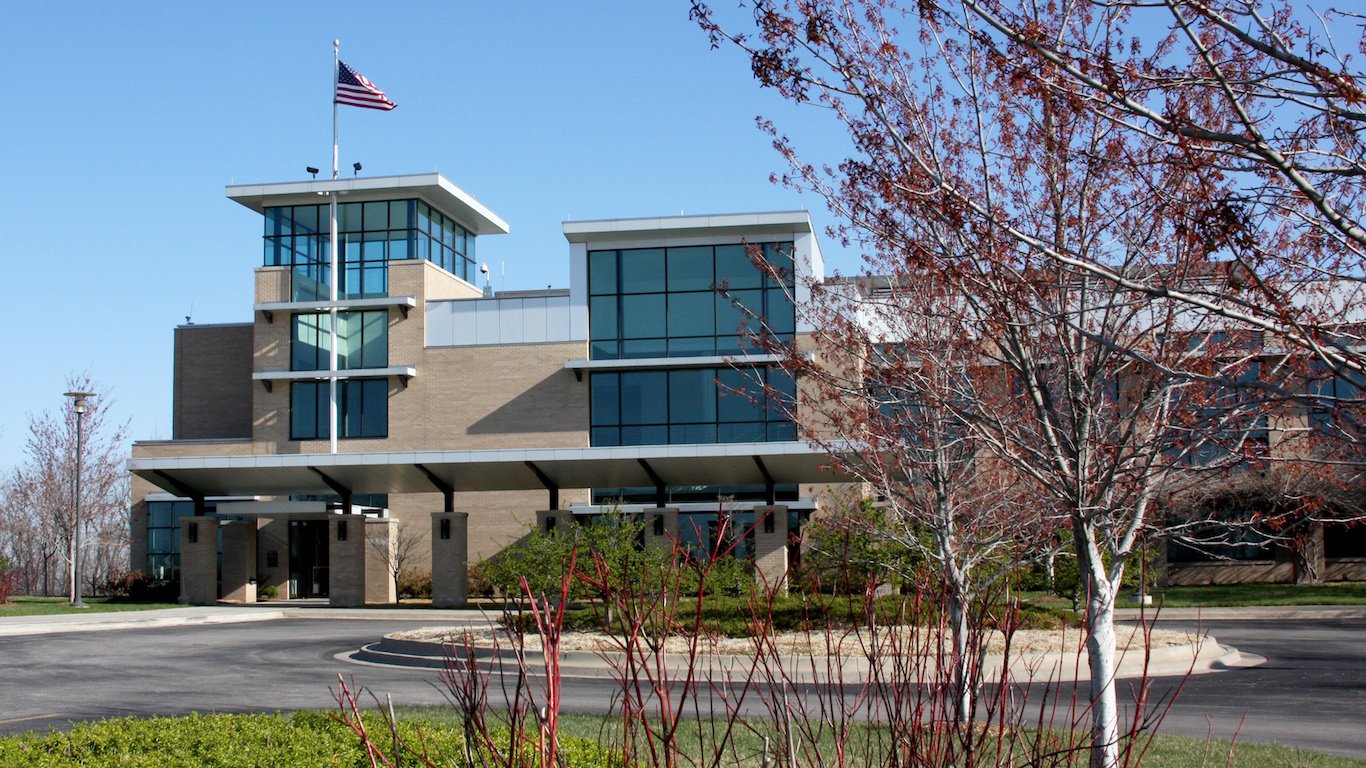
Eagan is a wealthy suburb of St. Paul and Minneapolis. The typical Eagan household earns $78,417 annually, far more than the $63,488 median annual household income across Minnesota. Just 2.9% of the Eagan workforce is unemployed, one of the lowest unemployment rates of any city in the country. Some of the top employers in the area are mass media and information firm Thomson Reuters, health insurance company BlueCross/BlueShield, and the U.S. Postal Service. The three companies together account for nearly 13,000 jobs in Eagan. Many in Eagan likely work in the Twin Cities, located just across the Minnesota River.
While Eagan residents benefit from easy access to the economic opportunities and cultural venues of a large metropolis, they are less exposed to its higher crime rate. Violent crime is nearly 10 times more common in St. Paul and 14 times more common in Minneapolis than it is in Eagan.
[recirclink id=358831]

18. Longmont, Colorado
> Population: 92,221
> Median home value: $282,800
> Poverty rate: 13.9%
> Pct. with at least a bachelor’s degree: 38.4%
Longmont is located along the Front Range, a region in Colorado that contains the state’s largest cities and runs north to south along Interstate 25. The proximity to the Boulder and Denver metropolitan areas allows Longmont residents access to an array of job opportunities. Approximately three in four workers living in Longmont commute outside of the city for work.
While many Longmont residents enjoy the occupational opportunities and amenities of neighboring Boulder, they are spared the high cost of real estate. The price of a typical home in Longmont is $282,800, less than half the price of the typical home in Boulder of $583,600.
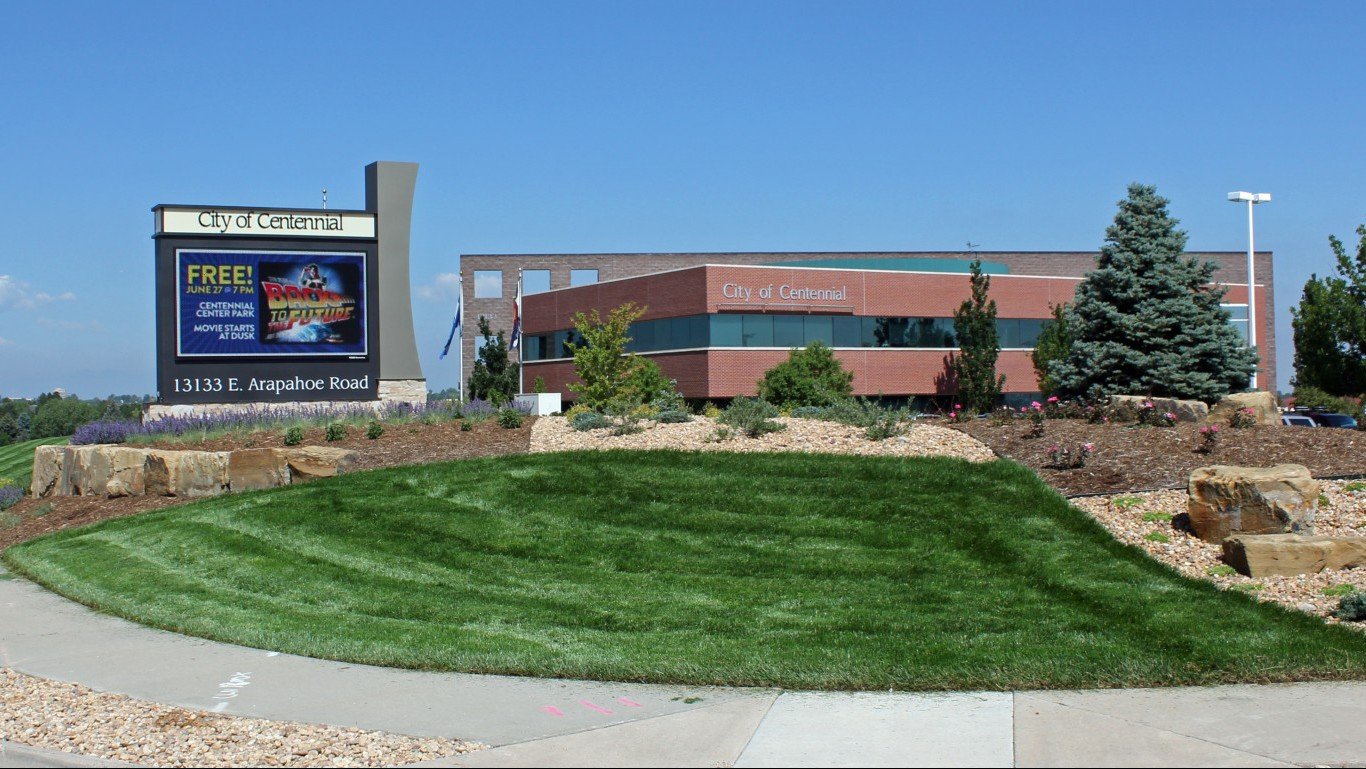
17. Centennial, Colorado
> Population: 109,726
> Median home value: $369,800
> Poverty rate: 3.9%
> Pct. with at least a bachelor’s degree: 55.6%
Residents of Centennial, a midsize city of 110,000 people, enjoy some of the highest quality of life of any U.S. city. Just 3.6% of the Centennial workforce is unemployed, far less than the 5.3% national unemployment rate. Many Centennial residents are likely work in Denver, the largest city in Colorado, which is within commuting distance.
While Centennial lacks the number amenities of its larger neighbor, it is far safer and more affordable. There were 126 violent crimes per 100,000 residents in Centennial in 2015, a fraction of the 674 violent crimes reported per 100,000 Denver residents. In addition lower crime rates, Centennial residents earn higher incomes and enjoy a lower cost of living than their counterparts in the capital city. The difference in housing costs are particularly stark. Centennial residents pay an average of about 3.6% less on housing than the typical American, while in Denver, housing is 27.4% more expensive than the nationwide average.
[nativounit]
16. Danbury, Connecticut
> Population: 84,662
> Median home value: $279,400
> Poverty rate: 14.1%
> Pct. with at least a bachelor’s degree: 29.2%
Danbury residents enjoy plenty of cultural venues and amenities. For every 100,000 city residents, there are 263 restaurants, about 100 more eating options than are available for the average 100,000 Americans. There are also 22 fitness and recreational areas per 100,000 Danbury residents, more than double the national number.
As is the case across Connecticut, Danbury residents are relatively wealthy, but living in the city can be expensive. In fact, Danbury is one of only a handful of the best U.S. cities to live with a the high cost of living — prices are 30% higher than national average prices.
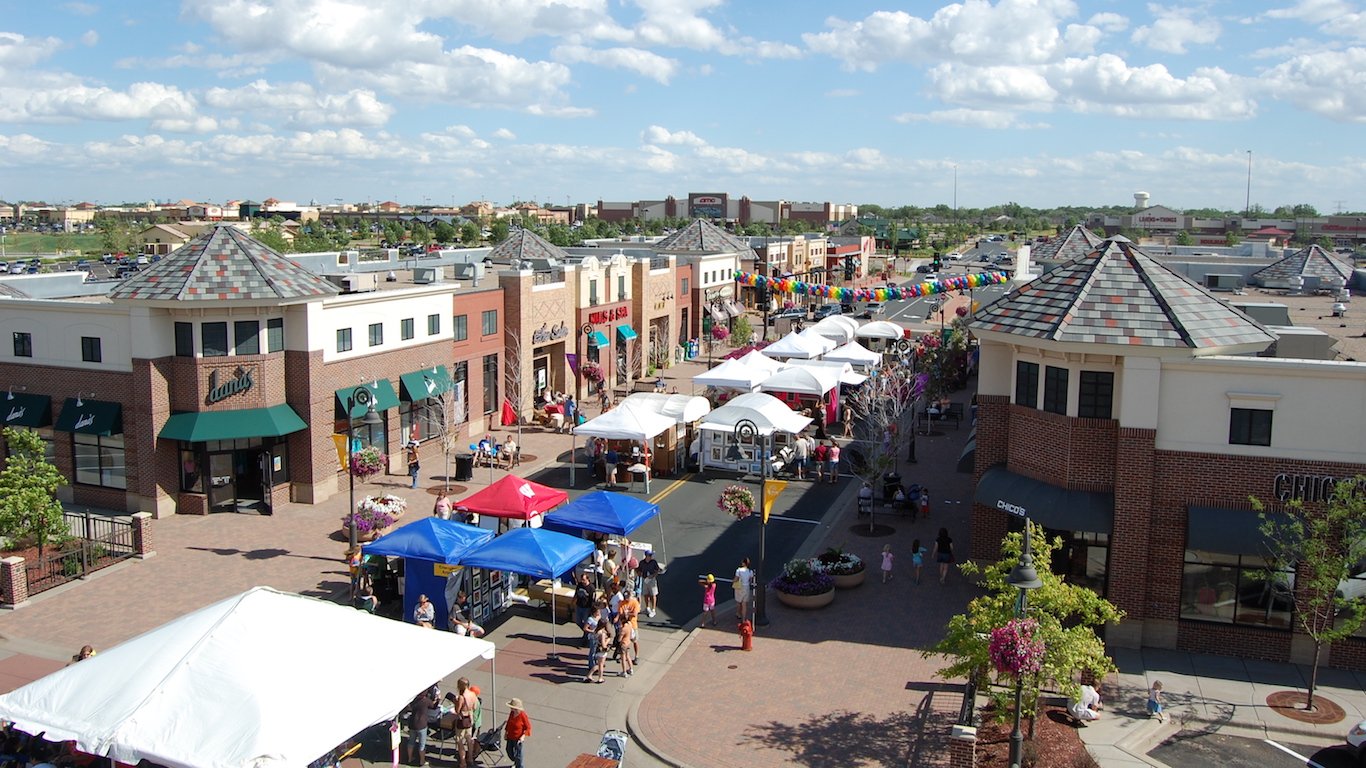
15. Maple Grove, Minnesota
> Population: 68,381
> Median home value: $276,300
> Poverty rate: 1.9%
> Pct. with at least a bachelor’s degree: 51.5%
Poverty can have far-reaching negative effects on the safety and health of a city, but not in Maple Grove. While nationwide 14.7% of residents live below the poverty line, in Maple Grove just 1.9% of residents do. This is likely tied to the fact that very few workers in the city are unable to find a job. The city’s 2.9% unemployment rate is among the lowest of any U.S. city.
[in-text-ad]
Property values in the Minneapolis-St. Paul suburb are relatively high, with a median home value of $276,300. Nationwide, the typical U.S. home in a city is worth less than $200,000. However, very high incomes in the city help offset the higher home prices. The median home price is worth only 3.1 times the area’s median household income, compared to the U.S. average of 3.5.
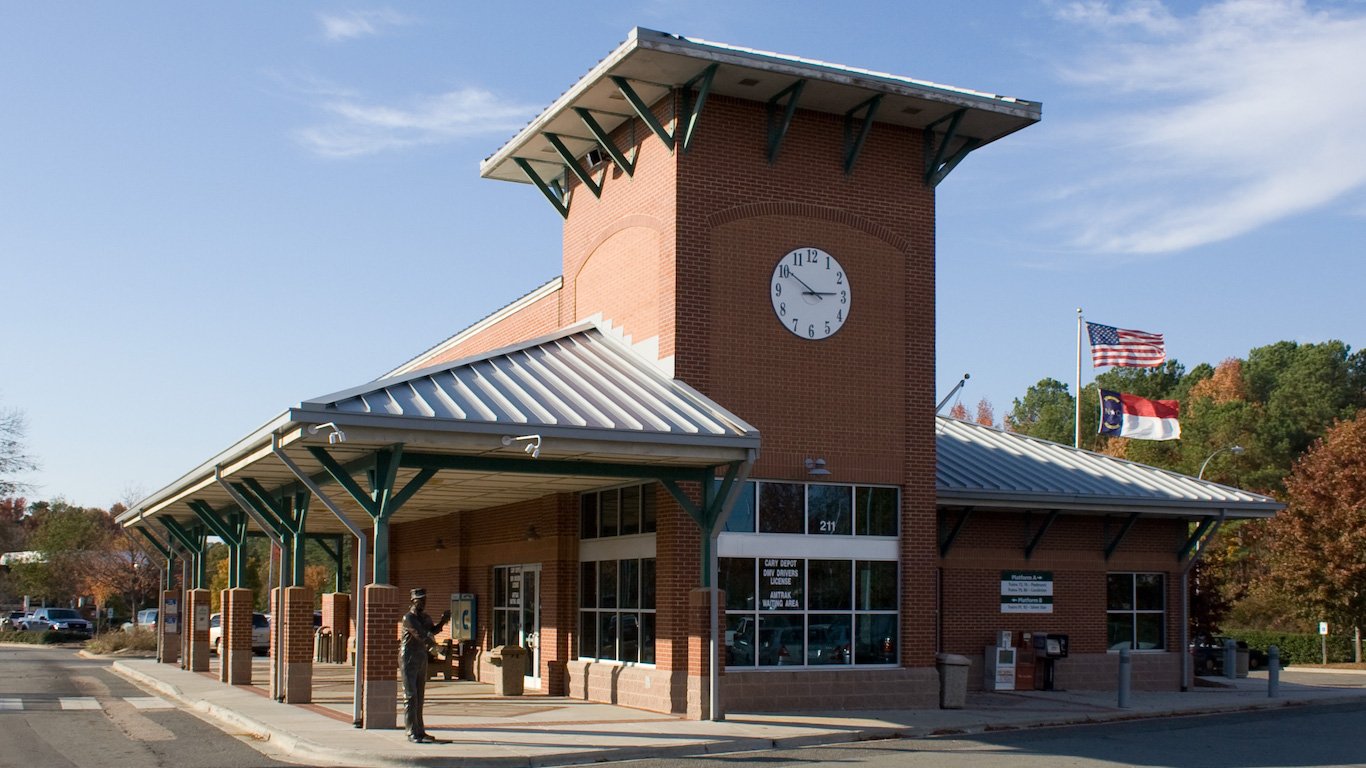
14. Cary, North Carolina
> Population: 160,514
> Median home value: $322,200
> Poverty rate: 4.5%
> Pct. with at least a bachelor’s degree: 63.6%
Located within a short commute of Cary are a handful of premier research universities, including the University of North Carolina at Chapel Hill, Duke University, and North Carolina State University. The universities are part of the Research Triangle Park, a hub of tech companies and a major economic power in the region. Cary’s proximity to such educational and occupational employment opportunities is likely one reason behind the city’s talent pool. The share of Cary adults with at least a bachelor’s degree, at 63.6%, is among the largest of any city.
As more residents relocate to Cary, the town’s success story continues to develop. Over the past decade, the city’s population growth rate of nearly 50% was more than in nearly every other city. The number of jobs increased accordingly, growing 7.5% between 2013 and 2015 — as unemployment stayed low. Just 3.8% of the city’s workforce is unemployed, far lower than the national 5.3% unemployment rate.
[wallst_email_signup]
![]()
13. Broken Arrow, Oklahoma
> Population: 107,595
> Median home value: $162,300
> Poverty rate: 8.0%
> Pct. with at least a bachelor’s degree: 29.7%
Broken Arrow is one of the most affordable cities in the country. The price of a typical home is $162,300, or 2.3 times the area’s median household income of $70,242 a year. Meanwhile, a typical U.S. home sells for $194,500, or 3.5 times the national median annual income of $55,775. This effectively means homeowners in Broken Arrow pay about 14 months less worth of income when purchasing a home than the typical American.
While Broken Arrow residents are relatively wealthy, the 29.7% of area adults with at least a bachelor’s degree is a smaller share than is typical in high-income cities. Residents without degrees may find high-paying jobs in the city’s expansive manufacturing industry. Broken Arrow has the third highest concentration of manufacturers in Oklahoma, including companies such as flight simulator developer FlightSafety International, oilfield machinery manufacturer Zeeco, and ice cream maker Blue Bell Creameries.
12. Woodbury, Minnesota
> Population: 67,850
> Median home value: $296,700
> Poverty rate: 4.8%
> Pct. with at least a bachelor’s degree: 60.5%
Woodbury residents enjoy some of the best quality of life nationwide. The typical household earns $101,481 a year, far more than than the $55,775 a year a typical household earns nationwide. Just a short drive down I-94 from St. Paul and Minneapolis, much of the Woodbury economy is tied to the Twin Cities area. The easy access to the occupational opportunities of a major metropolitan area may be one reason why just 2.6% of the Woodbury workforce is unemployed, less than half the national unemployment rate.
While Woodbury residents enjoy the economic advantages of the Twin Cities, they are less exposed to the dangerous aspects of a large city. There were 703 violent crimes in St. Paul and 1,063 violent crimes in Minneapolis per 100,000 residents in 2015. By contrast, just 52 violent crimes per 100,000 residents were reported in Woodbury.
[nativounit]
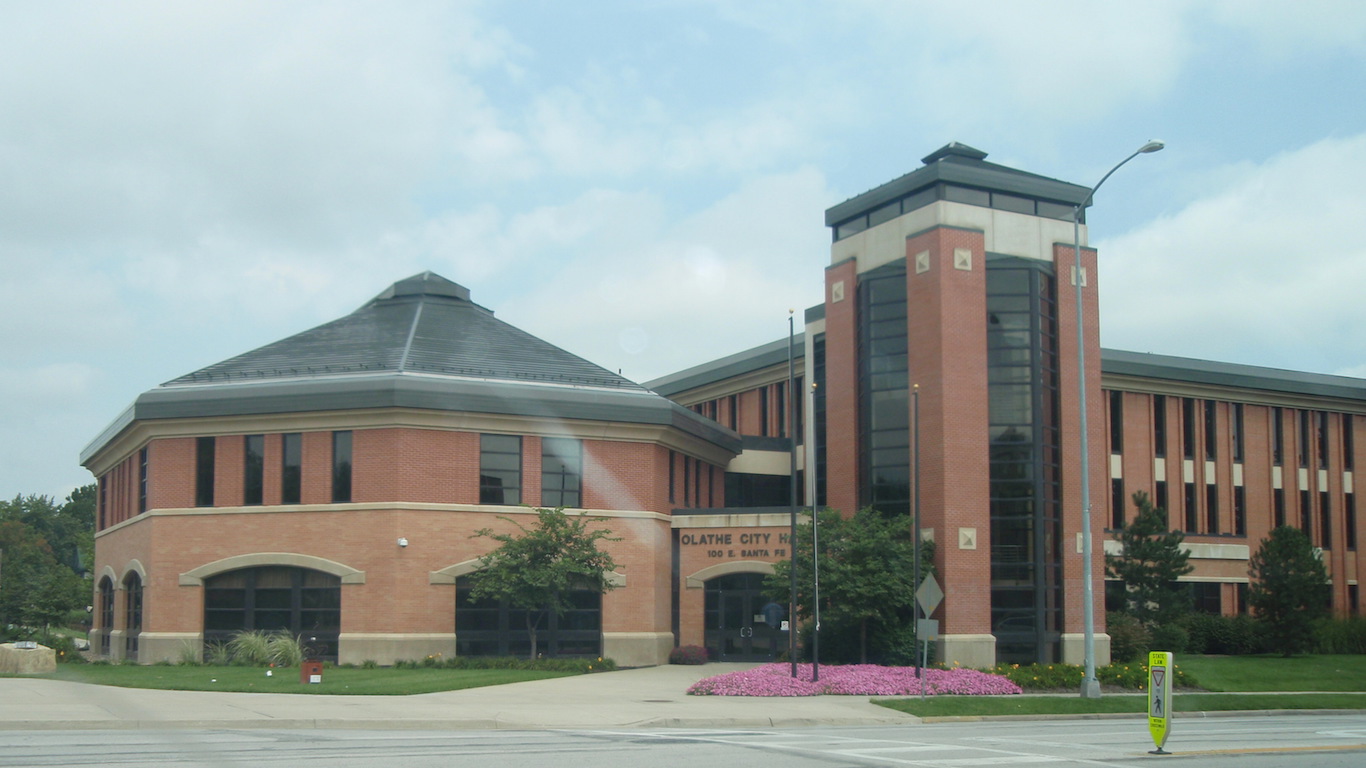
11. Olathe, Kansas
> Population: 134,316
> Median home value: $207,700
> Poverty rate: 6.0%
> Pct. with at least a bachelor’s degree: 47.0%
Relative to local incomes, real estate in Olathe is some of the most affordable in the country. Though the $207,000 value of a typical home in Olathe is approximately $67,000 more than the comparable statewide figure, the higher cost is offset by higher incomes. The typical Olathe household earns $80,242 a year, making the ratio of income to home value among the most affordable in the country.
With high incomes and a proportionately high housing costs, few Olathe residents struggle to make ends meet. Just 6% of Olathe residents live in poverty, less than half the national poverty rate. Like many cities where poverty is scarce, violent crime is relatively uncommon in Olathe. There were just 113 violent crimes per 100,000 residents in the city in 2015, among the least nationwide.
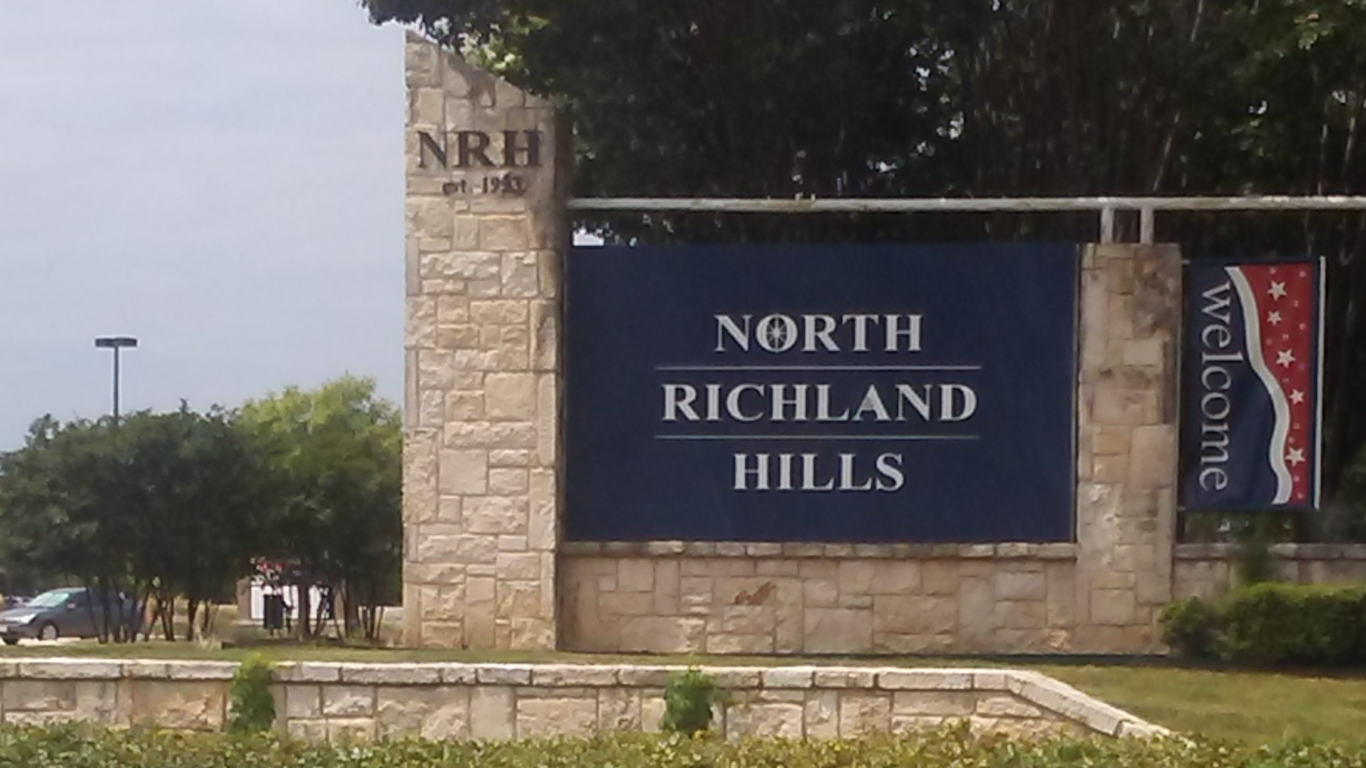
10. North Richland Hills, Texas
> Population: 69,205
> Median home value: $163,300
> Poverty rate: 8.8%
> Pct. with at least a bachelor’s degree: 27.3%
For most, the ideal city economy is one with high wages and a low cost of living. In North Richland Hills, a Dallas-Fort Worth suburb, the median household income of $61,498 is about $6,000 above the nationwide median income. In addition, with the exception of utilities, the cost of every major category of goods and services is lower in the Texas city than the nation as whole. A typical home costs 2.7 times the median annual household income, one of the lowest affordability ratios in the country. In College Station, Texas, home prices are more than five times the median income.
[in-text-ad]
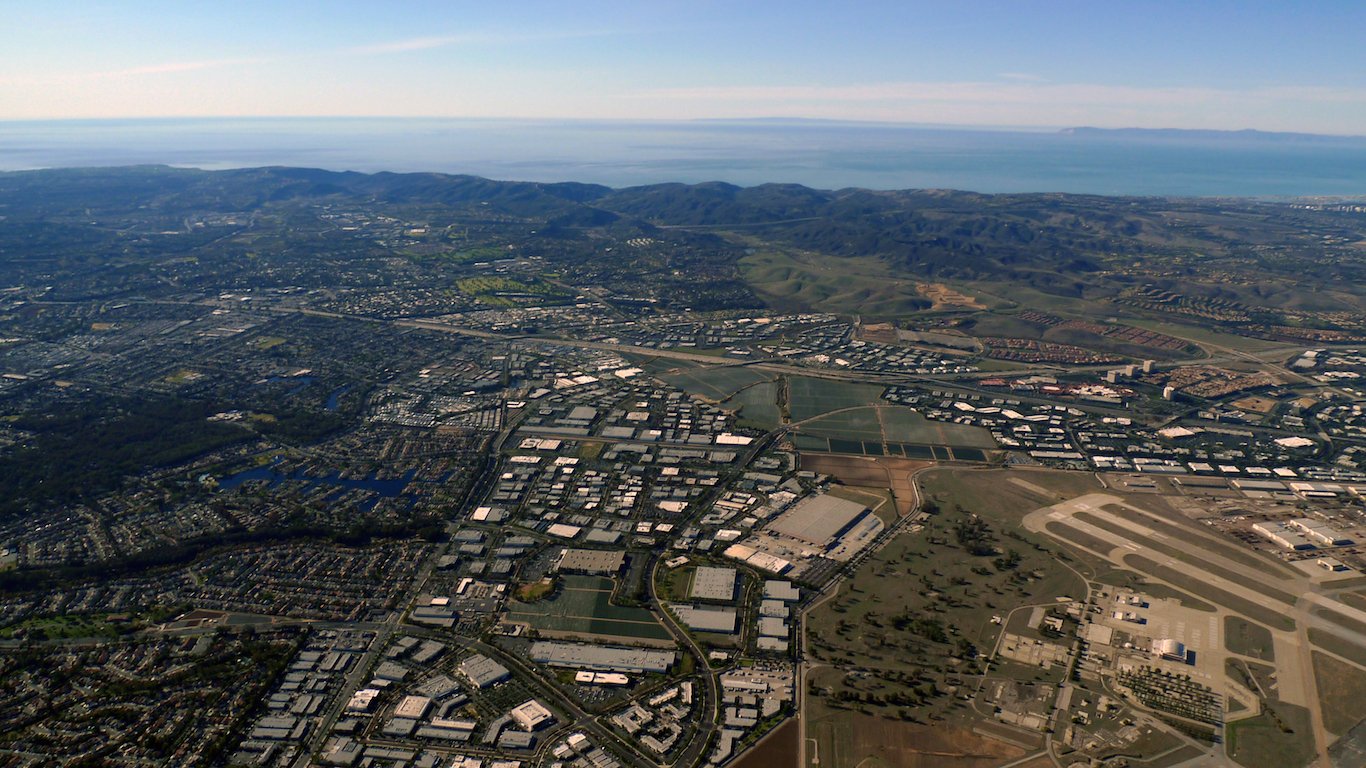
9. Lake Forest, California
> Population: 82,497
> Median home value: $590,200
> Poverty rate: 9.6%
> Pct. with at least a bachelor’s degree: 46.3%
The local economy in Lake Forest fares much better than much of the country by a number of measures. Similar to many other California cities, incomes are high in Lake Forest. The typical household in the city earns $87,084 a year, more than enough to compensate for the especially high housing and transportation costs in the area. Additionally, only 3.2% of the workforce is out of a job, one of the lowest unemployment rates in the country. Also, only 9.6% of city residents live in poverty, a far smaller share than the 15.3% statewide poverty rate. Economic prosperity is partially attributable to the presence of several companies employing thousands of Lake Forest residents. The largest private employers in the area are sports equipment company, Oakley, electronics manufacturer, Panasonic, and home mortgage company, LoanDepot.
Crime is relatively scarce in Lake Forest. Both the violent and property crime rates in the city are less than half the corresponding national figures.
[nativounit]
8. O’Fallon, Missouri
> Population: 85,032
> Median home value: $201,700
> Poverty rate: 3.9%
> Pct. with at least a bachelor’s degree: 36.9%
Like many of the most livable cities in the country, O’Fallon is within commuting distance of a much larger city. St. Louis is located across the Missouri river from O’Fallon, providing O’Fallon residents access to a number of otherwise unavailable cultural amenities without many of the drawbacks typical in large cities. St. Louis has the highest violent crime rate in the country while, O’Fallon’s violent crime rate is one of the lowest. In addition, the city has a lower cost of living than in St. Louis, and the median household income is nearly double the corresponding figure in St. Louis.
O’Fallon has experienced a considerable population boom in the past decade. The Missouri city’s population growth rate of 25.3% in the past ten years is more than double the 11.5% population growth rate nationwide over the same time.

7. Peoria, Arizona
> Population: 171,242
> Median home value: $223,000
> Poverty rate: 7.0%
> Pct. with at least a bachelor’s degree: 29.4%
Americans seeking inexpensive housing and warm climates often relocate to the Southwest and Southeast. The population of Peoria grew by 10.9% over the past five years, while at the same time the nation’s population grew by 3.9%. In addition to the climate, some may have been attracted by the housing costs, which are 14% less expensive in Peoria than they are on average nationwide. A sign of a strong economy, the number of jobs in the city also grew as the population expanded, increasing by 7.3% between 2013 and 2015.
Located in commuting distance to Phoenix, Peoria residents enjoy access to the amenities of Arizona’s largest city without the danger of a large metropolis. There were 594 violent crimes per 100,000 people in Phoenix in 2015 and 410 incidents per 100,000 residents statewide. In Peoria, the violent crime rate of 166 incidents per 100,000 was among the lowest in the country.
[recirclink id=358493]

6. Fishers, Indiana
> Population: 86,071
> Median home value: $233,500
> Poverty rate: 4.1%
> Pct. with at least a bachelor’s degree: 68.2%
The violent crime rate in Fishers, Indiana of only 24 incidents a year per 100,000 residents is an exceptionally low rate, even among the nation’s top cities. By contrast, the national violent crime rate is 373 incidents per 100,000 Americans.
The typical home in the area is valued at $233,500, considerably more than the state’s median home value of $131,000. However, the median home value in Fisher is only a little more than double the annual income of a typical city household. At $121,148, median annual household income in Fishers, adjusted for cost of living, is third highest in the country. Nationwide, homes cost 3.5 times the typical annual household income.
[cnxvideo id=”625480″ placement=”ros”]
5. Lee’s Summit, Missouri
> Population: 95,068
> Median home value: $200,300
> Poverty rate: 6.2%
> Pct. with at least a bachelor’s degree: 46.6%
Residents in Lee’s Summit, Missouri reap the benefits of some of the best economic circumstances of any U.S. city. The Kansas City suburb’s unemployment rate of 3.8% is well below both the state and national rates. The city’s employment growth rate of 6.6% between 2013 and 2015 well outpaced the national 4.0% growth rate over the same time.
[in-text-ad]
The presence of colleges and universities near a city can have wide-reaching positive effects on quality of life. In addition to providing education opportunities for residents, these institutions often attract other employers. There are 36 colleges and universities in the Lee’s Summit area, or 5.2 institutions for every 100,000 residents, one of the highest concentrations in the country.
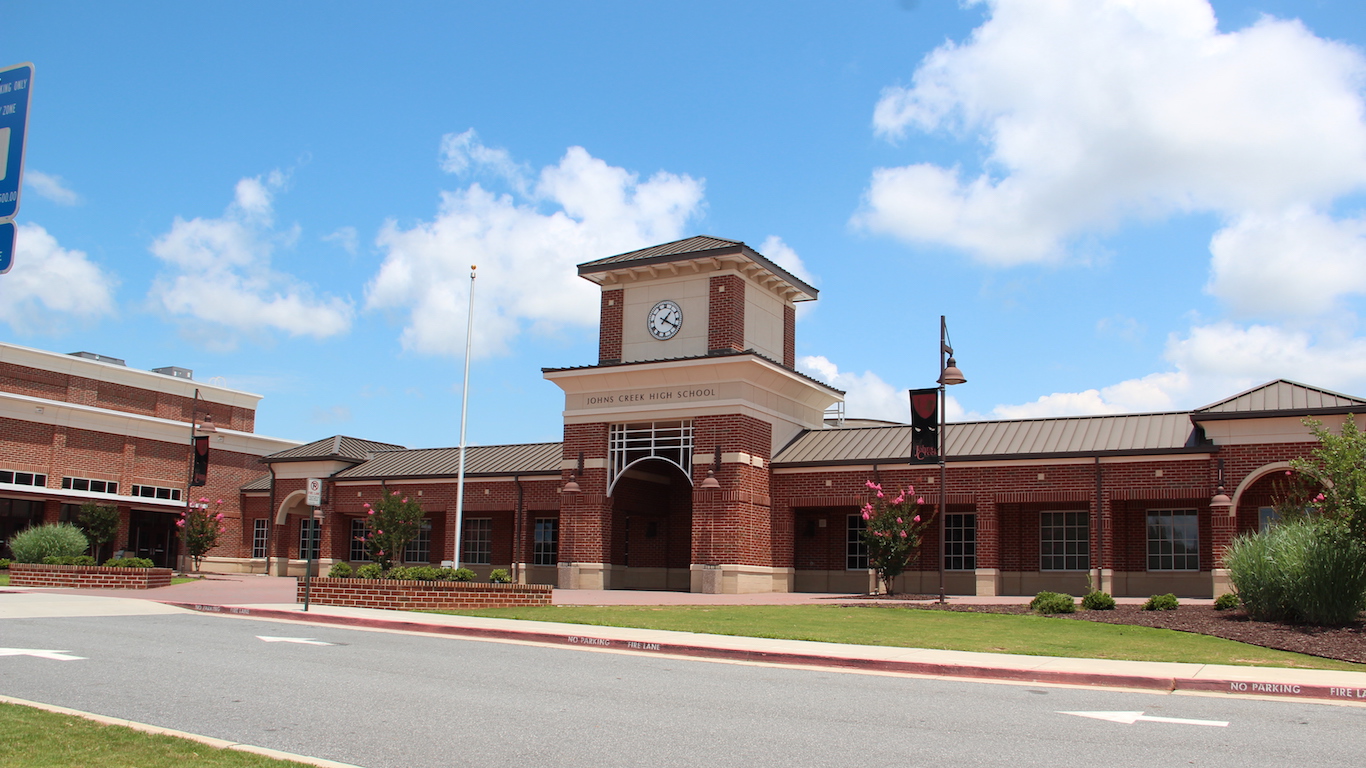
4. Johns Creek, Georgia
> Population: 83,339
> Median home value: $373,700
> Poverty rate: 4.6%
> Pct. with at least a bachelor’s degree: 65.6%
While many social and economic measures in Georgia are generally worse than in most states, Johns Creek residents earn high incomes while living in a low poverty area, have high levels of education, and can enjoy plenty of amenities. The median annual household income in Johns Creek, adjusted for the cost of living, is $115,402 a year, well more than double the state’s median income. Also, the poverty rate of 4.6% is considerably lower than the national poverty rate of 14.7% and the state rate of 17.0%.
Johns Creek residents also have access to a remarkable number of leisure venues, especially dining. There are around 320 eating locations per 100,000 city residents, one of the higher such concentrations in the nation.
[nativounit]
3. Richardson, Texas
> Population: 110,827
> Median home value: $226,000
> Poverty rate: 9.5%
> Pct. with at least a bachelor’s degree: 53.2%
More than half of all adults in Richardson have at least a bachelor’s degree. With high educational attainment, incomes in the city are high and violent crime is scarce. The typical Richardson household earns $80,398 a year, and the city’s violent crime rate is less than half that of the state a whole. In many cities with higher incomes, the cost of living is also higher than normal. In Richardson, however, the cost of goods and services is roughly in line with the cost of living nationwide.
Located just outside of Dallas, Richardson residents benefit both from economic opportunities in the larger city, and the cultural amenities, without the higher violent and property crime rates.
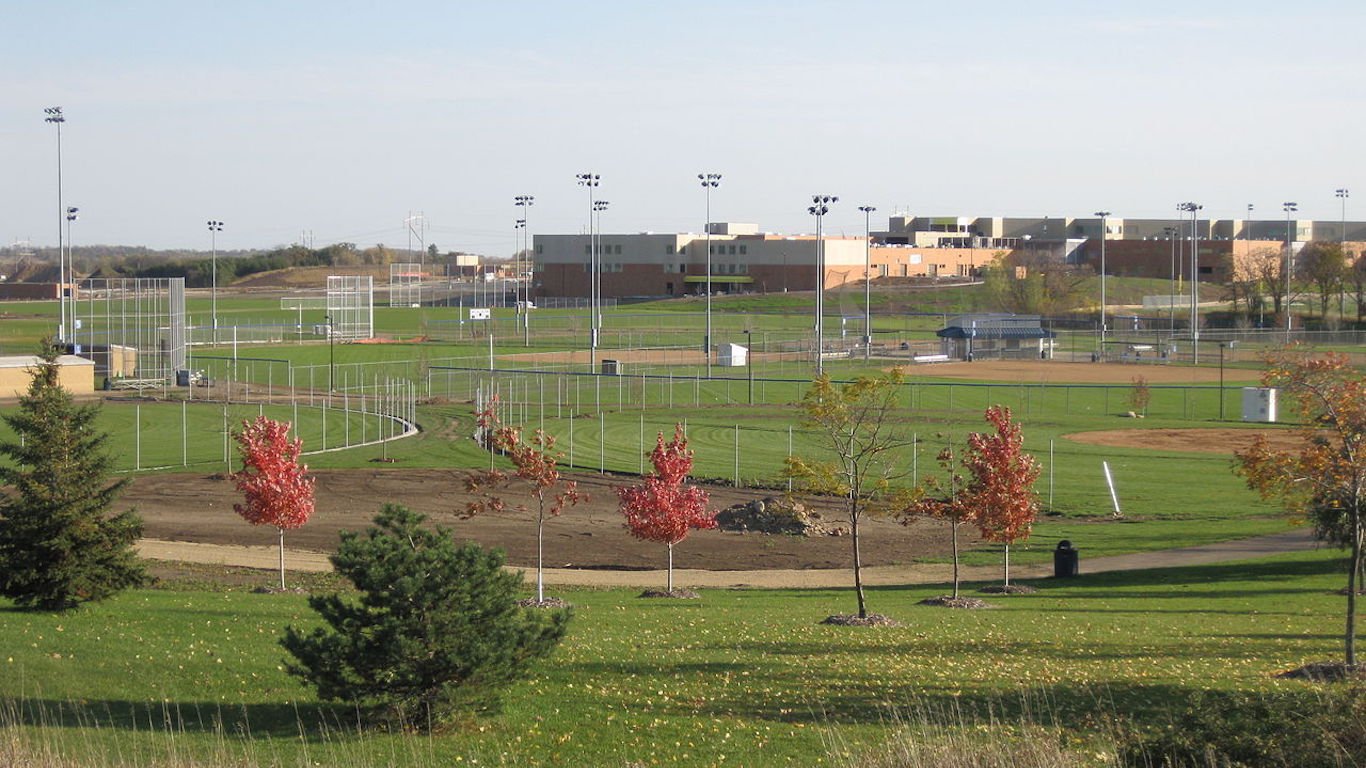
2. Meridian, Idaho
> Population: 90,753
> Median home value: $213,100
> Poverty rate: 10.7%
> Pct. with at least a bachelor’s degree: 35.2%
Meridian is located just outside of Idaho’s capital city of Boise. The city is safe — Just over 100 violent crimes were reported per 100,000 residents in Meridian last year, a fraction of the national violent crime rate of 373 violent crimes per 100,000 people nationwide.
The city’s annual unemployment rate is quite low, At just 3.5% compared to the national jobless rate of 5.3%. Moreover, jobs are being added to the local economy faster than in most of the United States. The number of jobs increased by nearly 10% from 2013 through the end of last year, much faster than the national jobs growth rate of 4.0% over that period. Prospective employment is frequently the first priority for Americans considering relocation. With the strong job market, Meridian’s population has been growing dramatically in recent years. The city’s population growth rate of over 20% over the five years through 2015 is more than five times the nation’s 5-year population growth rate of 3.9%.
[wallst_email_signup]

1. Broomfield, Colorado
> Population: 65,065
> Median home value: $342,800
> Poverty rate: 4.6%
> Pct. with at least a bachelor’s degree: 56.1%
Broomfield, Colorado is 24/7 Wall St.’s best city to live in. Many of the nation’s top cities are relatively small, located just outside a major metropolitan area, and Broomfield is no different. With a population of just over 65,000, Broomfield barely made the population cutoff for consideration on this year’s list. The city is located in commuting distance of both Boulder and Denver.
Broomfield boasts several economic features that are likely quite attractive to families browsing for a new city. Less than 5% of city residents live in poverty, for example, a fraction of the national poverty rate of 14.7%. The health of a city’s job market is one of the most universal characteristics of a highly desirable city. Not only is Broomfield’s annual unemployment rate of 3.3.% is one of the lower rates of U.S. cities, but also the number of jobs in the city grew by 8.0% from 2013 through last year, double the comparable national growth rate. If education levels of a population are any indication of the quality of jobs in an area, then the jobs offered in Broomfield are high skilled and high paying. Well over half of adults in the city have at least a bachelor’s degree, one of the higher college attainment rates of any U.S. city.
Methodology
To determine America’s 50 best cities to live in, 24/7 Wall St. considered the roughly 550 cities that the U.S. Census Bureau reported as having populations of more than 65,000 residents in 2015. Only the top performing city in each county was considered in our ranking. Data were collected in nine major categories: crime, demography, economy, education, environment, health, housing, infrastructure, and leisure.
Within each category, specific measures contributed to a city’s overall category score. For example, the economy category included median household income adjusted for cost of living, the ratio between a city’s and its state’s median household income, poverty and unemployment rates, as well as a city’s three-year employment growth. Each measure was adjusted to range from 0 to 1 using min-max normalization, with lower scores indicating better outcomes.
Normalizing each measure, as opposed to aggregating category scores in other ways, allowed us to assign weight to individual measures for added importance rather than entire categories. It also enabled us to expose the principal components of our index — those measures with wider variation that disproportionately determine the rank of a city’s composite score. The housing category, for example, had the widest range, giving it the greatest pull in our index. Crime and economy also had large variances.
We did not include any measures in the demography category in our composite index. However, this category provided exclusion rules. Cities that are better to live in often attract job seekers and their families. Conversely, labor market slack, unaffordable housing, high crime rates, or a myriad of other negative factors may induce people to move to a different city with better prospects. Thus, we excluded cities with negative five- or 10-year population growth rates. Population figures are from the Census Bureau’s 2015 American Community Survey (ACS).
The crime category consists of both violent and property crime rates from the Federal Bureau of Investigation’s 2015 Uniform Crime Report. High crime rates have the potential to make a city less desireable. As a result, cities with crime rates lower than the national rates were rewarded, while cities with higher crime rates were penalized.
A strong economy and labor market are, for some, the only considerations when determining where to live. The economy category includes a city’s 2015 unemployment rate and employment growth from 2013-2015, both from the Bureau of Labor Statistics. Additionally, we considered the poverty rate, which, if too high, may deter prospective residents from moving to the city. Cities were penalized for having poverty rates above the national rate of 14.7%. Our goal was to identify cities that were liveable for everyone, not just the rich. Still, if incomes are too low, a city may not be desireable. To that end, we adjusted median household income for cost of living in the city. Cities were penalized if cost-adjusted incomes were less than $44,000 or more than $112,000 a year, roughly 80% to 200% of a typical household’s income nationwide. Poverty rates and median income came from the 2015 ACS. Cost of living data came from property and real estate data provider ATTOM Data Solutions.
A strong school system may be another consideration for parents looking to move. As a proxy for school system strength, we considered high school standardized test scores relative to state scores from ATTOM Data Solutions. Test score data are for 2015 or the most recently available year. Additionally, the education category included the percentage of adults with at least a bachelor’s degree from the ACS, as well as the number of colleges and universities in a city per 100,000 residents from the Department of Education. Both measures are as of 2015.
For people who like being outdoors — either for work or pleasure — a city’s air quality and weather may be of chief importance. Whereas other measures in this index are specific to an individual city, many metrics in this category describe the county in which the city is located because weather is likely similar, if not the same, in these two geographies. In this category, we included an air quality index to assess the levels of a variety of pollutants on a given day. Additionally, we considered an index measuring natural hazard risk, as well as average monthly rainfall. All data in this category came from ATTOM Data Solutions.
Access to quality hospitals may be another reason Americans live in the places they do. From the Centers for Medicare and Medicaid Services (CMS), we calculated 30-day risk-adjusted mortality rates of heart attacks, COPD, heart failure, pneumonia, and stroke. Also from CMS, we examined the rate at which individuals were readmitted to a hospital within 30 days of being discharged. This category also includes preventable hospitalizations — the share of hospitalizations that could have been treated with outpatient or ambulatory care for every 1,000 Medicare recipients from County Health Rankings.
For many American homeowners, homes constitute the vast majority of wealth. An investment of this magnitude requires careful consideration and may be the chief reason that people decide to live where they do. In our housing index, we considered the ratio of a city’s median home value to the statewide median home value. Cities were penalized if a city’s home values were worth less than 90% of statewide home values. Conversely, if home values were typically 25% higher than across the state, high barriers to entry exist that can make a city unaffordable. As an additional measure of affordability, we included the ratio of median home value to median annual household income. This ratio — called a price-to-income ratio — helps identify cities that are liveable for a broad audience. We also considered median property taxes as a percentage of median home value. All data in this category came from the 2015 ACS.
Proximity to work may be another factor in determining where to live. According to the Texas A&M Transportation Institute, Americans waste nearly 7 billion hours — or $160 billion — due to commuter traffic congestion. From the ACS, we considered the percentage of commuters travelling to work by foot or public transportation. Additionally, we reviewed the average time it takes to travel to work each day. Lastly, we included the number of airports in the metro area in which the city is located. There are, for example, no airports in New York County, the primary county of New York City. However, at least three major airports exist outside county limits — and within the metro area — that service people who live in the city. Airport data came from the Federal Aviation Administration and only consider operational public-use and commercial airports as of 2015.
The leisure category can be broken into two parts: activities that take place in the city and outside it. Within a city, residents may take advantage of restaurants and bars, libraries and archives, theater companies, fitness and recreational sports centers, museums, movie theaters, hotels, or amateur and professional sports teams. To engage in other pastimes — skiing, for example — residents likely have to leave city limits. Thus, we included in this index the number of zoos, nature parks, ski resorts, and golf courses in the counties surrounding the city. All data in this category were aggregated to the city level from 2014 Zip Code Business Patterns, a program maintained by the Census and adjusted for the city’s 2015 population.
Contact [email protected] for any questions or corrections.