
[cnxvideo id=”508130″ placement=”ros”]Home prices and homeownership rates have risen in recent years, and federal regulators are poised to lift loan rules implemented over 10 years ago during the financial crisis. — these are all signs of economic recovery. However, the dream of owning a home is still out of reach for some Americans — especially in certain areas.
24/7 Wall St. reviewed the most recent housing market data for over 400 counties provided by property data company ATTOM Data Solutions. One way to gauge housing affordability is by examining how much an average home costs to own relative to an area’s average income. By this measure, Kings County (Brooklyn), New York is the least affordable market in the nation. The monthly costs of owning a typical home in the area are 123.5% the area’s average monthly wage. After Brooklyn, the typical costs of owning a home exceeds the typical wage in only Santa Cruz and Marin counties, California.
All but six of the 25 least affordable counties are in California, where housing — especially near the Bay Area — is famously expensive. Of the remaining counties, three are in New York and another two are in Hawaii.
Click here to see the least affordable housing markets.
In an interview with 24/7 Wall St., Daren Blomquist, senior vice president at ATTOM Data Solutions, said these unaffordable markets are characterized by “a rare combination of a lot of jobs, limited supply of housing that is geographically constrained, and high demand from not just domestic buyers but foreign buyers as well.”
Of the 25 least affordable county housing markets, 17 reported above average job growth over the 12 months through March. Notably, the number of jobs in San Francisco rose by 6.6% in the third quarter compared to last year’s third quarter. This was a much faster pace than the nationwide employment growth rate of 2% over that time. Blomquist explained that people moving to these areas for jobs are driving up the demand for housing, which in turn pushes prices higher.
In general, such high demand for housing should encourage greater home construction, but in many of these areas space is a limiting factor. Geographical features such as rivers, mountains, and in the case of California the Pacific Ocean, mean supply levels cannot possibly keep up with demand.
One might expect the likelihood of owning a home to decline in unaffordable housing markets. Since the affordability measurement is based on incomes of people actually living in the area, this is certainly the case among local residents, many of whom earn incomes far lower than what is needed to buy a home. However, as Blomquist explained, many of these markets “can sustain a high level of unaffordability because of the high demand from outside the market.” In Hawaii, the demand for vacation homes is so high from international buyers that the unaffordability does not result in lower ownership rates.
To identify America’s least affordable counties, 24/7 Wall St. reviewed monthly costs of owning a home as of the third quarter as a percentage of the average monthly wage the third quarter in 414 counties provided by ATTOM Data Solutions. In addition to mortgage payments, costs include mortgage interest, property taxes, and insurance. Wage figures and employment growth over the 12 months through March came from the Bureau of Labor Statistics. Homeownership rates are for 2015 from the U.S. Census Bureau’s 2015 American Community Survey.
These are the nation’s least affordable housing markets.
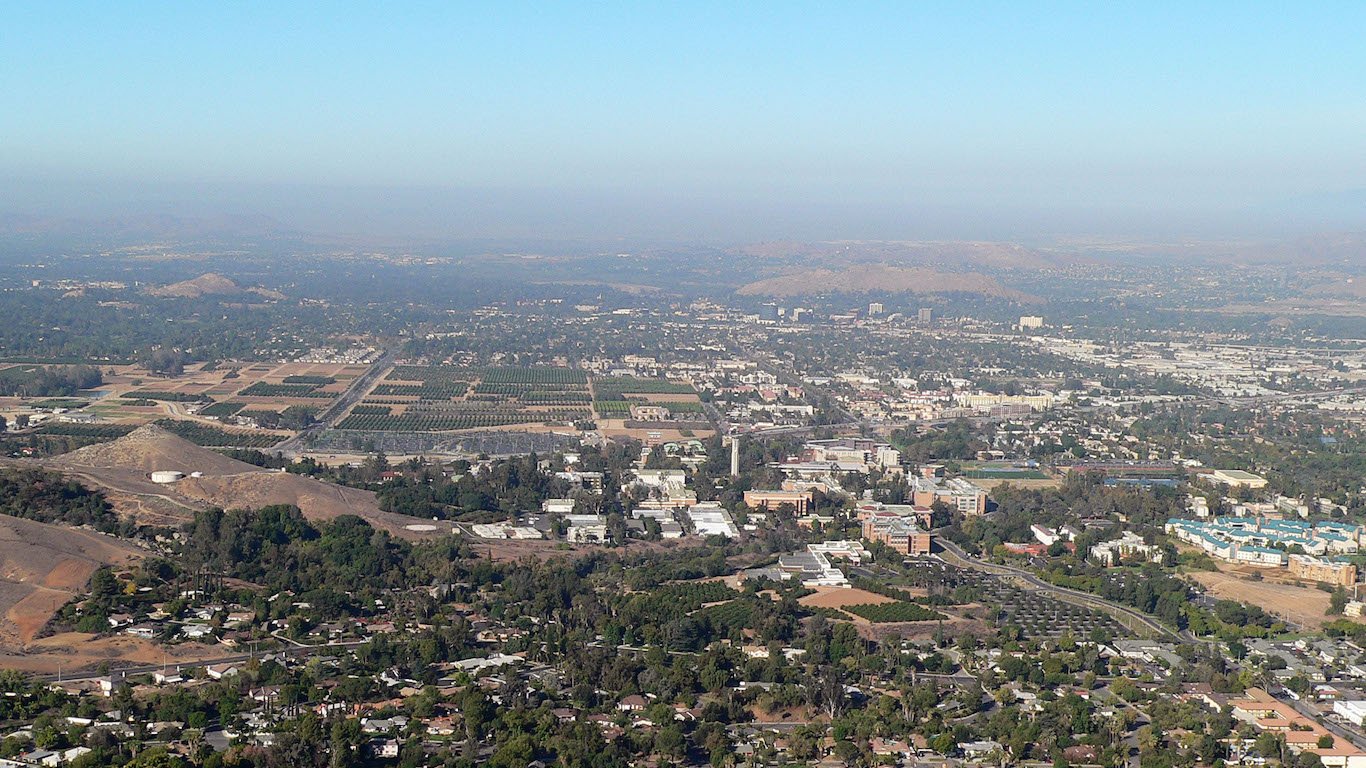
25. Riverside County, California
> Median home sale price: $307,000
> Median monthly pmt.: $1,973
> Monthly wage: $3,566
> Homeownership rate: 64.0%

24. Santa Clara County, California
> Median home sale price: $820,000
> Median monthly pmt.: $5,269
> Monthly wage: $9,577
> Homeownership rate: 56.1%
[nativounit]

23. Placer County, California
> Median home sale price: $390,000
> Median monthly pmt.: $2,506
> Monthly wage: $4,312
> Homeownership rate: 68.8%
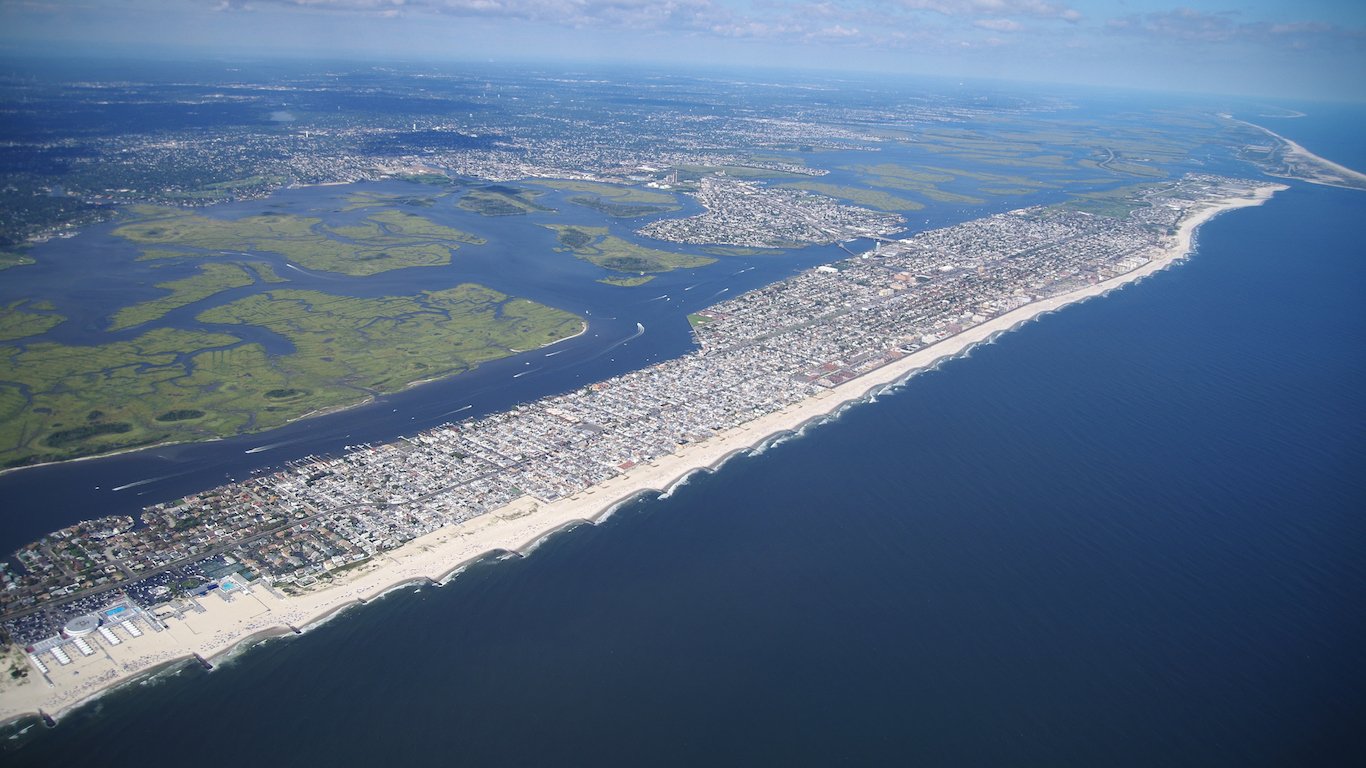
22. Nassau County, New York
> Median home sale price: $430,000
> Median monthly pmt.: $2,763
> Monthly wage: $4,888
> Homeownership rate: 80.1%
[recirclink id=359802]

21. Contra Costa County, California
> Median home sale price: $475,000
> Median monthly pmt.: $3,052
> Monthly wage: $5,568
> Homeownership rate: 64.1%

20. San Diego County, California
> Median home sale price: $465,000
> Median monthly pmt.: $2,988
> Monthly wage: $4,801
> Homeownership rate: 52.0%
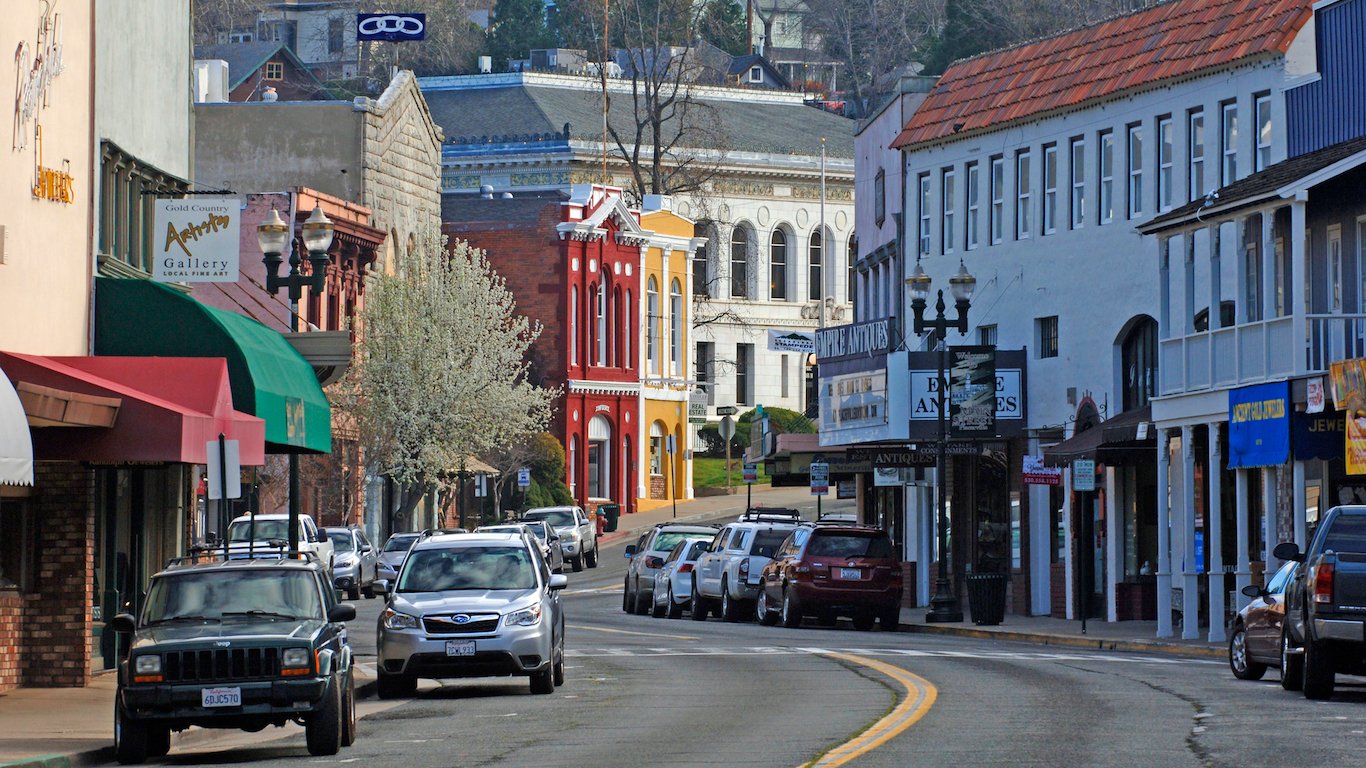
19. El Dorado County, California
> Median home sale price: $392,750
> Median monthly pmt.: $2,524
> Monthly wage: $3,809
> Homeownership rate: 78.4%
[nativounit]

18. Los Angeles County, California
> Median home sale price: $490,000
> Median monthly pmt.: $3,149
> Monthly wage: $4,931
> Homeownership rate: 45.1%
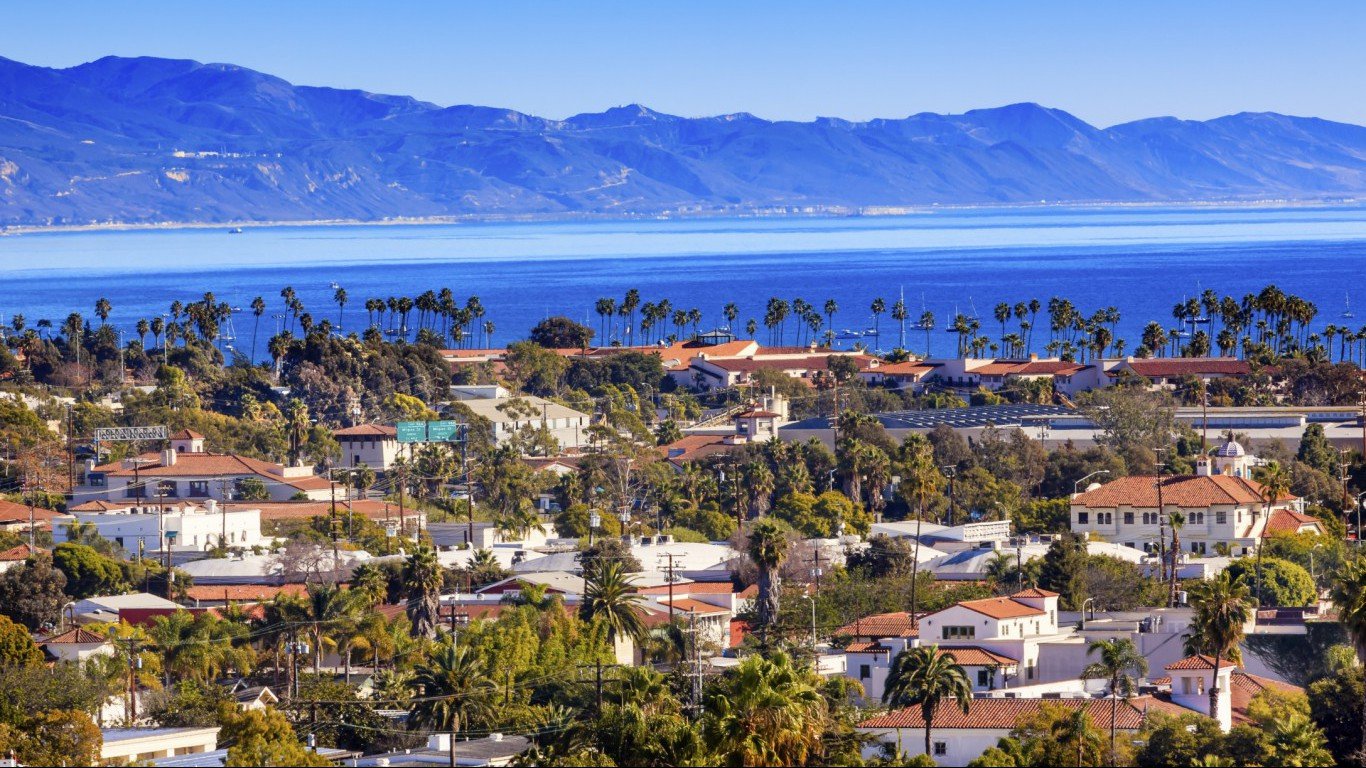
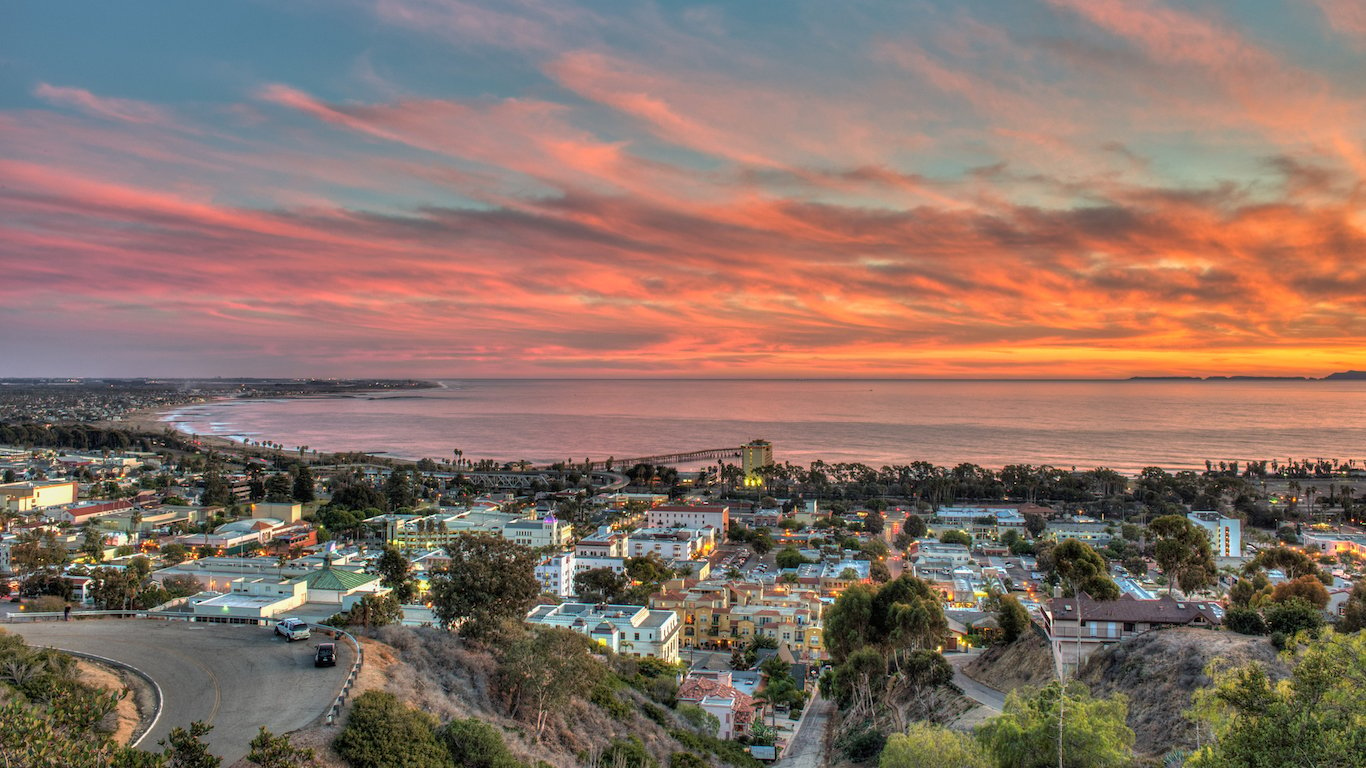
17. Santa Barbara County, California
> Median home sale price: $480,000
> Median monthly pmt.: $3,084
> Monthly wage: $4,043
> Homeownership rate: 51.3%
[wallst_email_signup]

16. Alameda County, California
> Median home sale price: $620,000
> Median monthly pmt.: $3,984
> Monthly wage: $5,863
> Homeownership rate: 52.5%
15. Ventura County, California
> Median home sale price: $509,000
> Median monthly pmt.: $3,271
> Monthly wage: $4,693
> Homeownership rate: 63.3%

14. Sonoma County, California
> Median home sale price: $507,500
> Median monthly pmt.: $3,261
> Monthly wage: $4,000
> Homeownership rate: 59.5%
[recirclink id=358577]
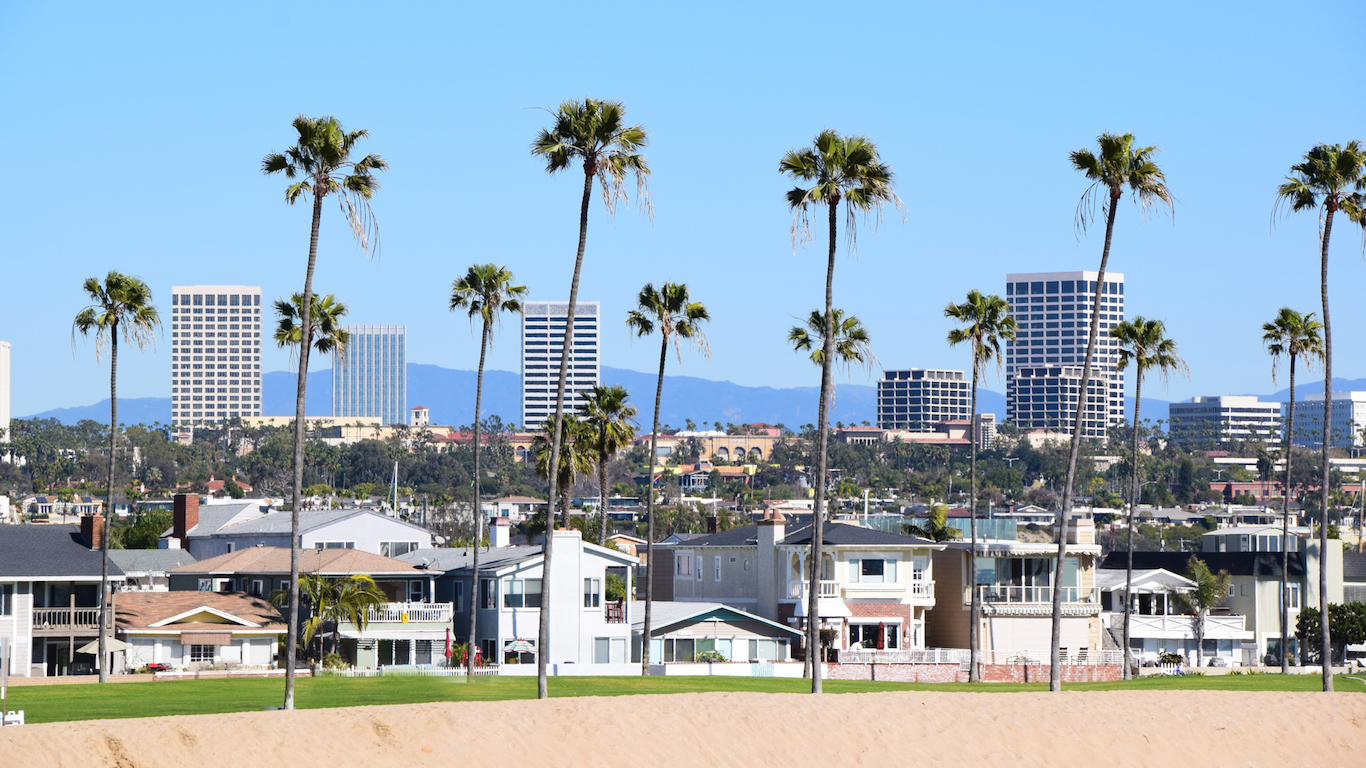
13. Orange County, California
> Median home sale price: $599,000
> Median monthly pmt.: $3,849
> Monthly wage: $4,953
> Homeownership rate: 56.6%

12. Honolulu County, Hawaii
> Median home sale price: $500,000
> Median monthly pmt.: $3,213
> Monthly wage: $4,052
> Homeownership rate: 53.5%
[nativounit]

11. San Mateo County, California
> Median home sale price: $960,000
> Median monthly pmt.: $6,169
> Monthly wage: $9,512
> Homeownership rate: 59.6%

10. Monterey County, California
> Median home sale price: $465,000
> Median monthly pmt.: $2,988
> Monthly wage: $3,692
> Homeownership rate: 49.1%

9. Queens County, New York
> Median home sale price: $498,500
> Median monthly pmt.: $3,203
> Monthly wage: $4,173
> Homeownership rate: 43.2%
[wallst_email_signup]
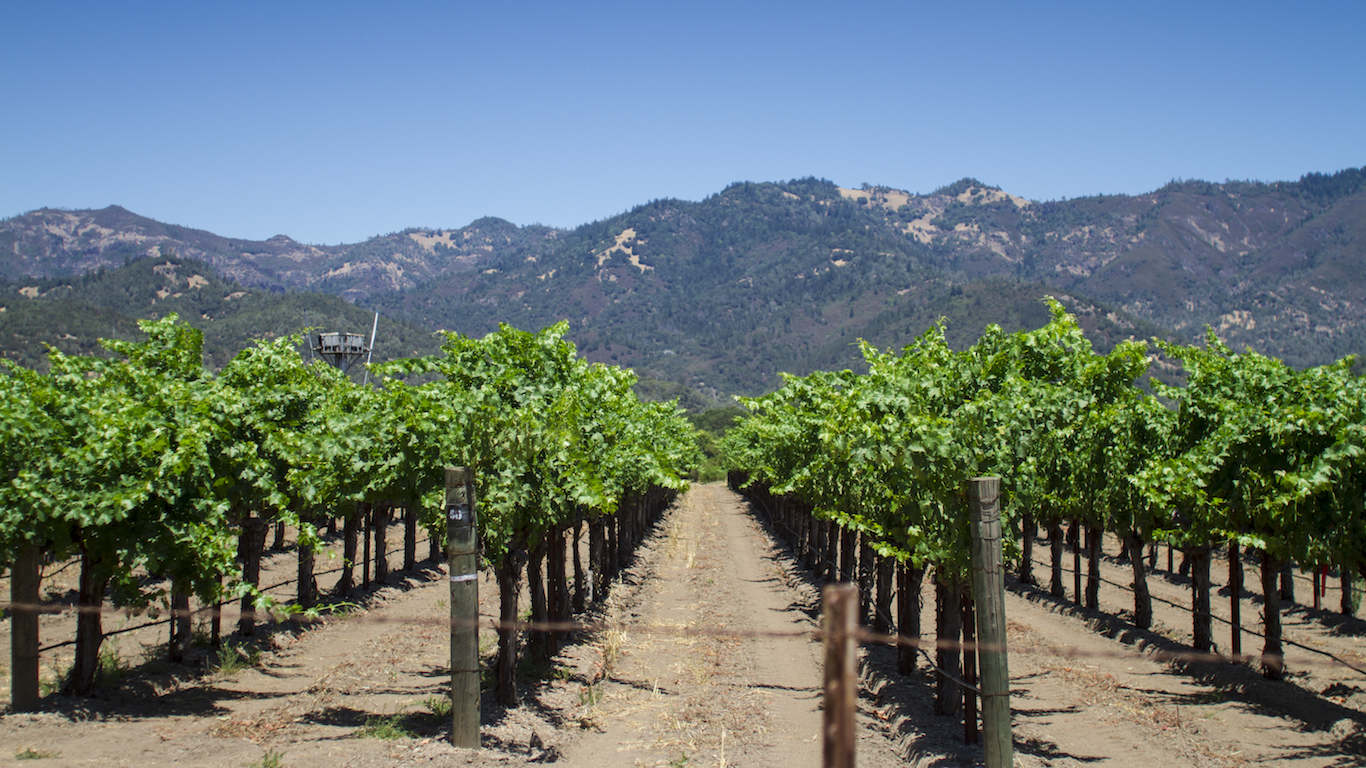
8. Napa County, California
> Median home sale price: $549,000
> Median monthly pmt.: $3,528
> Monthly wage: $4,147
> Homeownership rate: 61.8%
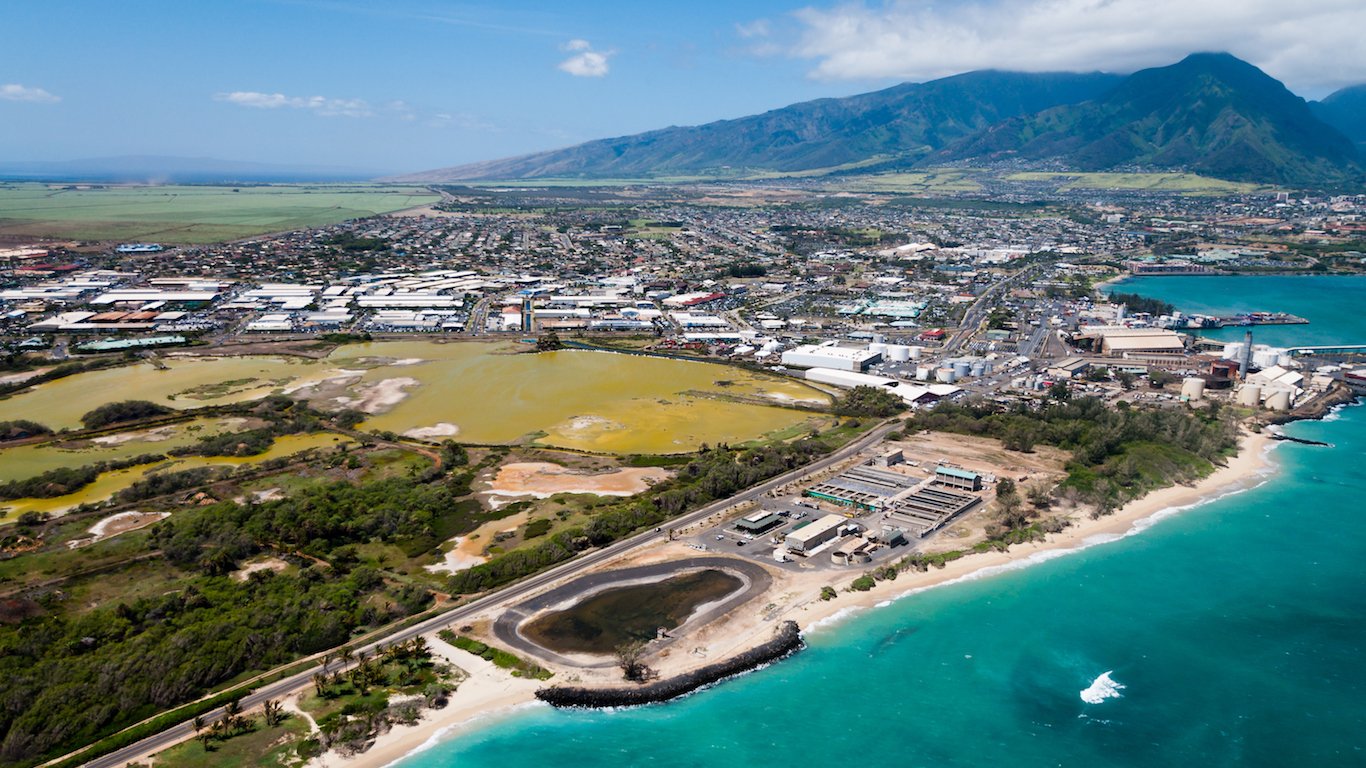
7. Maui County, Hawaii
> Median home sale price: $482,533
> Median monthly pmt.: $3,101
> Monthly wage: $3,445
> Homeownership rate: 58.6%
[nativounit]

6. San Francisco County, California
> Median home sale price: $1,150,000
> Median monthly pmt.: $7,390
> Monthly wage: $8,901
> Homeownership rate: 35.8%

5. San Luis Obispo County, California
> Median home sale price: $487,000
> Median monthly pmt.: $3,129
> Monthly wage: $3,558
> Homeownership rate: 58.9%

4. New York County, New York
> Median home sale price: $1,350,000
> Median monthly pmt.: $8,675
> Monthly wage: $12,060
> Homeownership rate: 23.5%
[nativounit]
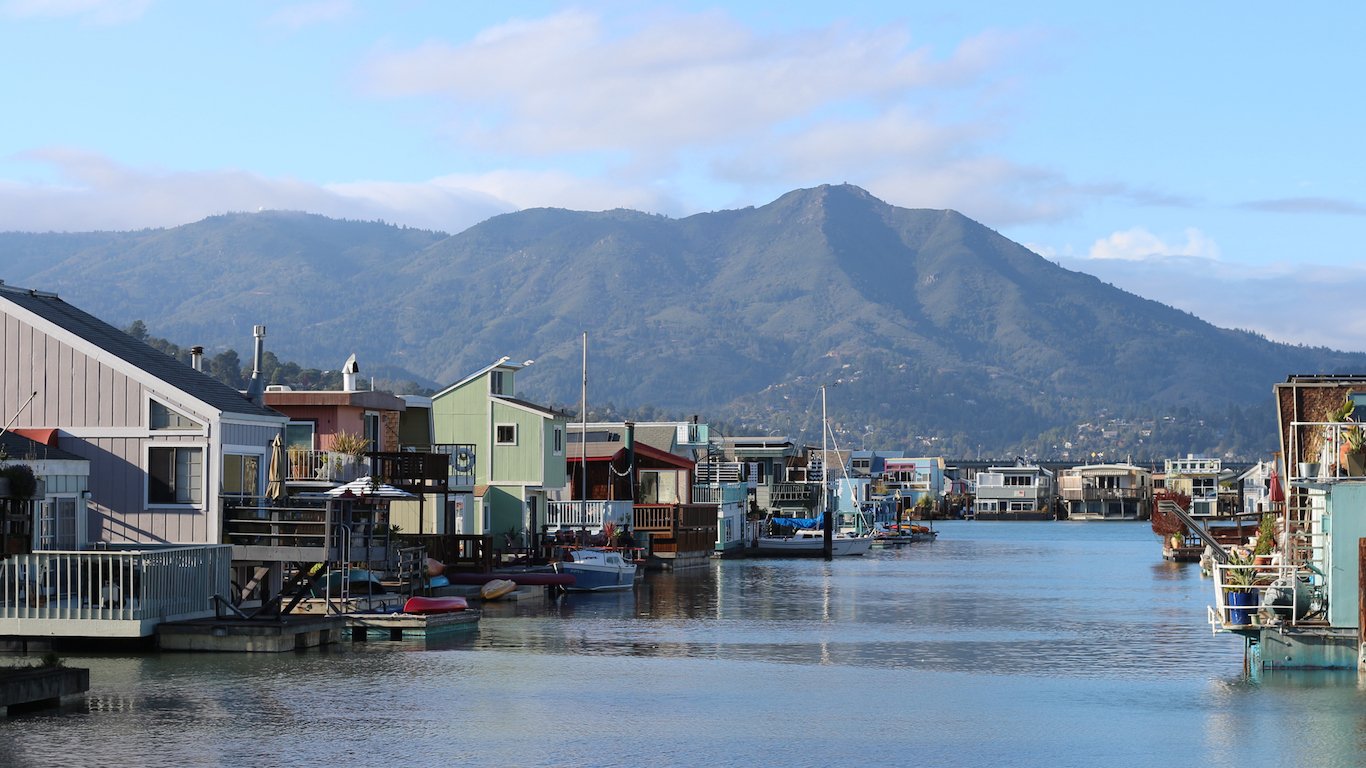
3. Marin County, California
> Median home sale price: $880,000
> Median monthly pmt.: $5,655
> Monthly wage: $5,555
> Homeownership rate: 63.6%

2. Santa Cruz County, California
> Median home sale price: $650,000
> Median monthly pmt.: $4,177
> Monthly wage: $3,818
> Homeownership rate: 55.4%
[recirclink id=358027]

1. Kings County, New York
> Median home sale price: $710,000
> Median monthly pmt.: $4,562
> Monthly wage: $3,575
> Homeownership rate: 28.7%
Contact [email protected] for any questions or corrections.