[cnxvideo id=”625484″ placement=”ros”]The U.S. economy has changed drastically in the past decade. As the housing bubble burst and the economy spiraled into the worst recession the country has faced since the Great Depression, unemployment hit a multi-decade high of 10% in 2009. Despite major setbacks, the U.S. economy began improving in June 2009, and many parts of the country are now thriving.
There are nearly 5.9 million more jobs in the United States today than there were at the end of 2007. Employment growth, however, has not been even across all states. 24/7 Wall St. reviewed 10-year job growth in all 50 states to identify the states where employment increased the most.
Most states recorded some employment growth. Only in seven states, there are fewer jobs today than there were in December 2007. In an interview with 24/7 Wall St., Martin Kohli, chief regional economist with the Bureau of Labor Statistics, explained that the construction and manufacturing sectors have been the biggest drags on employment growth. Indeed, of the states that lost jobs in the last 10 years, manufacturing was the biggest drag in three — Connecticut, Maine, and West Virginia — while construction shed the most jobs in the remaining four: Alabama, Mississippi, New Mexico, and Wyoming.
Click here to see the states adding the most jobs since the Great Recession.
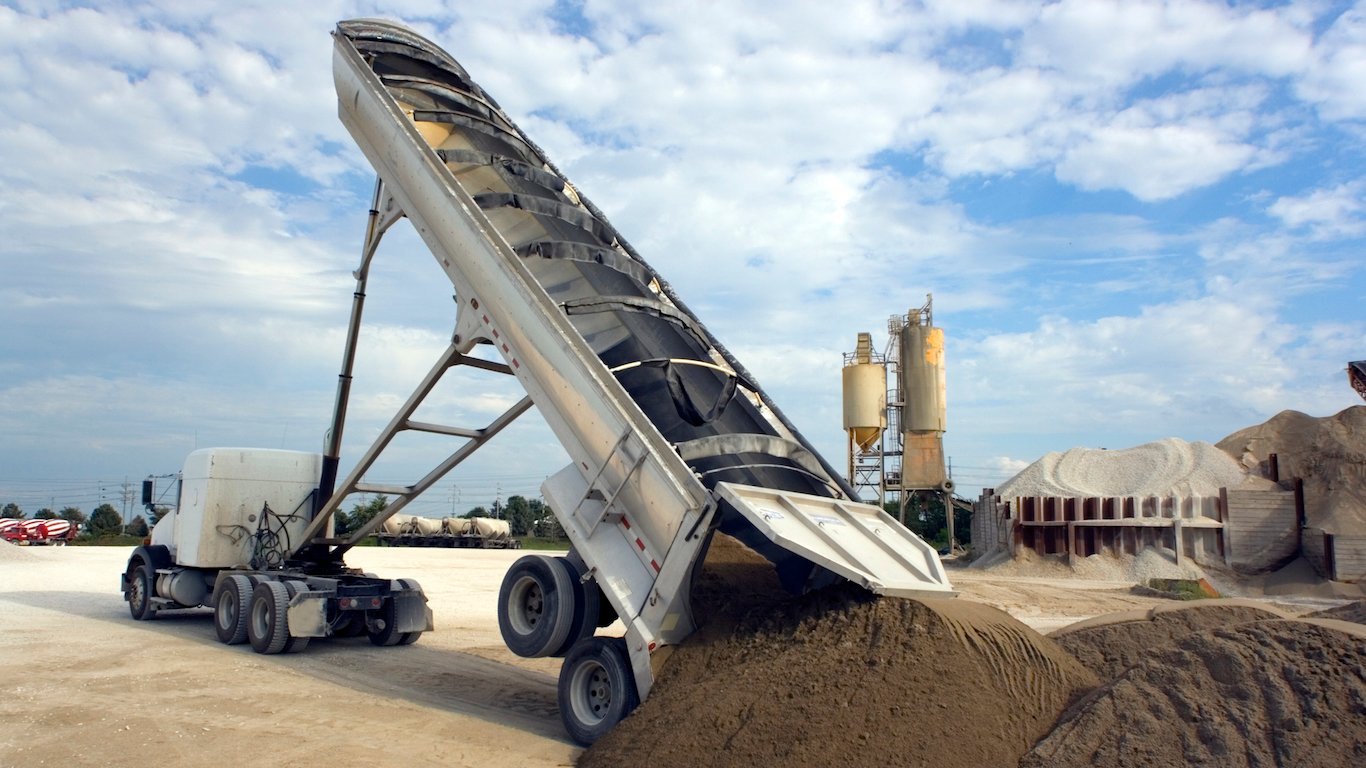
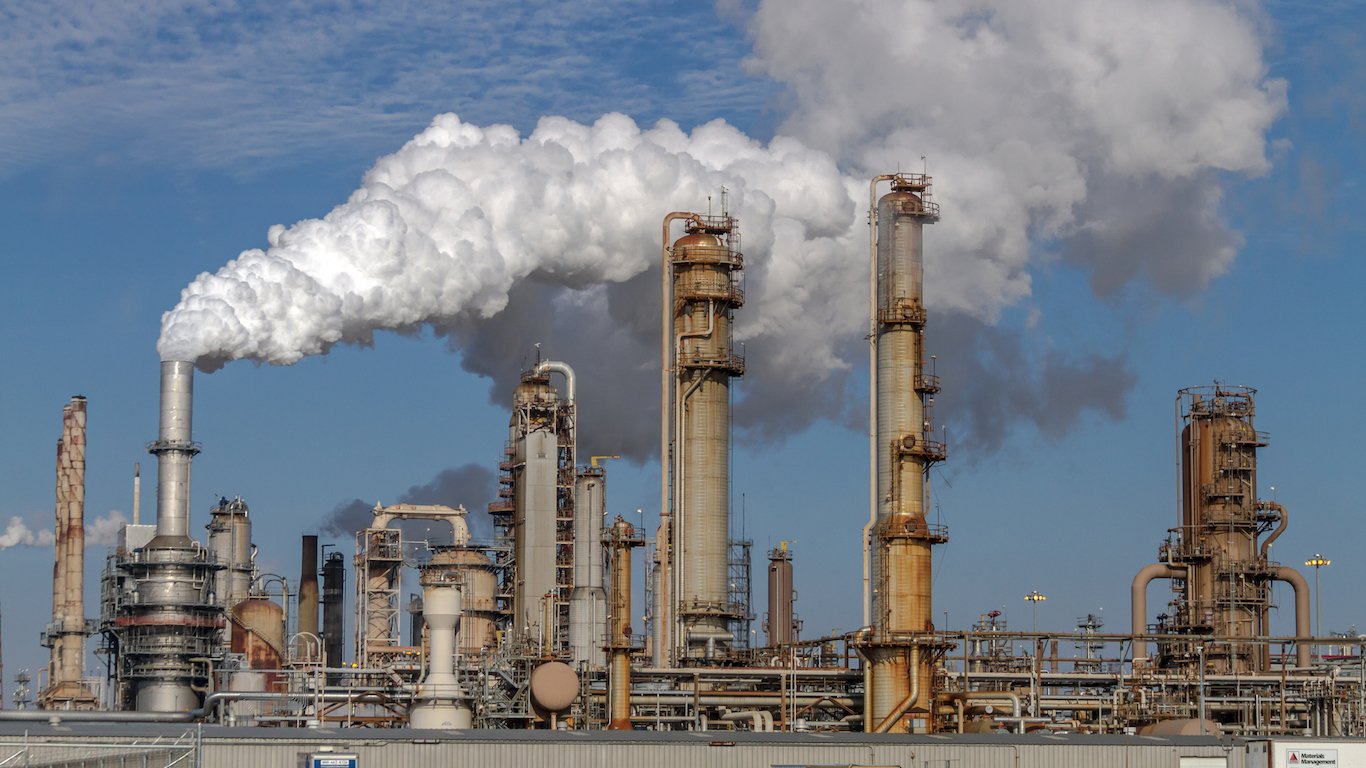
Today, there are 1.4 million fewer construction jobs in the United States than there were a decade ago, the largest employment decline of any industry. “We really have not had a solid recovery in the construction industry from the burst in the housing bubble,” Kohli said. New home construction bottomed out in 2009 at 553,900 new projects and has yet to return to the decade-long peak of 1.4 million housing units started in 2007. Construction was the biggest drag on employment growth in 28 states, hitting Arizona, California, Nevada, and Florida especially hard.
On the other hand, total employment has increased in the vast majority of states over the last 10 years. Employment growth ranged from 0.1% in New Jersey to 20.7% in North Dakota. Texas, the state with the second highest proportional employment growth, at 15.3%, had the largest increase in total employment, at more than 1.6 million workers.
Employment growth in the U.S. was driven primarily by the education, health care and social services sector. Nationwide, the sector netted an addition of some 4.4 million new workers. “The aging of the population is one of the things that’s been driving job growth in health care,” Kohli explained. Driven primarily by the health care industry, the sector was the biggest contributor to employment growth in all but three states, often accounting for over 100,000 new jobs.
In some states, such as North Dakota and Texas, employment growth was also largely attributable to gas fracking and oil exploration.
The degree to which the number of jobs increased by state depended largely on the skill level of the state’s labor force and its industrial composition. It appears as though newer jobs tend to require a higher education. The share of adults with a bachelor’s degree increased by the same amount or more as the national increase in eight of the 10 states with the largest proportional rise in employment over the decade. In regards to overall job growth among states, Kohli added, it seems that “having an educated labor force was definitely a positive thing.”
To identify the states with the most and least job growth, 24/7 Wall St. reviewed employment changes in each state from December 2007 through December 2016. State totals, as well as the relative increase in each state’s employment came from Bureau of Labor Statistics’ Local Area Unemployment Statistics database. Educational attainment, median household income, and industry composition are as of 2015, unless otherwise specified, and are the most recent figures available from the U.S. Census Bureau’s American Community Survey. All references to proportional or nominal changes in jobs or workers in this piece refer to total employment change.

50. Wyoming
> 10-yr. employment change: -5.2%
> Employment change: -15,400
> Dec. unemployment: 4.8%
> Total employment: 278,700
Total employment declined in only seven states over the past decade, and in no state was the decline as severe as in Wyoming. State employment fell by more than 15,000, or by 5.2% — more than double the next largest percent decline. The state’s unemployment rate, as might be expected, increased by 2.0 percentage points — a larger increase than in all states other than New Mexico. The state’s construction sector shed about 4,500 employed workers, the most of any sector in the state.
While the agriculture, forestry, fishing, and mining sector, which includes energy extraction, added jobs over the decade, this trend may reverse soon. The state, which produced 42% of the nation’s coal in 2015, has recently shed jobs as energy prices have bottomed.
[in-text-ad]

49. Mississippi
> 10-yr. employment change: -2.3%
> Employment change: -26,700
> Dec. unemployment: 5.6%
> Total employment: 1,133,600
The number of employed workers in Mississippi has decreased by 26,700 since the end of 2007. The state’s 2.3% decade-long employment decline is the second largest decrease in the country over the same time period. As in many other states, the fastest declining industries in Mississippi have been construction and manufacturing. Nationwide, the construction sector has been hit by the housing crisis, which slowed new home construction to a crawl. Manufacturing was hurt by increasing reliance on automation and outsourcing to other countries, which has cut costs for companies but decimated jobs.
Despite the dwindling number of working adults in the state, the share of Mississippi’s labor force looking for work is 0.3 percentage points lower today than it was 10 years ago, as even more people gave up looking for work altogether. Still, at 5.6%, Mississippi’s unemployment rate is higher than in all but six other states.
[recirclink id=373752]

48. New Mexico
> 10-yr. employment change: -2.2%
> Employment change: -18,600
> Dec. unemployment: 6.6%
> Total employment: 830,500
New Mexico has shed some 18,600 jobs since 2007, a 2.2% employment decline. Over the same time period, the state’s unemployment rate has increased by 2.6 percentage points, the largest 10-year increase of any state. Today, some 6.6% of New Mexico’s labor force is out of a job, a far higher share than the 4.7% national unemployment rate. As jobs have become increasingly scarce, serious financial hardship has become all the more common in New Mexico. The share of state residents living in poverty increased from 18.1% in 2007 to 20.4% in 2015.
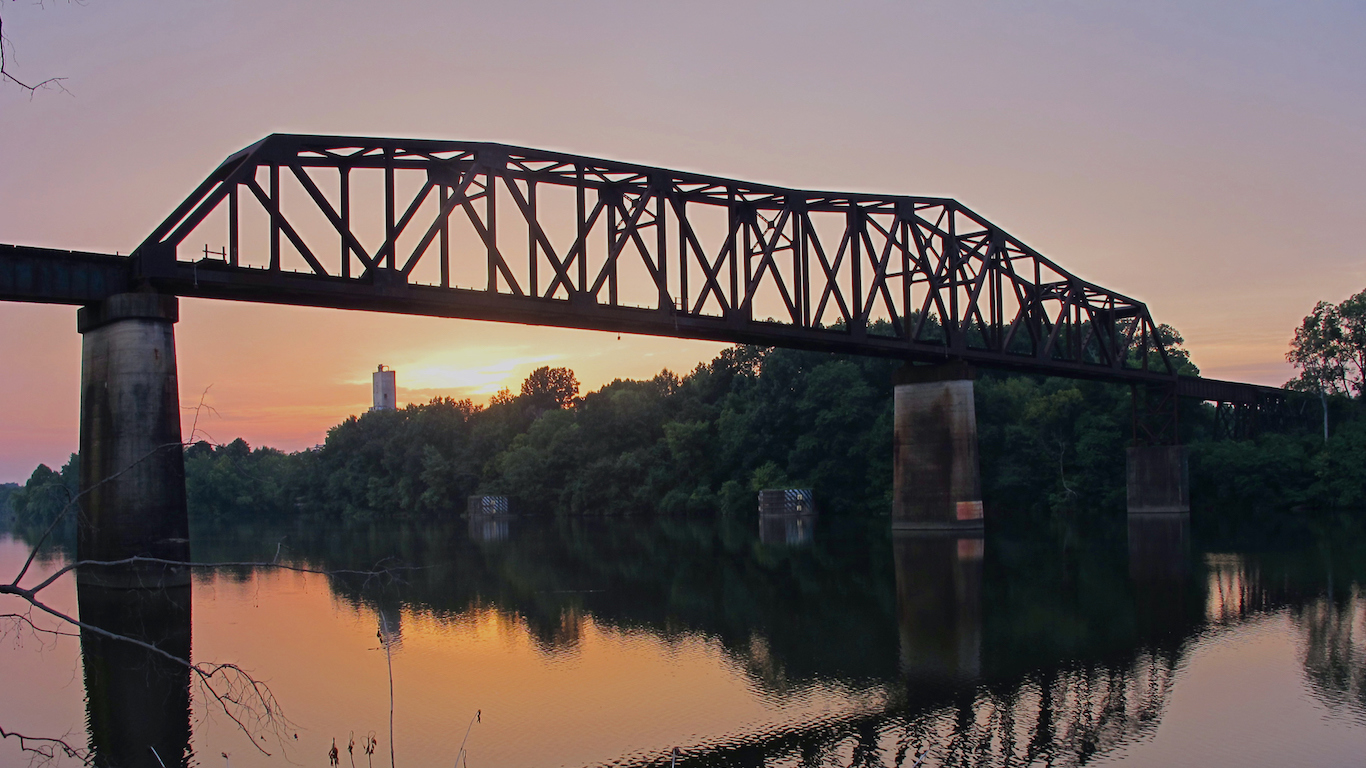
47. Alabama
> 10-yr. employment change: -1.9%
> Employment change: -38,700
> Dec. unemployment: 6.2%
> Total employment: 1,976,200
Alabama is one of only seven states to report overall employment decline over the last 10 years. As was the case across the country, the construction sector shed more jobs than any other industry in Alabama. Nationwide, residential construction in particular was hit hard by the recession. Only 553,900 new home construction projects began in 2009, a staggering decline from 1.4 million in 2007. Though, new home construction has recovered somewhat nationwide since hitting bottom in 2009, in Alabama, there are 42,264 fewer people employed in the construction industry since 2007. As was also the case across the country, job losses in the construction industry were partially offset by employment gains in the educational services, health care, and social assistance industry.
[in-text-ad-2]
46. Connecticut
> 10-yr. employment change: -1.6%
> Employment change: -27,300
> Dec. unemployment: 4.4%
> Total employment: 1,678,000
Connecticut lost more employed workers in the past 10 years than any other state in the Northeast. There are about 1.7 million people employed in the state today, 27,300 fewer than in 2007. Unlike most states that lost jobs in the past decade, educational attainment is high in Connecticut. Some 38.3% of adults in the state have at least a bachelor’s degree, a far higher share than the 30.6% of adults nationwide.
The state’s manufacturing sector employment has has shed over 28,000 since 2007, the most of any industry in the state.

45. Maine
> 10-yr. employment change: -1.6%
> Employment change: -9,800
> Dec. unemployment: 3.8%
> Total employment: 610,900
Maine is one of just seven states to report employment declines since the end of 2007. In most of these seven states, the unemployment rate rose as well during this period and has remained relatively high. In Maine, on the other hand, unemployment fell by 1.1 percentage points, a greater improvement than in most states. The state’s current unemployment rate, at 3.8%, is well below the 4.7% national unemployment rate. The unemployment rate fell even as jobs declined because unemployed individuals left the labor force faster than total employment declined.
[in-text-ad]
44. West Virginia
> 10-yr. employment change: -0.4%
> Employment change: -2,700
> Dec. unemployment: 5.9%
> Total employment: 763,700
With a 5.9% jobless rate, unemployment is more of a problem in West Virginia than in all but a handful of other states. The state’s high unemployment rate is partially due to a dwindling number of employment options. As is the case in only half a dozen other states, there are fewer jobs in West Virginia today than there were 10 years ago.
The largest employment declines in the state were in industries that often have little educational barriers to entry such as manufacturing, mining, and construction. Job losses in these industries likely disproportionately affected members of the state’s labor force who lack a college education. Only 19.6% of adults in the state have earned a bachelor’s degree, the smallest share of any state in the country.
[recirclink id=375074]
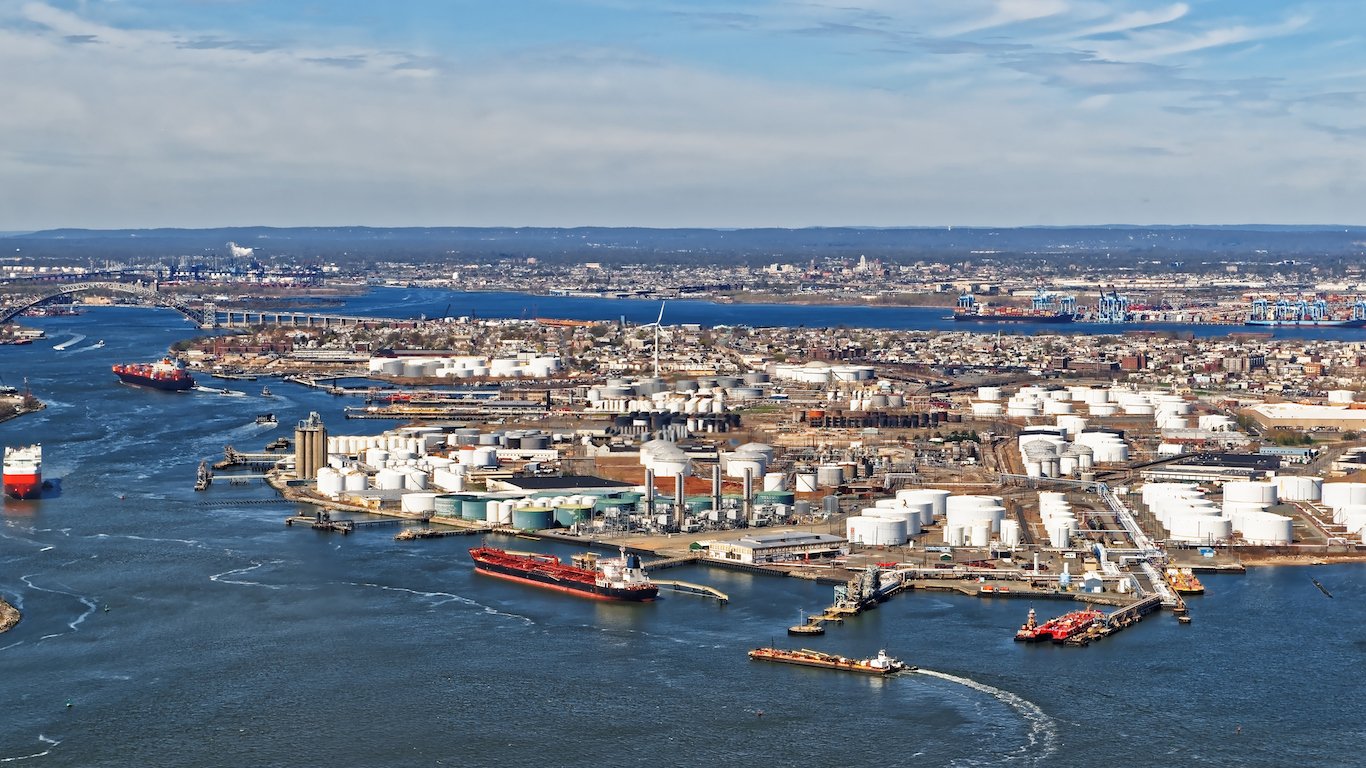
43. New Jersey
> 10-yr. employment change: +0.1%
> Employment change: 2,800
> Dec. unemployment: 4.7%
> Total employment: 4,086,400
Of all states to add jobs in the last 10 years, New Jersey’s employment growth was the most modest at 0.1%. There are about 4.1 million people working in the Garden State today, an increase of only 2,800 from 2007. Mirroring a nationwide trend, the largest employment gains in New Jersey were in the education, health care and social assistance sector, while the manufacturing industry shed the most jobs.
While New Jersey’s job growth was modest, many state residents who are working are very well compensated. The typical New Jersey household earns $72,222 a year, more than in all but three other states.
42. Illinois
> 10-yr. employment change: +0.3%
> Employment change: 17,400
> Dec. unemployment: 5.7%
> Total employment: 6,002,600
Employment in Illinois increased by 17,400 in the last decade, a 0.3% increase and the second smallest percentage gain of any state in the country. Modest job gains in the state have not been enough to meaningfully reduce unemployment. Today, unemployment in Illinois stands at 5.7%, a full percentage point higher than the U.S. unemployment rate.
Multiple sectors in Illinois, including wholesale trade, manufacturing, and finance and insurance, have shed jobs since 2007. No industry was hurt as badly as construction however. Nationwide, there are 1.4 million fewer people employed in construction jobs now than there were in 2007. Some 76,000 of those jobs were lost in Illinois.
[in-text-ad-2]
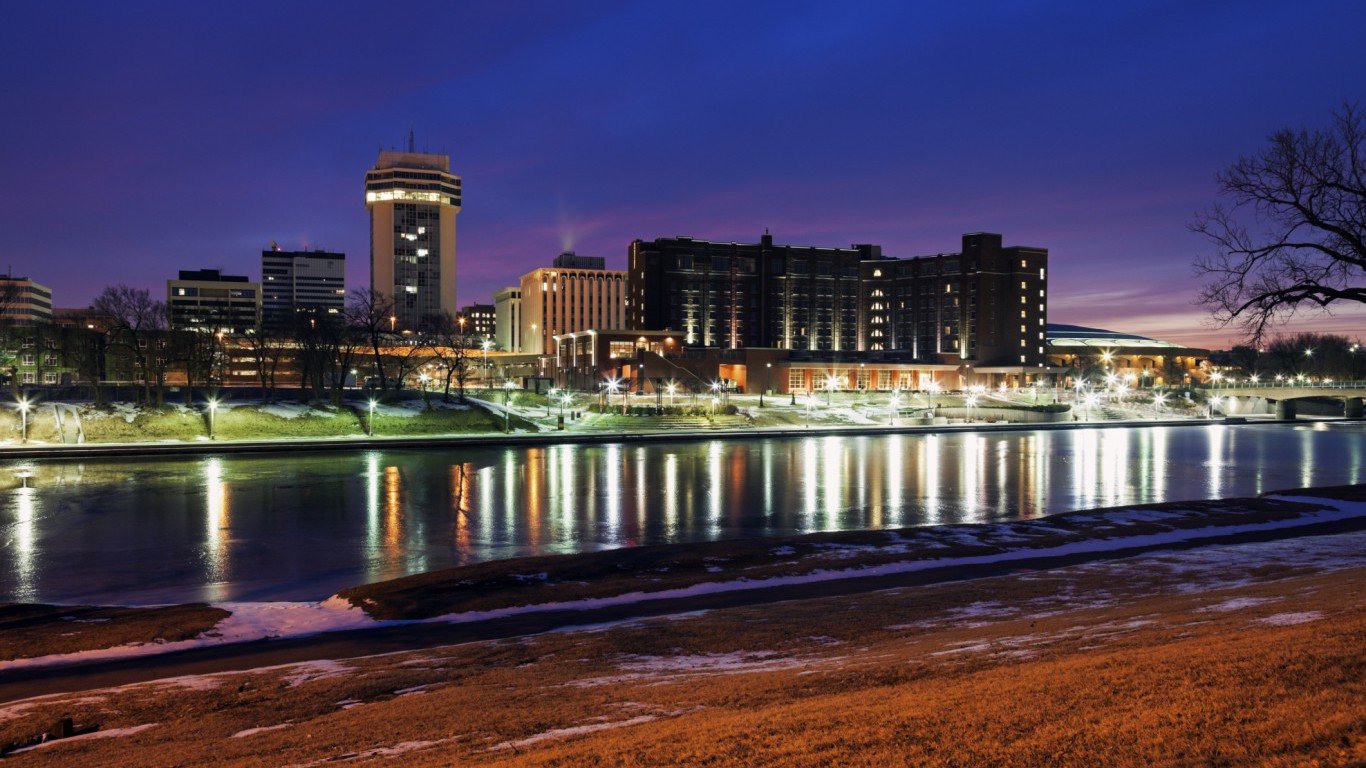
41. Kansas
> 10-yr. employment change: +0.4%
> Employment change: 5,600
> Dec. unemployment: 4.2%
> Total employment: 1,392,400
With only 5,600 jobs added over the past decade, employment growth in Kansas has been a lackluster 0.4%. The vast majority of U.S. states had more rapid employment growth than Kansas. Despite the sluggish job growth, incomes grew faster than average in the state. The typical Kansas household earns $53,906 a year, $6,455 more than it did in 2007. Meanwhile, the median income across all U.S. households went up by only $5,035 over the same time period.
In Kansas, manufacturing jobs disappeared more rapidly than jobs in any other sector. Across the United States, increased reliance on automation and robotics, in addition to outsourcing, have reduced demand for manufacturing workers. Today, there are about 22,600 fewer workers employed in Kansas than there were a decade ago.
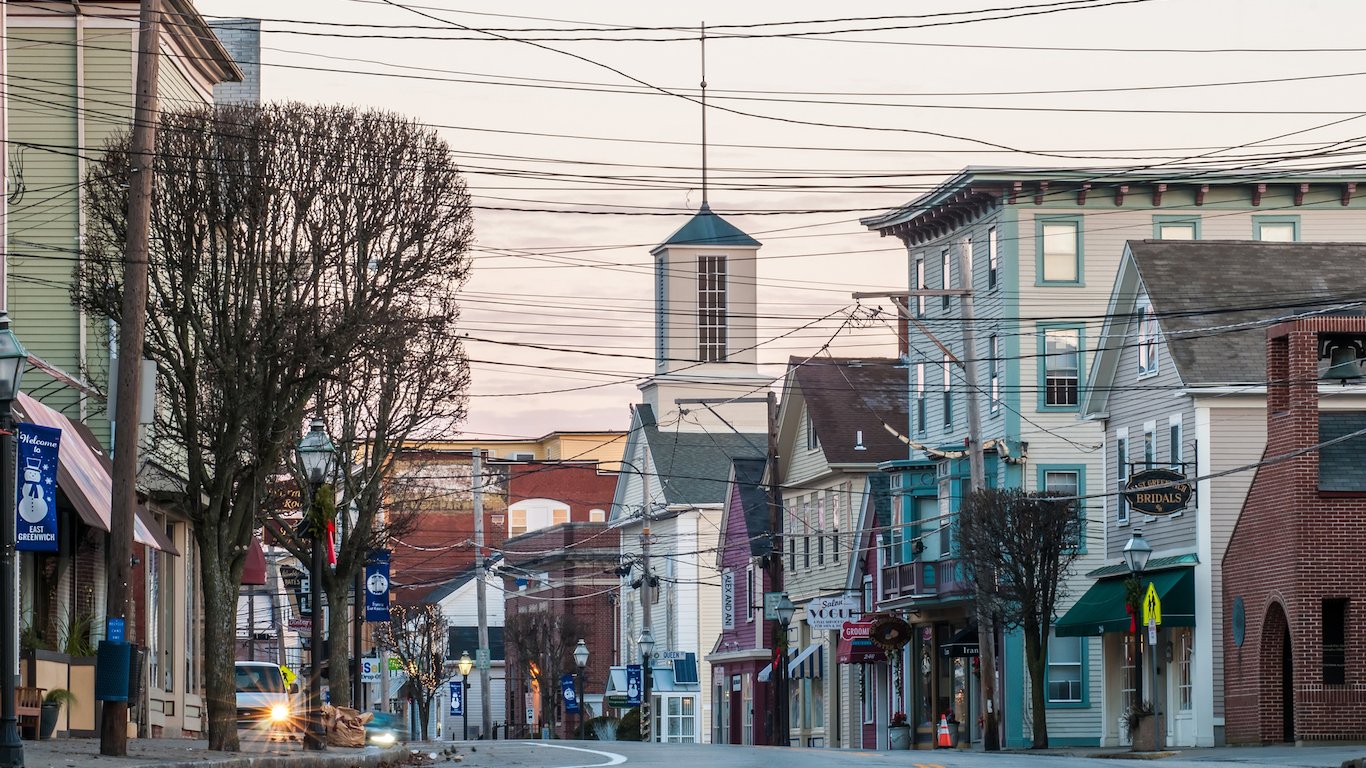
40. Rhode Island
> 10-yr. employment change: +0.9%
> Employment change: 4,300
> Dec. unemployment: 5.0%
> Total employment: 492,100
During the Great Recession, Rhode Island was hit especially hard — home prices declined more than in most states in the region, and more jobs were lost. Still, the state appears to have largely recovered. Rhode Island’s unemployment rate of 5% is slightly higher than the national unemployment rate of 4.7%, but the state’s rate is nevertheless a 1.1 percentage points improvement from a decade prior, when unemployment was 6.1%. Only four states had a larger unemployment rate decline over that period. The state’s construction industry, however, does not appear to have fully recovered, as about 5,600 fewer people are employed in the industry compared to 2007.
[in-text-ad]

39. Nevada
> 10-yr. employment change: +1.1%
> Employment change: 14,100
> Dec. unemployment: 5.1%
> Total employment: 1,306,000
Nevada employment increased by about 14,000 over the past decade. This represents a 1.1% increase, a much smaller rise than in the vast majority of states. Compared to ten years ago, the state’s unemployment rate remained unchanged at 5.1%, 12th highest of all states. Dragging down the state’s employment growth has been the construction sector, which shed nearly 50,000 jobs since 2007. Most of these losses were the result of the subprime mortgage crisis, which hit Nevada’s housing market particularly hard and from which the state is still recovering. The state’s construction sector has contracted by 37.5% compared to 2007. A decade ago, more than 10% of the state’s total employment was in construction, but currently the sector represents only 6.2% of the Nevada’s employment.
[recirclink id=375074]

38. Arizona
> 10-yr. employment change: +1.4%
> Employment change: 37,600
> Dec. unemployment: 4.8%
> Total employment: 2,717,000
Arizona’s economy has added roughly 37,600 jobs since 2007, just a 1.4% increase. This relatively modest employment growth has not been enough meet growing demand for jobs. The share of the state’s labor force looking for work increased from 4.4% in December 2007 to 4.8% in December 2016, one of the larger unemployment rate increases of any state over the same 10-year period.
States with strong job growth tend to have a more highly-educated population than those with more modest growth. In Arizona, only 27.7% of adults have a bachelor’s degree, a smaller share than the 30.6% of adults nationwide who do.

37. Pennsylvania
> 10-yr. employment change: +1.5%
> Employment change: 88,600
> Dec. unemployment: 5.6%
> Total employment: 5,900,100
Job growth in Pennsylvania over the past decade trails that of most states. There are 5.9 million people working in the Keystone State today, up only 1.5% from 10 years ago. While job growth has been modest, incomes among workers in Pennsylvania have increased somewhat faster than than incomes nationwide. A decade ago, the typical household in Pennsylvania earned only $48,576 a year, slightly less than the $50,740 national median income. Today, the state’s median annual household income of $55,702 is in line with the national $55,775 median income.
While the typical Pennsylvania household earns about as much as the national median, serious financial hardship is less common in the state than it is nationwide. Only 13.2% of Pennsylvanians live in poverty, slightly below the 14.7% national poverty rate.
[in-text-ad-2]
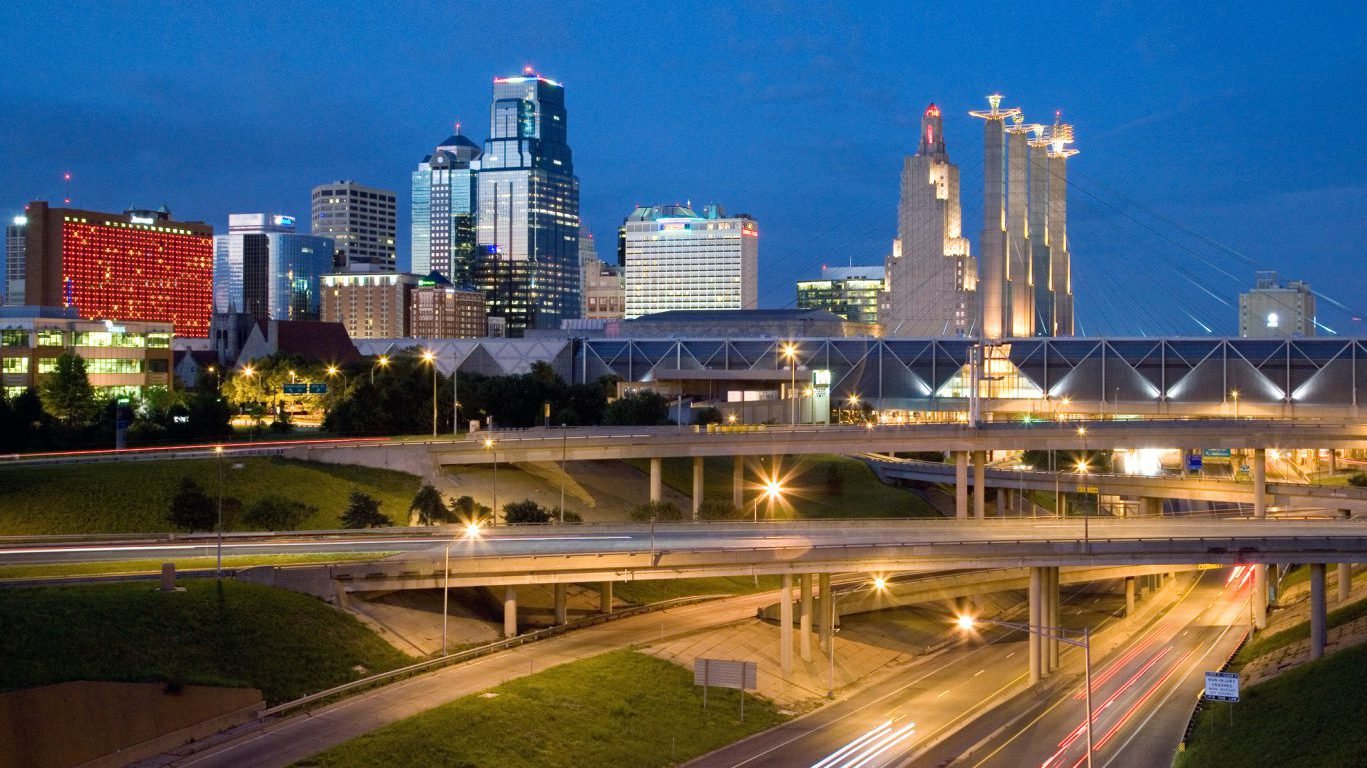
36. Missouri
> 10-yr. employment change: +1.6%
> Employment change: 45,400
> Dec. unemployment: 4.4%
> Total employment: 2,847,800
Missouri’s total employment has increased by a relatively modest 1.6% since 2007. The biggest contributor to the state’s job growth appears to have been the education, healthcare, and social assistance sector, which added about 79,000 to total employment between 2007 and 2015. While employment in other sectors depends on regional economies, education and government jobs tend to increase to meet growing population demands. However, even as the state added significantly to its education and healthcare workforce, the number of public administration jobs fell by about 4,000.
35. Ohio
> 10-yr. employment change: +1.8%
> Employment change: 97,600
> Dec. unemployment: 4.9%
> Total employment: 5,517,200
Ohio employment rose by 1.8% over the past decade, which is a smaller increase than the vast majority of states. The state, which has been struggling with long-term economic issues, was also hard hit during the subprime housing crisis and subsequent Great Recession. A Rust Belt state, Ohio has been dealing with decades of job losses in the manufacturing sector. More recently, since 2007, manufacturing employment fell by more than 50,000, a 6% decline. Construction slumped in many states during the recession, and Ohio’s already relatively small construction industry declined even further and has not recovered. Construction employment in the state declined by 14.1%.
[in-text-ad]

34. Wisconsin
> 10-yr. employment change: +1.9%
> Employment change: 55,200
> Dec. unemployment: 4.0%
> Total employment: 2,932,800
By at least one measure, Wisconsin’s economy has recovered from the effects of the recession. The state’s unemployment rate, which stood at 4.8% in December 2007, peaked at 9.2% in December 2009. To date, the rate improved to 4%, better than the U.S. unemployment rate of 4.7%. However, the state’s substantial manufacturing sector remains diminished as a result of the recession. The number of state workers employed in manufacturing fell by about 2% from 2007. The share of state workers employed in manufacturing fell from 19.4% in 2007 to 18.4% today, representing a decline in total sector employment of 12,245.
[recirclink id=375074]

33. Arkansas
> 10-yr. employment change: +2.0%
> Employment change: 24,600
> Dec. unemployment: 3.9%
> Total employment: 1,232,200
The number of employed workers in Arkansas has increased by a modest 2.0% in the last decade. This 24,600 increase in total employment has put a dent in the state’s unemployment rate. Currently at 3.9%, the share of the state’s labor force out of work is lower than the 4.7% national unemployment rate and 1.3 percentage points below the state’s unemployment rate 10 years prior.
Despite some modest economic improvements, Arkansas remains one of the poorest states in the country. The typical household in the state earns only $41,995 a year, the second lowest median income of any state. In addition, 19.1% of Arkansas residents live in poverty, well above the 14.7% national poverty rate.

32. Louisiana
> 10-yr. employment change: +2.1%
> Employment change: 39,900
> Dec. unemployment: 6.1%
> Total employment: 1,975,400
Employment in Louisiana has climbed by 39,900 in the last decade, a 2.1% increase. Despite the job growth, Louisiana’s unemployment rate increased by 2.0 percentage points over the past decade. Its current unemployment rate is 6.1%, well above the 4.7% national unemployment rate.
Many Americans receive health insurance coverage from their employers. Likely due in part to Louisiana’s modest job growth and widespread unemployment, the state’s uninsured rate is a higher than average. Nearly 12% of Louisiana’s population is uninsured, one of the higher rates of any state.
[in-text-ad-2]
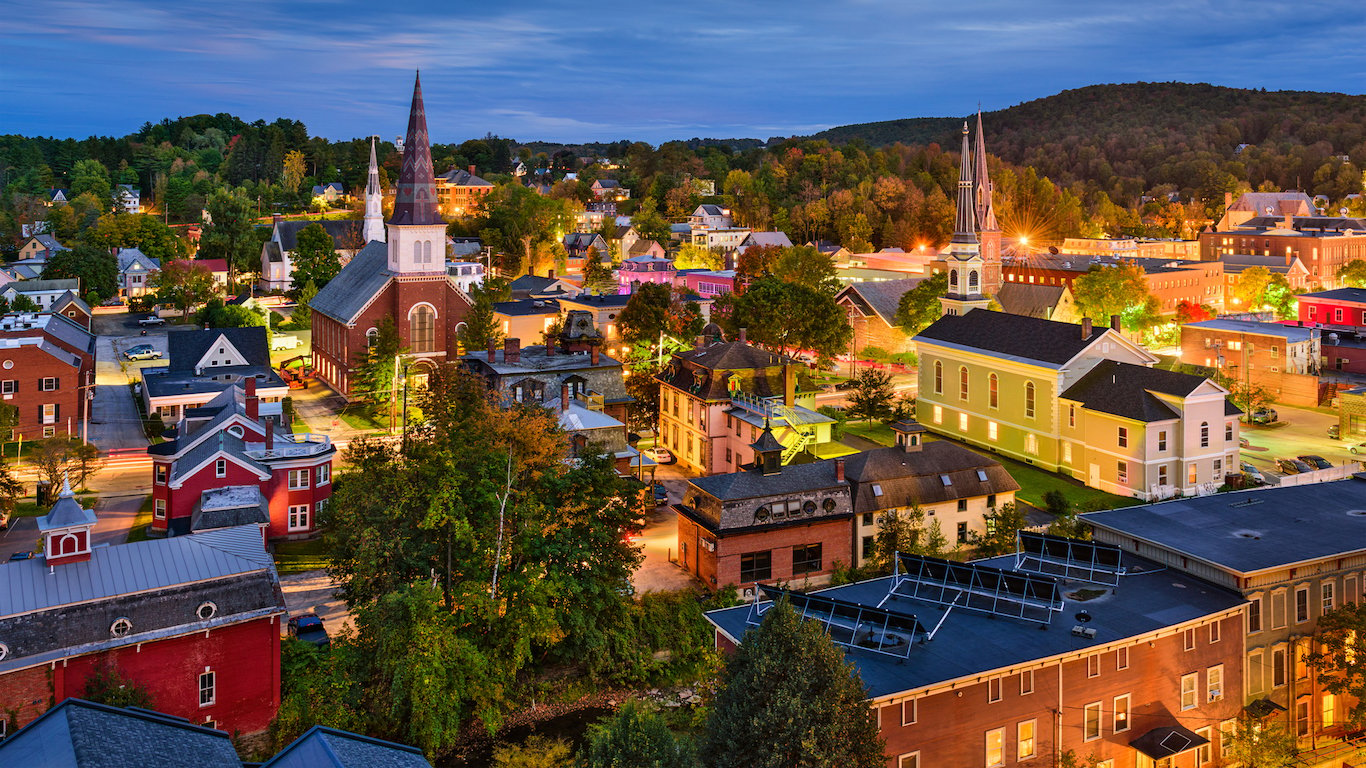
31. Vermont
> 10-yr. employment change: +2.4%
> Employment change: 7,300
> Dec. unemployment: 3.1%
> Total employment: 315,800
Compared with most states, Vermont weathered the recession exceptionally well. After 2007, unemployment in the state peaked in May 2009 at 7%, well below the peak reached in the vast majority of states. Similarly, while job markets in most states have yet to return to prerecession levels, Vermont’s current unemployment rate of 3.1% is lower than it was in December 2007 and one of the lowest in the nation.
Attaining a college degree is one of the most reliable paths to stable employment, and Vermont residents’ high levels of education may partially account for the state’s history of enduring economic challenges. Of adults in the state, 36.9% have a bachelor’s degree, seventh highest of all states and up from 33.6% of adults in 2007.
30. Michigan
> 10-yr. employment change: +2.8%
> Employment change: 118,200
> Dec. unemployment: 5.0%
> Total employment: 4,363,600
Michigan was hit especially hard during the 2008 economic downturn. Unemployment in the state peaked at 14.9% in June 2009, the highest post-recession unemployment level any state over the past decade. However, Michigan’s jobless rate improved to 5.0% as of December 2016, dropping by 9.9 percentage points from the peak in 2009 — the largest improvement of all states.
Although the nation’s manufacturing sector has declined in recent decades, a high share of Michigan’s workforce remains employed by the industry. Michigan’s manufacturing sector employs 18.1% of the state’s workforce, versus the national percentage of 10.3% and third highest of all states.
[in-text-ad]

29. Indiana
> 10-yr. employment change: +3.0%
> Employment change: 90,600
> Dec. unemployment: 4.0%
> Total employment: 3,083,700
Over the last decade, Indiana employment increased by 90,600. The uptick helped reduce the ranks of jobless state workers, as unemployment fell by 0.8 percentage points to 4.0% over the same period.
Compared with other states, however, Indiana’s employment growth is modest. Income growth in the state was even more modest. Indiana’s median annual household income has increased by only $3,084 since 2007. Meanwhile, the typical American household now earns $5,035 more than it did in 2007.
[recirclink id=375074]
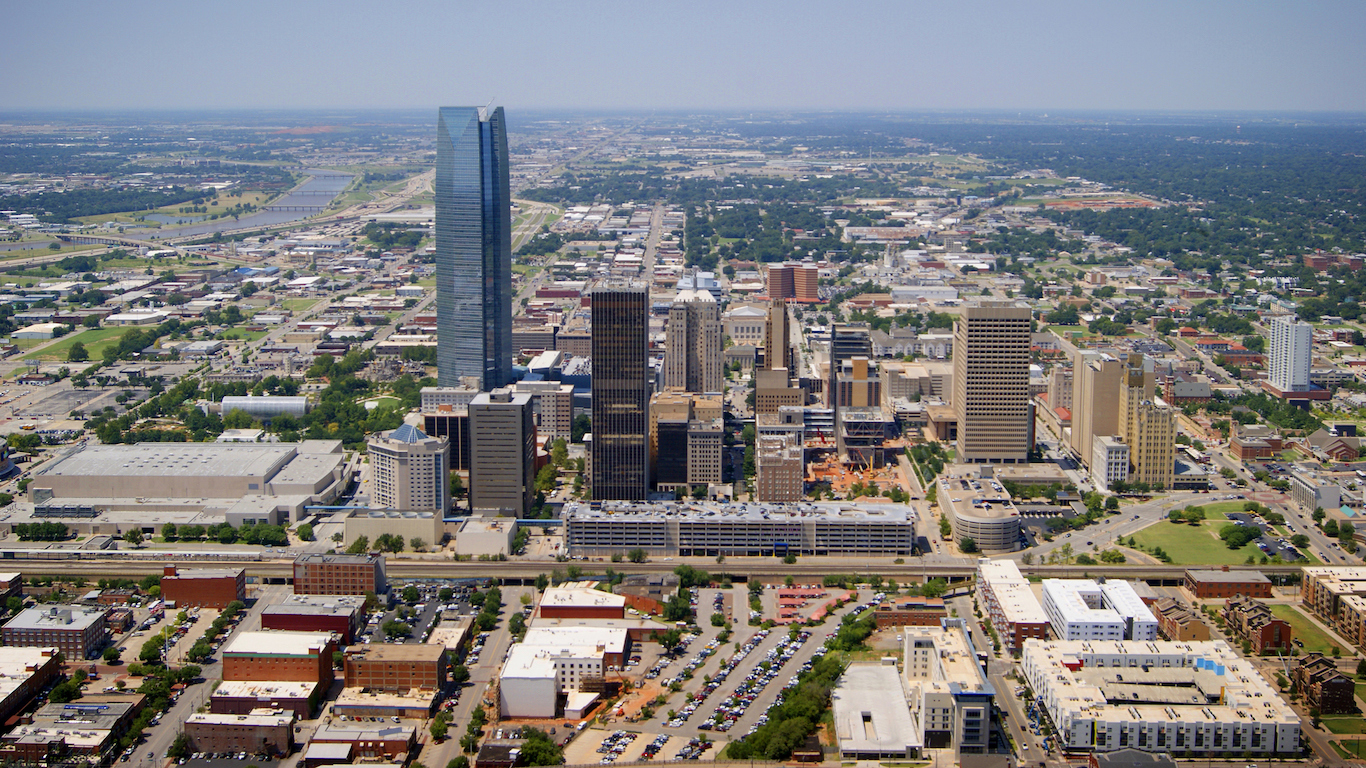
28. Oklahoma
> 10-yr. employment change: +3.2%
> Employment change: 51,200
> Dec. unemployment: 5.0%
> Total employment: 1,657,500
Oklahoma’s 5.0% unemployment rate is well below the state’s 7.1% 10-year peak in December 2009. Despite recovering from some of the worst effects of the recession, unemployment in the state remains 1.4 percentage points higher than it was in December 2007.
In the last 10 years, total employment in the state has increased by a modest 3.2%, slower than in the majority of other states. The manufacturing, wholesale trade, and information sectors were each a drag on employment growth, shedding thousands of jobs in the last 10 years.

27. Kentucky
> 10-yr. employment change: +3.3%
> Employment change: 61,600
> Dec. unemployment: 4.8%
> Total employment: 1,919,400
Employment in Kentucky has increased by 62,000 over the past decade. The 3.3% increase fell slightly behind job growth in most states over the same period. One drag on growth was the state’s transportation and warehousing industry. There were 121,386 workers employed in the industry in 2007, accounting for 6.4% of Kentucky’s labor force, the third highest share among states. By 2015, the industry had shed over 8,000 jobs, and the share of people working in the industry fell to 5.9%.
[in-text-ad-2]
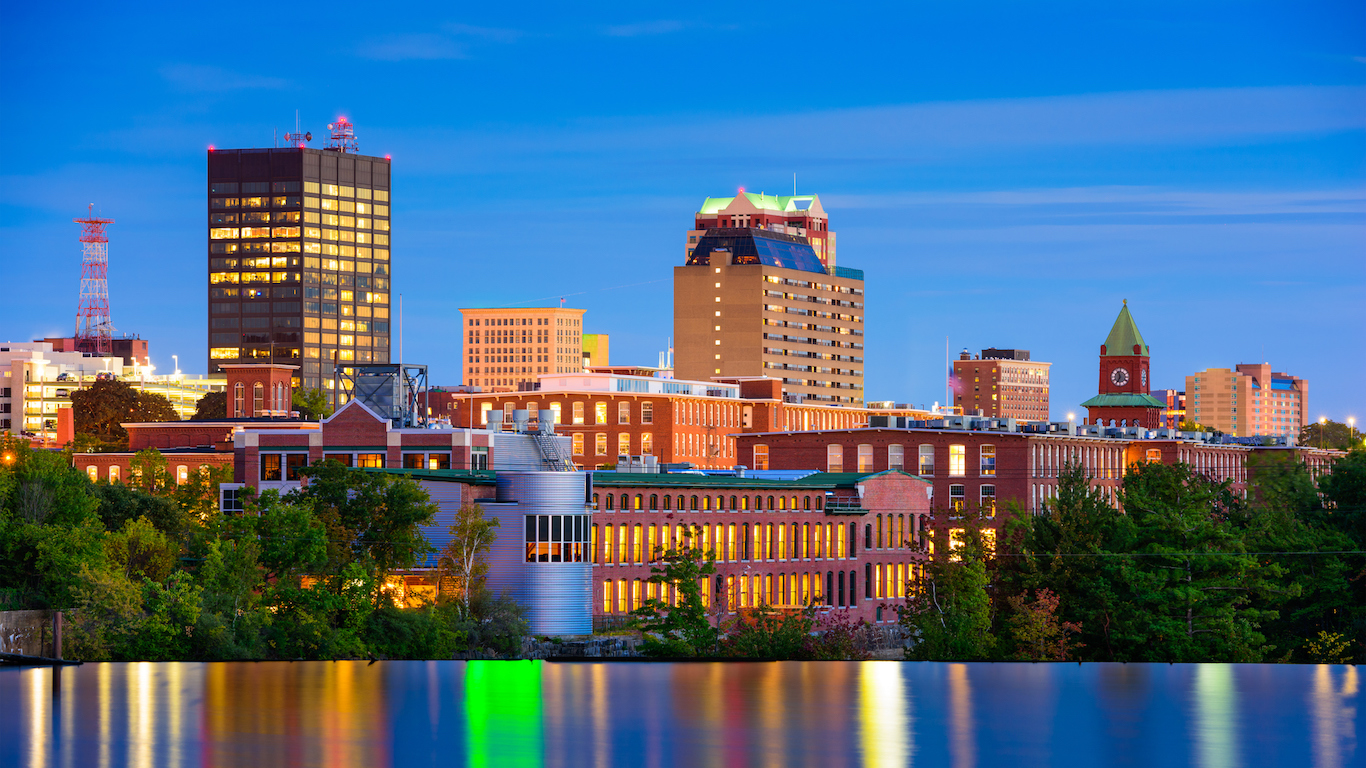
26. New Hampshire
> 10-yr. employment change: +3.4%
> Employment change: 22,200
> Dec. unemployment: 2.6%
> Total employment: 672,600
After Massachusetts, New Hampshire had the most robust growth in employment of any New England state over the last 10 years. There are 22,200 more jobs in New Hampshire today than there were a decade ago. This growth has helped reduce unemployment across the state. Down by nearly a full percentage point since December 2007, New Hampshire’s unemployment rate stands at 2.6%, the lowest of any state in the country.
Not only has the number of jobs increased across the state, but so too have incomes. The typical New Hampshire household earns $70,303 a year, nearly $8,000 more than in 2007. In comparison, incomes nationwide have increased by only about $5,000.
25. Iowa
> 10-yr. employment change: +3.8%
> Employment change: 57,200
> Dec. unemployment: 3.6%
> Total employment: 1,582,100
During the recession, Iowa’s economy remained relatively stable compared to most states. While in many state unemployment figures exceeded a 10-year peak of 10%, Iowa’s unemployment rate peaked at only 6.6% in May 2009. Both prior to and after the recession, the state has had among the lowest unemployment in the country. Iowa’s current unemployment rate of 3.6% is 10th lowest among states. The state’s manufacturing sector added over 17,000 jobs during that time, a 7.3% increase. The state was one of the few to have a substantial increase in manufacturing jobs over the past decade.
[in-text-ad]

24. Maryland
> 10-yr. employment change: +3.9%
> Employment change: 101,500
> Dec. unemployment: 4.2%
> Total employment: 2,713,400
The typical Maryland household earns $75,847 a year, the highest of all states. A high median income is partially attributable to both the availability and the types of jobs in the state. High paying jobs often require at least a college degree, and in Maryland 38.8% of adults have a bachelor’s degree, nearly the largest share of any state in the country. Maryland has added over 100,000 jobs since 2007, a 3.9% increase. The new jobs have not been enough to help reduce unemployment, however. In December 2007, only 3.6% of Maryland’s labor force were out of a job, slightly lower than the state’s current 4.2% jobless rate.
[recirclink id=375074]
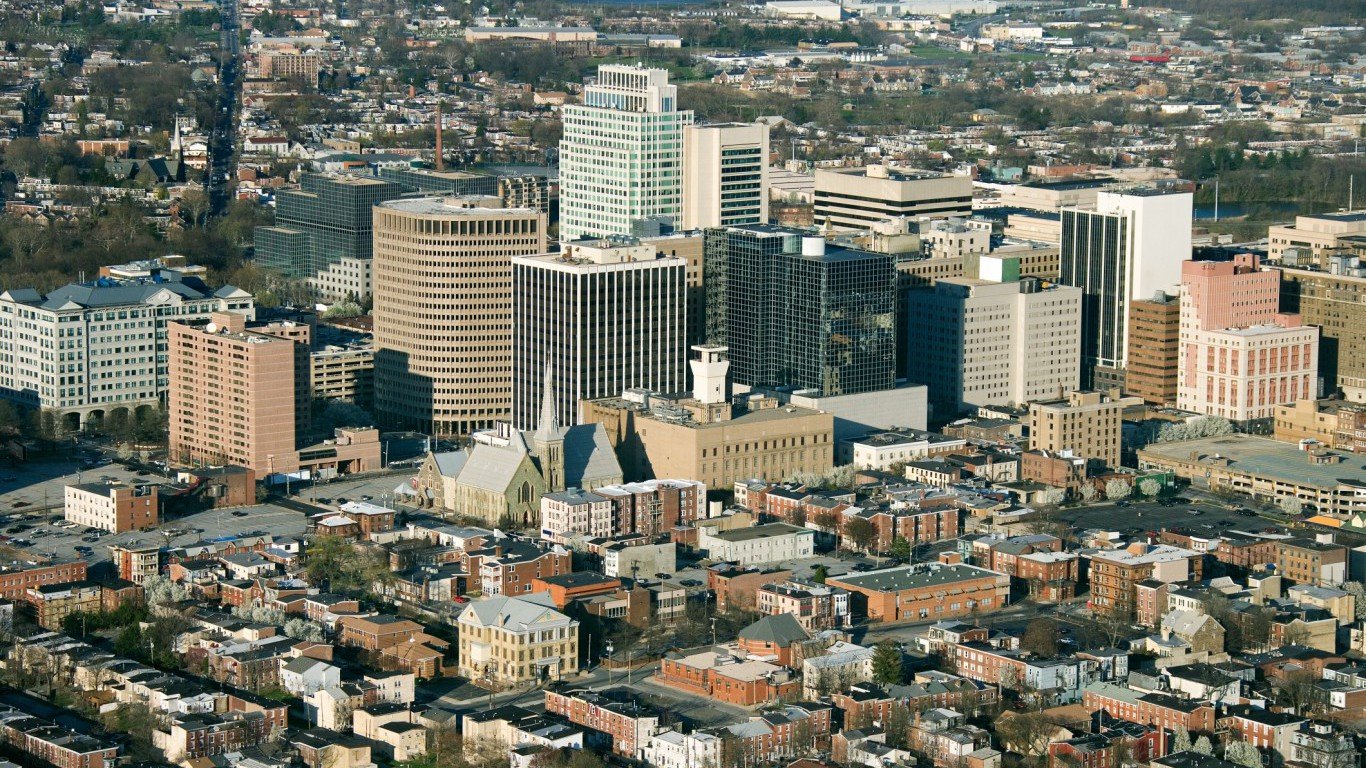
23. Delaware
> 10-yr. employment change: +4.1%
> Employment change: 17,900
> Dec. unemployment: 4.3%
> Total employment: 458,500
There are some 458,500 people employed in Delaware today, about 17,900 more than in 2007. As was the case in many states, the construction and manufacturing sectors were major drags on state employment, each shedding thousands of jobs over the past decade. Those losses were more than offset by employment gains in the educational services, health care and social assistance sector, which added over 23,000 new jobs since December 2007.
Despite the 4.1% uptick in the number of jobs in the state, unemployment is slightly higher today that it was 10 years ago. An estimated 4.3% of the state’s labor force is out of a job, compared to only 3.7% in December 2007.
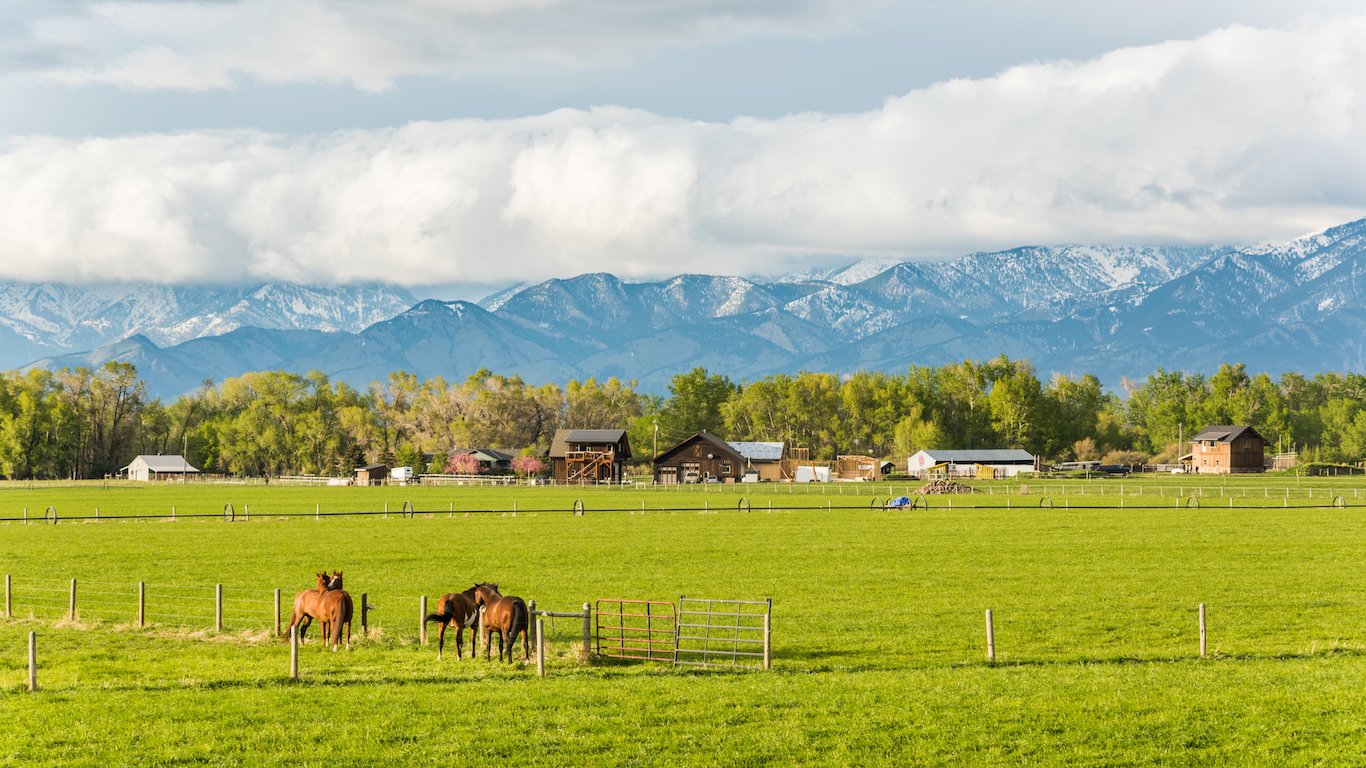
22. Montana
> 10-yr. employment change: +4.2%
> Employment change: 18,800
> Dec. unemployment: 4.0%
> Total employment: 465,300
The housing crisis was especially damaging in Montana, slamming the state’s relatively large construction sector as well as lowering demand for wood products from the state. The sector appears to have recovered, however, as net employment increased by over 1,000 jobs compared to December 2007. The state’s job market as a whole appears to have recovered as well, Montana’s current unemployment rate of 4.0% is lower than the national rate and lower than pre-recession levels.
Over the last decade, employment in Montana’s Manufacturing, wholesale trade, and retail industries fell. However, according to the Montana Department of Labor and Industry, strong job growth is expected in the state in all three sectors.
[in-text-ad-2]

21. Hawaii
> 10-yr. employment change: +4.3%
> Employment change: 27,200
> Dec. unemployment: 2.9%
> Total employment: 655,200
Hawaii’s current unemployment rate of 2.9% is nearly the lowest of all states. Even during the depths of the recession, Hawaii’s economy was better off than that of most states. Unemployment peaked at 7.3% in May 2009, lower than the peaks seen in most other states during and after the crisis. Hawaii’s arts, entertainment, accommodation and food services sector employs 15.9% of the state’s workforce, the second highest proportion after only Nevada. Like across the nation, employment in the sector grew substantially over the last 10 years — by 19.6%.

20. North Carolina
> 10-yr. employment change: +4.6%
> Employment change: 192,400
> Dec. unemployment: 5.1%
> Total employment: 4,360,200
Unemployment in North Carolina spiked severely following the Great Recession, reaching a peak of 11.3% in January 2010. The state has recovered since then, with current unemployment at 5.1%, effectively the same as it was prior to the recession. Since 2007, employment in North Carolina has increased by about 192,000, a 4.6% increase that exceeds that of most states over the last decade. A large share of the state’s job growth came in the professional and scientific sector, which added over 95,000 workers since 2007, a 24% increase.
[in-text-ad]

19. Virginia
> 10-yr. employment change: +4.6%
> Employment change: 174,700
> Dec. unemployment: 4.1%
> Total employment: 3,951,700
At 4.6%, employment growth in Virginia over the last 10-years has outpaced employment growth in most states. The state has added 174,700 jobs since December 2007, bringing total employment up to nearly 4 million.
Job growth in the state has not been enough to keep up with demand for work, however, as Virginia’s unemployment rate is 0.6 percentage points higher than it was a decade ago. Still, at 4.1%, the share of the state’s labor force that is out of a job is lower than the 4.7% national unemployment rate and well below the 7.4% 10-year unemployment rate peak in Virginia.
[recirclink id=375074]
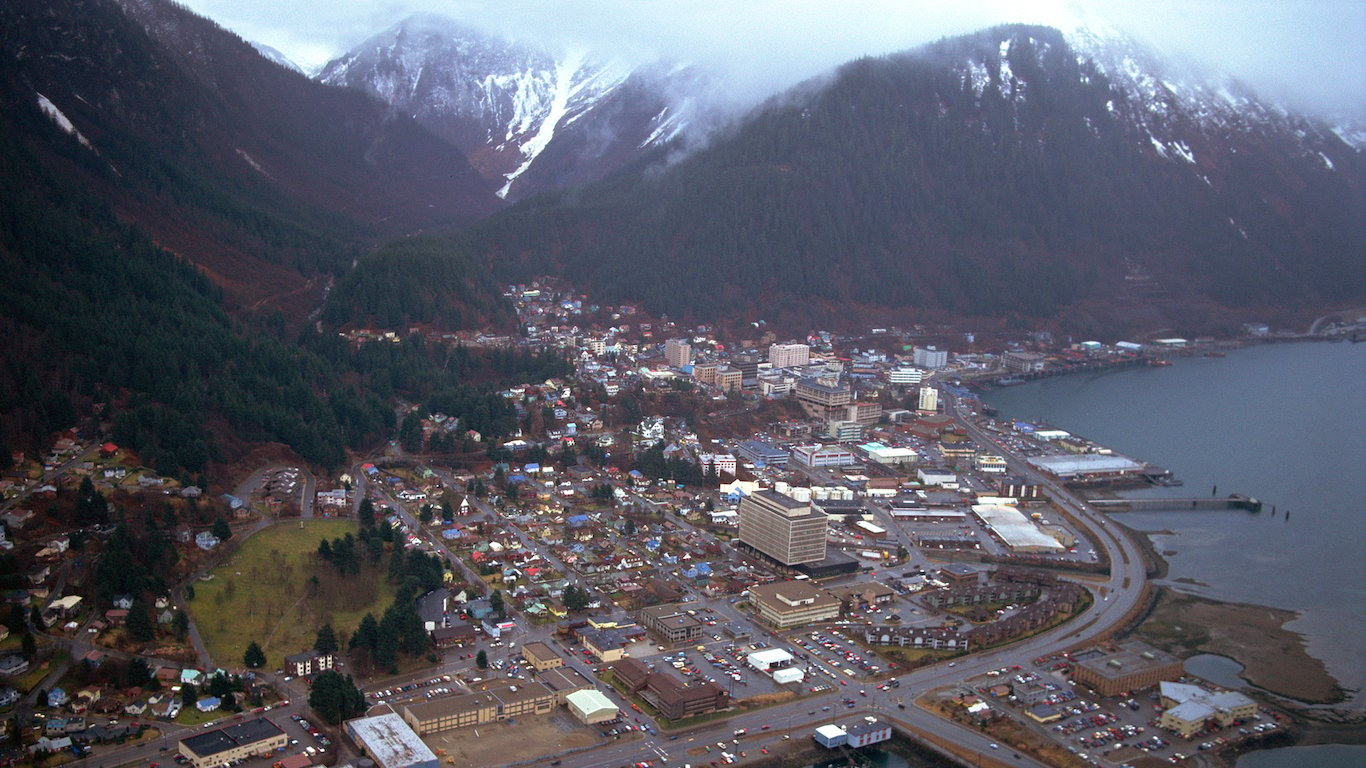
18. Alaska
> 10-yr. employment change: +5.2%
> Employment change: 16,600
> Dec. unemployment: 6.7%
> Total employment: 334,600
Alaska’s 6.7% unemployment rate is the highest of any state. Despite a 5.2% increase in the number of jobs in the state over the past decade, unemployment has only gotten worse. Now 0.3 percentage points higher than in December 2007, Alaska’s unemployment rate has recovered only modestly from a post-recession high of 8.0%.
After shedding thousands of construction and manufacturing jobs in the last decade, Alaska’s economy now relies more on a single sector. Some 11.7% of the state’s workforce is now employed in public administration, the largest share of any state and more than double the comparable 4.6% national share.
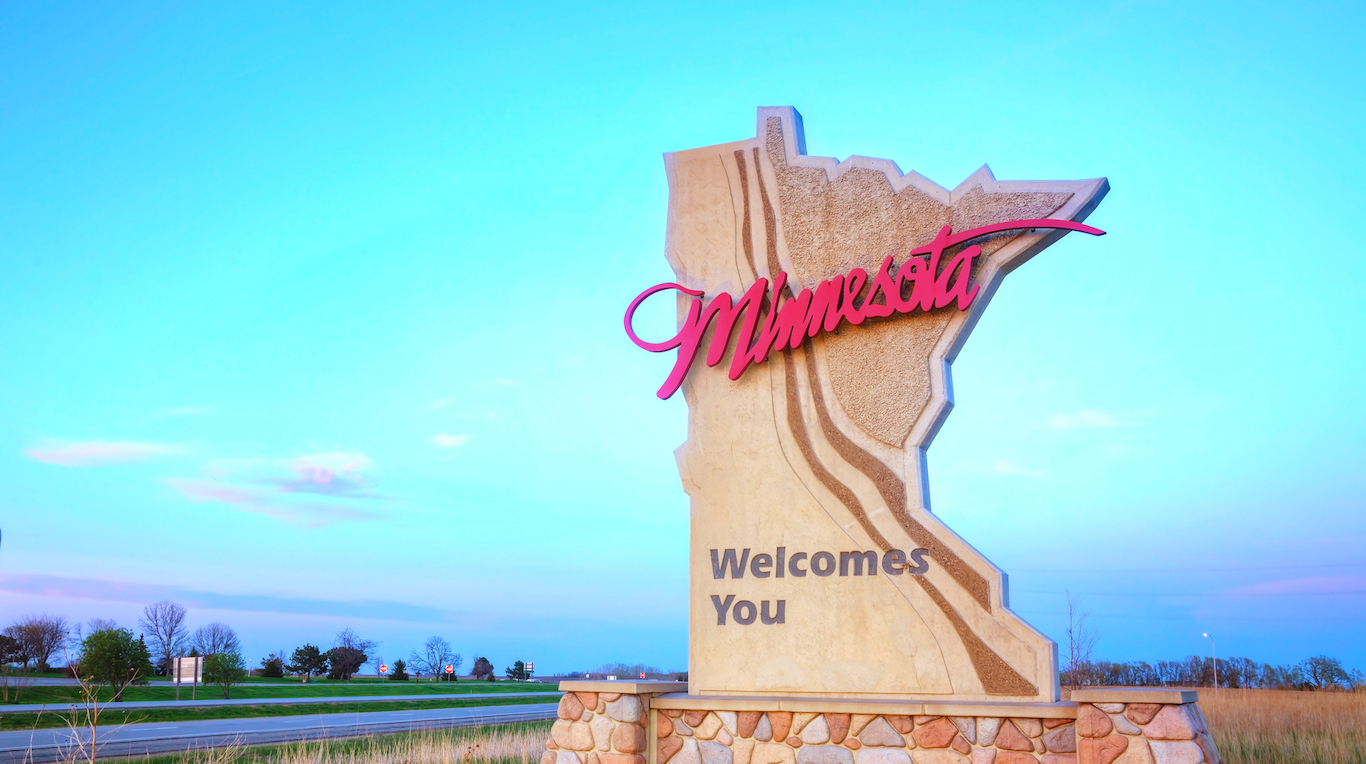
17. Minnesota
> 10-yr. employment change: +5.3%
> Employment change: 148,000
> Dec. unemployment: 3.9%
> Total employment: 2,919,300
Minnesota added 148,000 jobs over the past decade, a 5.3% increase. During that time, the state’s unemployment rate fell from 4.7% to 3.9%, compared to a current U.S. unemployment rate of 4.7%. The state’s healthy employment growth and low unemployment rate may be partially the result of its skilled labor force. Roughly 35% of the state’s adults have a bachelor’s degree, and 92.8% have a high school diploma, the 10th and third highest shares among states, respectively.
[in-text-ad-2]
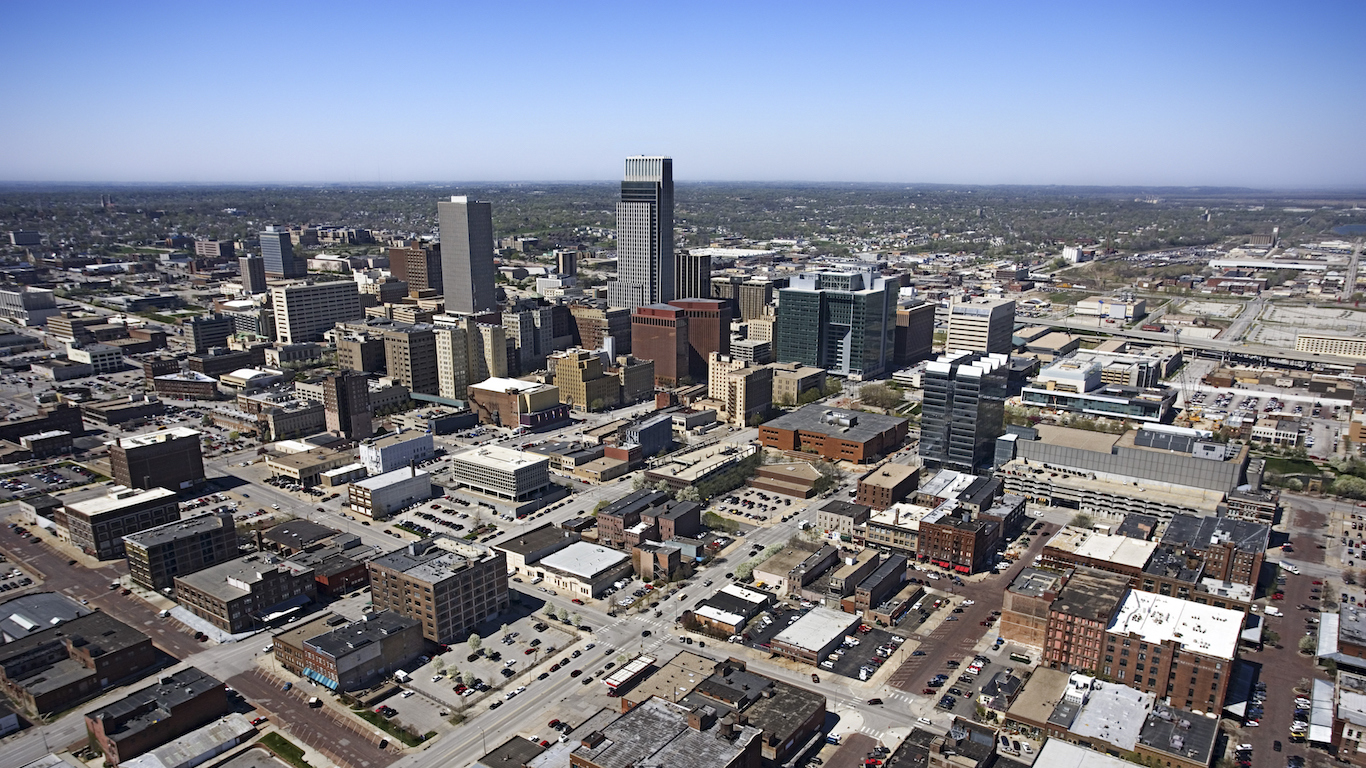
16. Nebraska
> 10-yr. employment change: +5.5%
> Employment change: 53,600
> Dec. unemployment: 3.4%
> Total employment: 1,021,300
Nebraska added some 53,600 jobs in the last 10 years, bringing the total number of workers in the state to over a million. Despite the 5.5% uptick in employment, the share of the state’s labor force looking for work rose over the same period. Nebraska’s unemployment rate increased from 3.0% in December 2007 to 3.4% in December 2016.
While joblessness is a bigger problem than it was a decade ago in Nebraska, it remains well below the 4.7% national unemployment rate. Nebraska was also one of only a few states to escape the recession relatively unscathed. Unemployment in the state peaked at 4.8% in January 2009, the lowest post-recession unemployment peak of any state except North Dakota.

15. South Carolina
> 10-yr. employment change: +6.2%
> Employment change: 120,900
> Dec. unemployment: 4.3%
> Total employment: 2,070,100
South Carolina’s economy has improved significantly over the past decade, with employment increasing by more than 120,000. Over the same time period, unemployment has fallen 1.4 percentage points to 4.3%, one of the biggest improvements of any state. Unemployment has fallen even more dramatically from the state’s post-recession peak of 11.7% in December 2009.
As was the case nationwide, the housing crisis and recession significantly hurt the construction industry, which shed more jobs than any other sector in South Carolina. Unlike most states, however, the manufacturing sector was a boon for South Carolina’s economy. The sector added some 16,000 jobs over the last 10 years.
[in-text-ad]

14. Georgia
> 10-yr. employment change: +6.3%
> Employment change: 263,100
> Dec. unemployment: 5.4%
> Total employment: 4,433,400
Adding some 263,100 jobs, employment in Georgia has increased by 6.3% over the last 10 years. The state’s robust job growth was bolstered by the manufacturing industry, which has been in steep decline nationwide. Across the United States, more than 600,000 manufacturing jobs have been lost since 2007. Georgia was one of only a handful of states to add manufacturing jobs in the last 10 years.
While few states have added as many jobs as Georgia, wage growth in the Peach State has been tepid. The state median household income has increased by only $2,108 in since 2007, less than half the $5,035 median income growth nationwide.
[recirclink id=375074]

13. Tennessee
> 10-yr. employment change: +6.6%
> Employment change: 184,000
> Dec. unemployment: 4.9%
> Total employment: 2,989,500
Employment growth in Tennessee outpaced growth in most states. With 184,000 new jobs added in the last 10 years, there are now nearly 3 million people working in the state. The increased employment opportunities in the state outpaced demand for jobs as the unemployment rate fell 0.6 percentage points over the same period.
Many industries that tend to have little educational requirements for employees, such as construction and manufacturing, shed tens of thousands of jobs in Tennessee over the past decade. Meanwhile, the industries that added the most jobs, like the professional, scientific, and management sector, tend to require some postsecondary education. In keeping with the changing demands of the job market, the share of adults with at least a bachelor’s degree in Tennessee grew from 21.8% in 2007 to the current share of 25.7%.
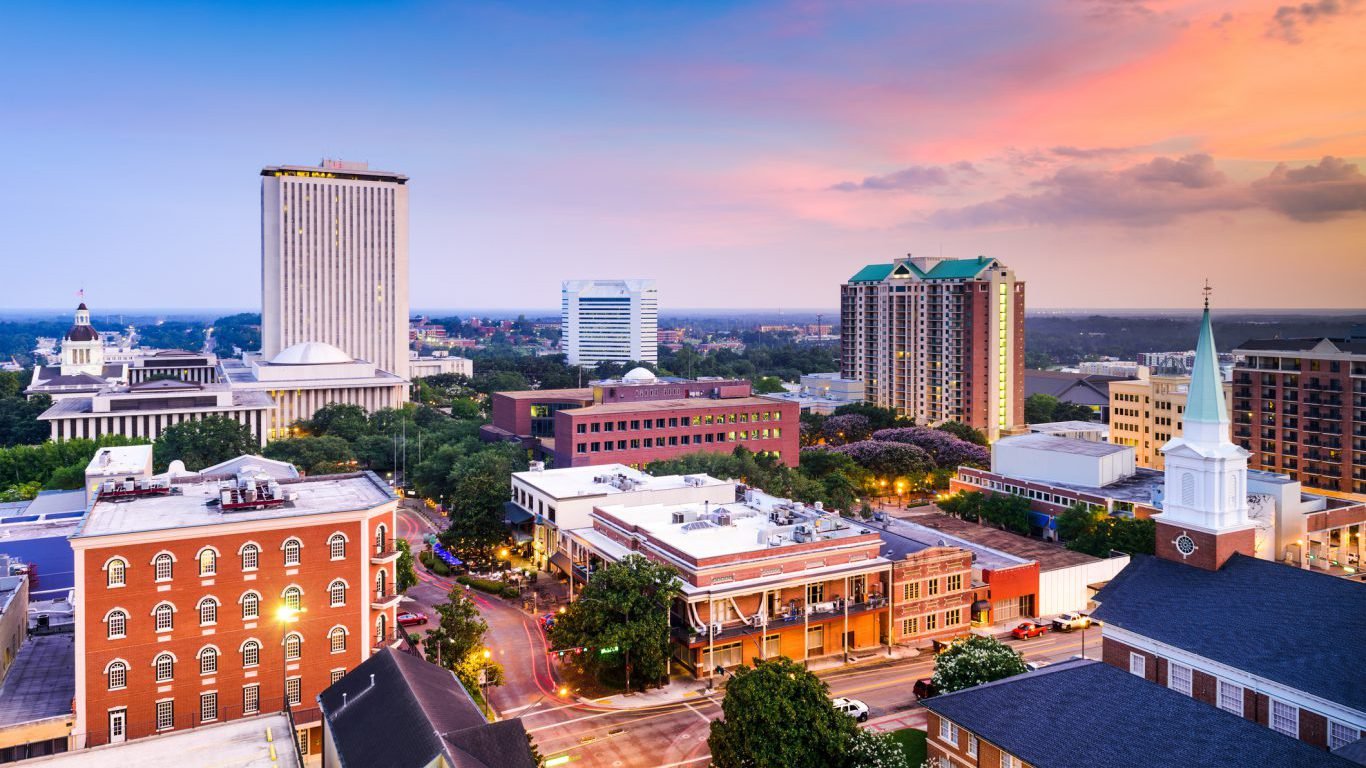
12. Florida
> 10-yr. employment change: +6.7%
> Employment change: 531,100
> Dec. unemployment: 4.9%
> Total employment: 8,462,900
Florida added over half a million new jobs in the past decade, increasing employment by 6.7%. Florida’s housing market was hit especially hard by the recession, and partially as a result, the construction industry was a major drag on employment growth, employing 200,000 less people today compared to 2007.
Driven primarily by educational services and health care, employment growth in Florida outpaced growth in most states. However, incomes in the Sunshine State were relatively stagnant. The typical Florida household now earns $49,426 a year, only $1,622 more than a decade ago. The national median household income increased by $5,035 over the same period.
[in-text-ad-2]
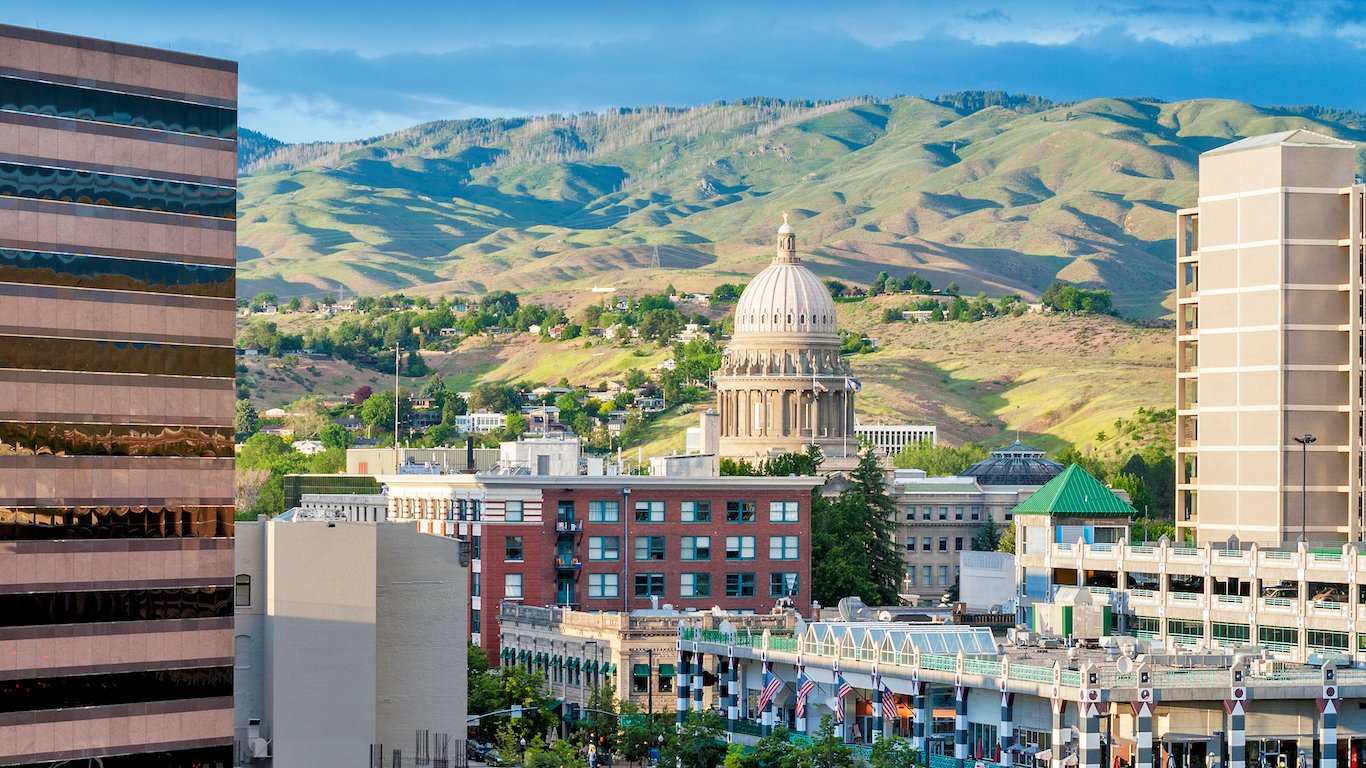
11. Idaho
> 10-yr. employment change: +6.7%
> Employment change: 44,200
> Dec. unemployment: 3.7%
> Total employment: 700,700
Idaho has one of the healthiest economies of any state. In the last 10 years, employment has increased by 6.7%, more rapidly than in the vast majority of states. The increasing number of jobs in the state were not enough to lower unemployment, however. Some 3.7% of Idaho’s labor force is out of a job, up from 3.2% in December 2007. Still, unemployment in the state falls below the national unemployment rate by a full percentage point.
While employment has increased rapidly in Idaho, incomes have not. The typical Idaho household earns $48,275 a year, only about $2,000 more than the median household income a decade ago. Median income across the United States increased by about $5,000 over the same period.
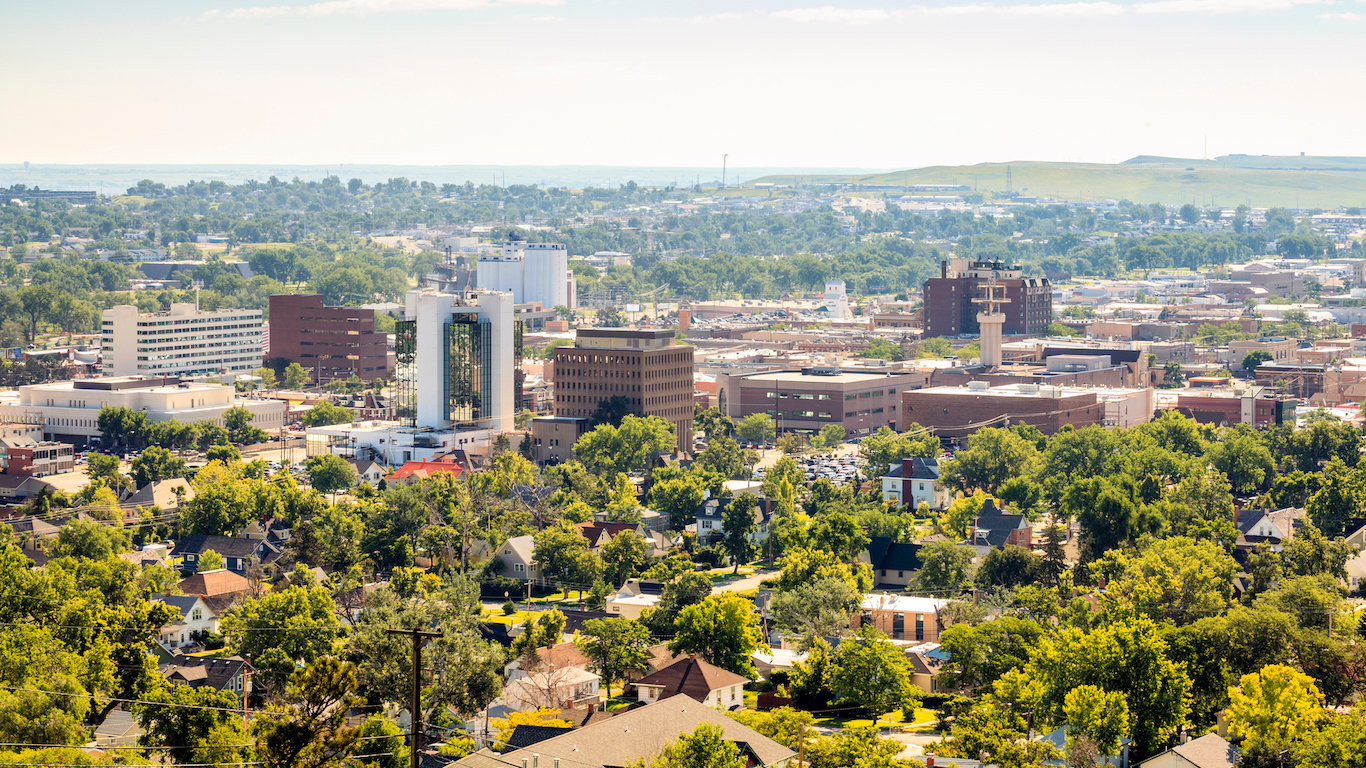
10. South Dakota
> 10-yr. employment change: +7.1%
> Employment change: 29,000
> Dec. unemployment: 2.8%
> Total employment: 437,300
While it did not enjoy the economic boom that North Dakota did, South Dakota still added over the past decade close to 30,000 jobs, a 7.1% increase. The state also maintained a relatively healthy unemployment rate during that time, with the state’s rate peaking at just 5.2%. South Dakota’s current unemployment rate of 2.8% is the third lowest in the country, even as the state’s substantial agriculture, forestry, fishing, hunting, and mining sector shed about 3,500 workers since 2007. As of 2015, 6.7% of South Dakota’s workers were employed in the sector, the fourth highest share in the country.
[in-text-ad]
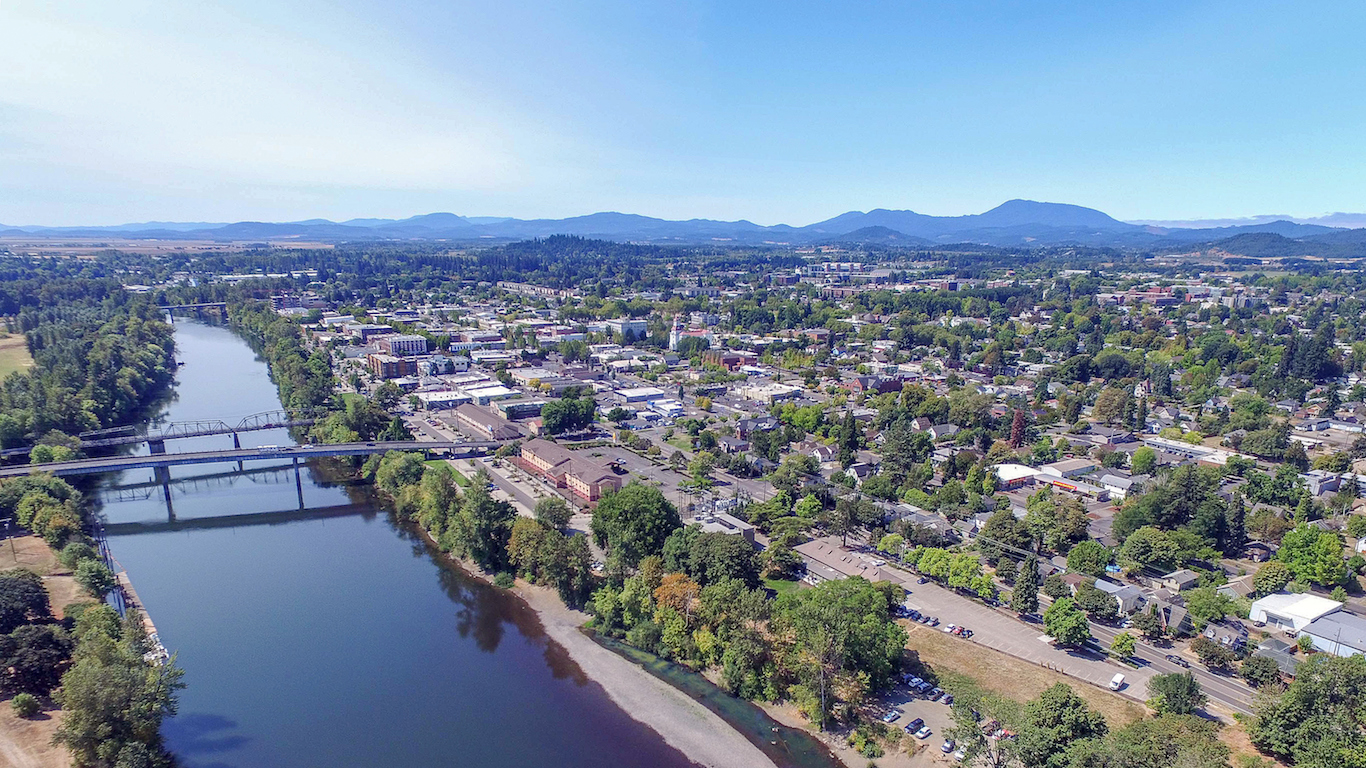
9. Oregon
> 10-yr. employment change: +7.2%
> Employment change: 125,600
> Dec. unemployment: 4.6%
> Total employment: 1,863,100
Employment in Oregon rose by 125,600 over the past decade, a 7.2% increase. The state was hit relatively hard by the Great Recession, and unemployment peaked at 11.9% in April 2009, tied with Alabama as the fourth worst peak of any state job market in last 10 years. Oregon has completely recovered since then, as the state’s unemployment rate of 4.6% is 0.7 percentage points below the December 2007 level. Employment in a number of sectors in the state actually declined during this period, with employment in the state’s finance and insurance, wholesale trade, and construction sectors all declining by more than 10% since 2007. The state made up for this loss by adding jobs in the professional, scientific, and management and the education and health care sectors.
[recirclink id=375074]

8. California
> 10-yr. employment change: +7.3%
> Employment change: 1,134,100
> Dec. unemployment: 5.2%
> Total employment: 16,606,600
The site of much of the housing speculation that led to national housing crisis, California was one of the states hardest hit by the recession. The state unemployment rate peaked at 12.2% in February 2010, the third worst peak of any state. Several California metropolitan areas recorded unemployment rates exceeding 15%. In El Centro, the unemployment rate exceeded 30% several times. Still, the state job market as a whole has recovered, with a current unemployment rate of 5.2%. While this rate is still relatively high compared to most states, it is 0.8 percentage points below its December 2007 rate. Since then, the state has added 1.1 million jobs, more than any state except for Texas.

7. New York
> 10-yr. employment change: +7.4%
> Employment change: 644,800
> Dec. unemployment: 4.9%
> Total employment: 9,413,100
Employment in New York increased by 7.4% over the past decade. The state added 644,800 employed workers during that time, third most in the country behind California and Texas. This employment increase is all the more impressive given the state’s decline in manufacturing, which shed more than 100,000 jobs since 2007, the largest manufacturing decline of any state in the country. The state’s professional, scientific, and management sector more than made up for this, adding more than 120,000 workers during the same period.
[in-text-ad-2]

6. Massachusetts
> 10-yr. employment change: +8.2%
> Employment change: 272,000
> Dec. unemployment: 2.8%
> Total employment: 3,590,400
While many state economies have recovered to prerecession levels, few states have improved more than Massachussetts. Employment in the state rose by 272,000 workers over the past decade, an 8.2% increase. The state’s unemployment rate in December 2007 was 4.6%. Since then, the rate has fallen by 1.8 percentage points — the second best improvement of any state — to 2.8%, the third lowest unemployment rate of any state.
A highly skilled workforce may have contributed to the state’s healthy economy. A nation-leading 41.5% of Massachusetts adults have a bachelor’s degree, more than 10 percentage points higher than the nationwide share.
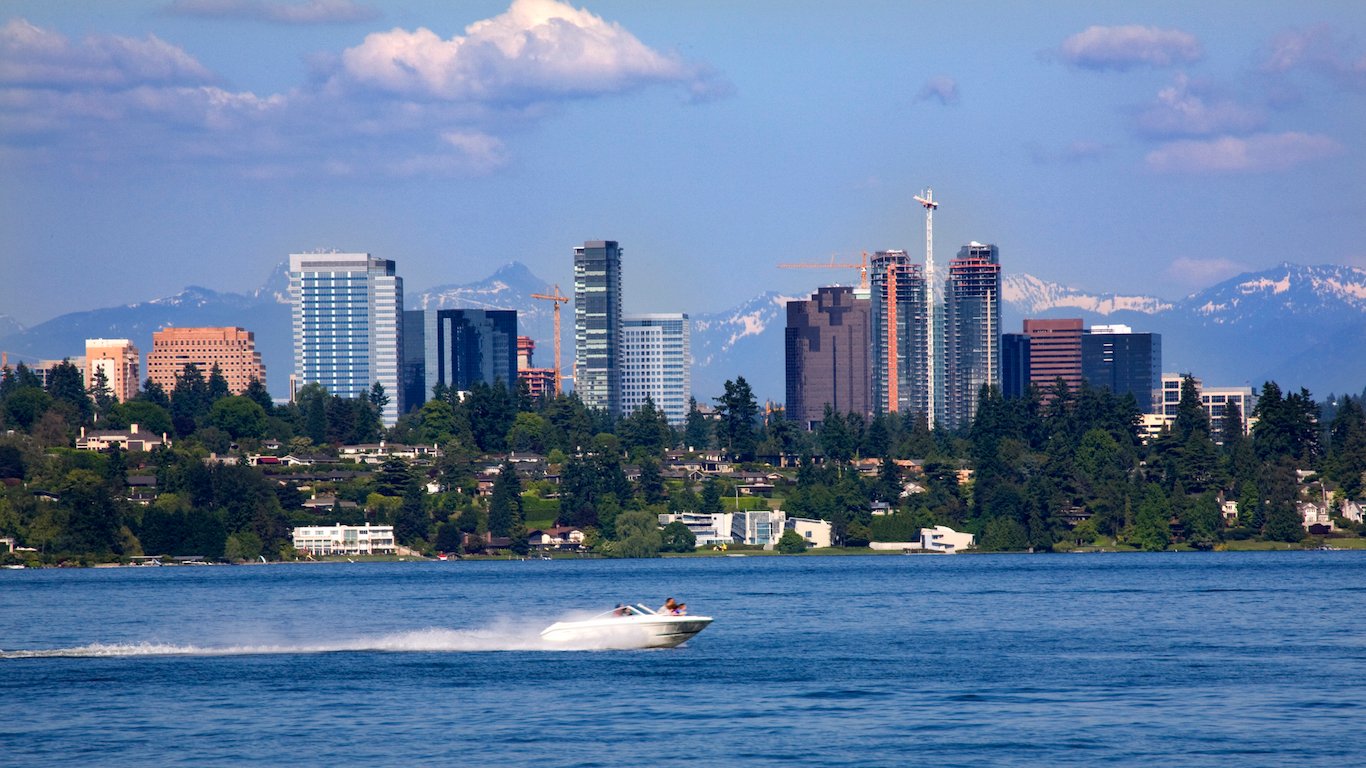
5. Washington
> 10-yr. employment change: +9.8%
> Employment change: 295,000
> Dec. unemployment: 5.2%
> Total employment: 3,292,700
Washington’s total employment rose by close to 300,000 jobs over the past decade, roughly a 10% increase. Employment in the state’s transportation and warehousing sector increased by 18% over the last 10 years, while the education sector contributed the most to job growth, adding about 98,000 workers since 2007. However, even as the state added significantly to its employed workforce, the number of people looking for jobs increased even more rapidly. Since December 2007, the state’s unemployment rate actually rose by 0.4 percentage points to 5.2%, the 10th highest unemployment rate in the country.
[in-text-ad]
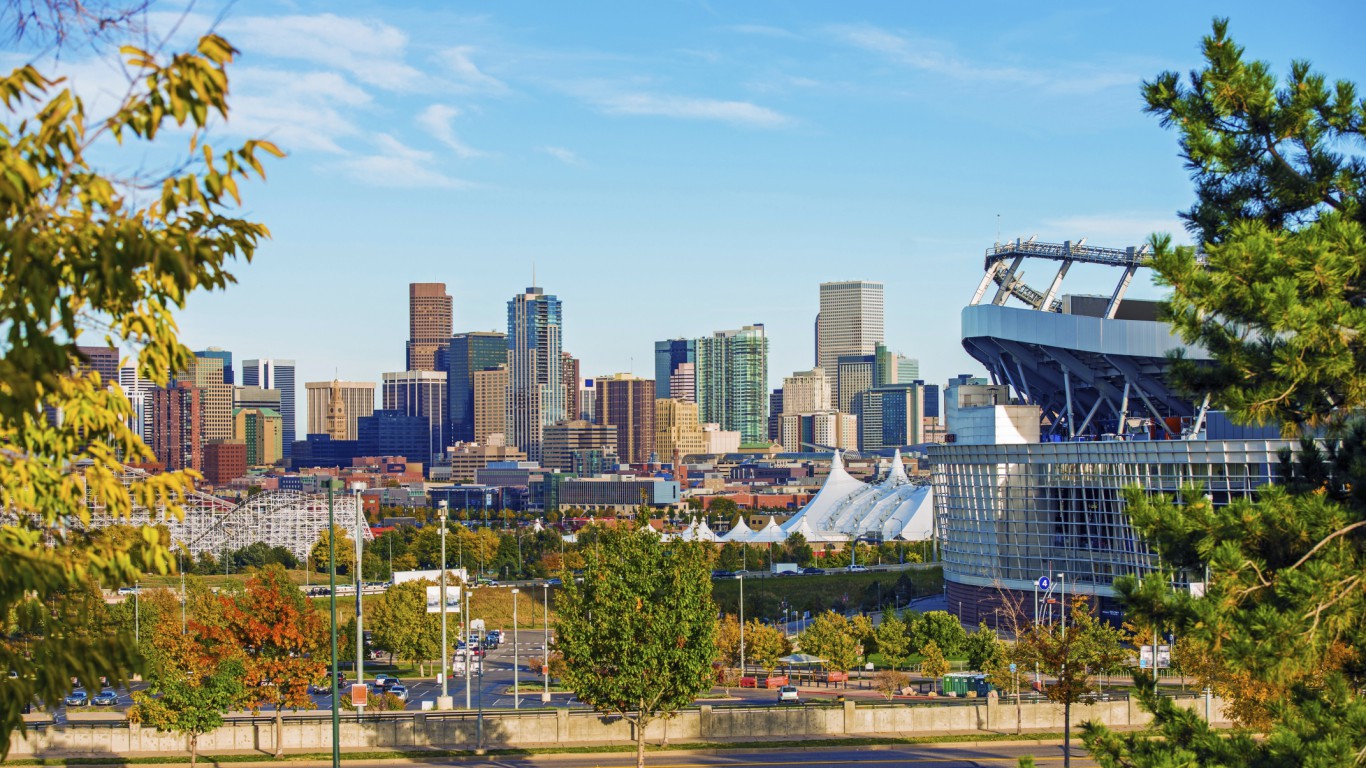
4. Colorado
> 10-yr. employment change: +11.8%
> Employment change: 276,900
> Dec. unemployment: 3.0%
> Total employment: 2,627,400
A decade ago, Colorado had a relatively low 4.1% unemployment rate. Since then, the state’s unemployment fell by 1.1 percentage points to 3.0%, the sixth lowest rate in the country. Contributing to this decline was the state’s increase in total employment of more than 276,000 workers, an 11.8% increase.
The state’s highly-skilled workforce is likely contributing to its healthy economy. Nearly 40% of the state’s adult population has a college degree, the second largest share of any state.
[recirclink id=375074]
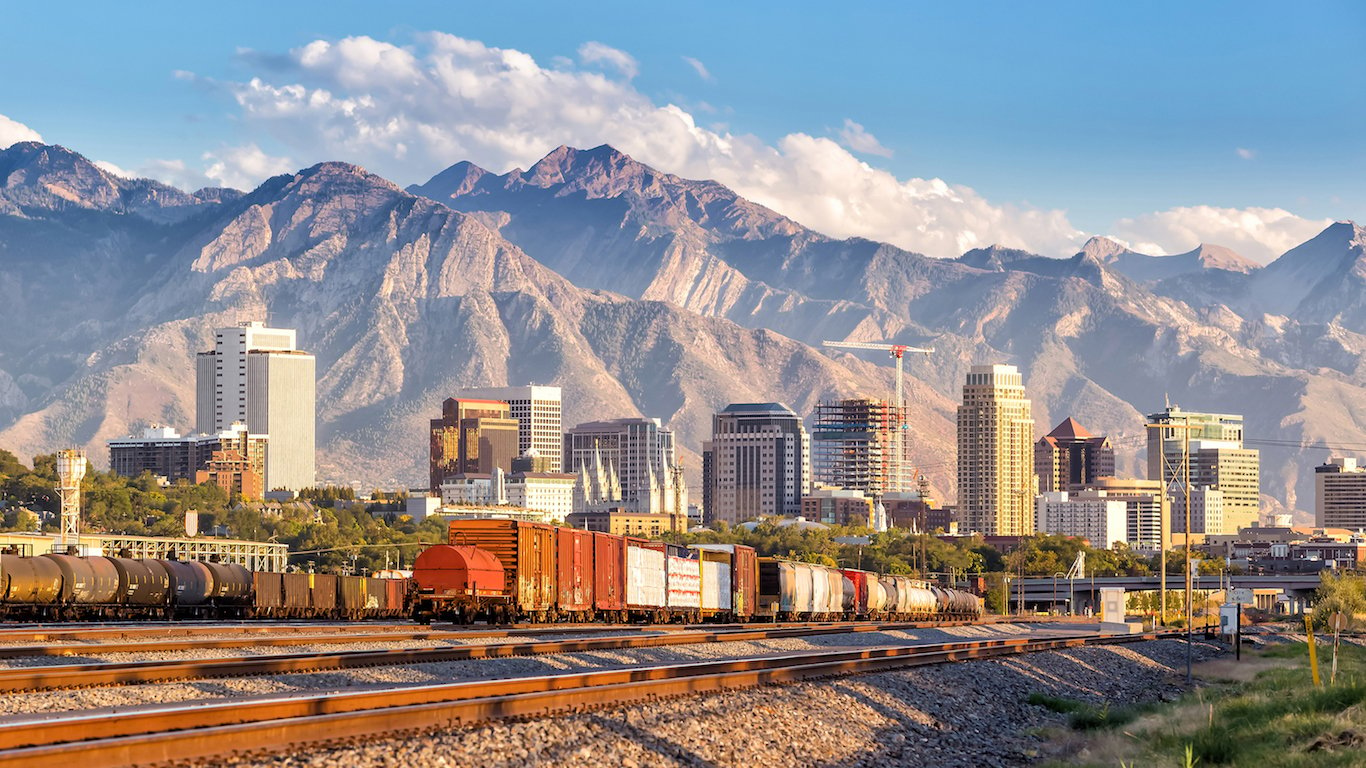
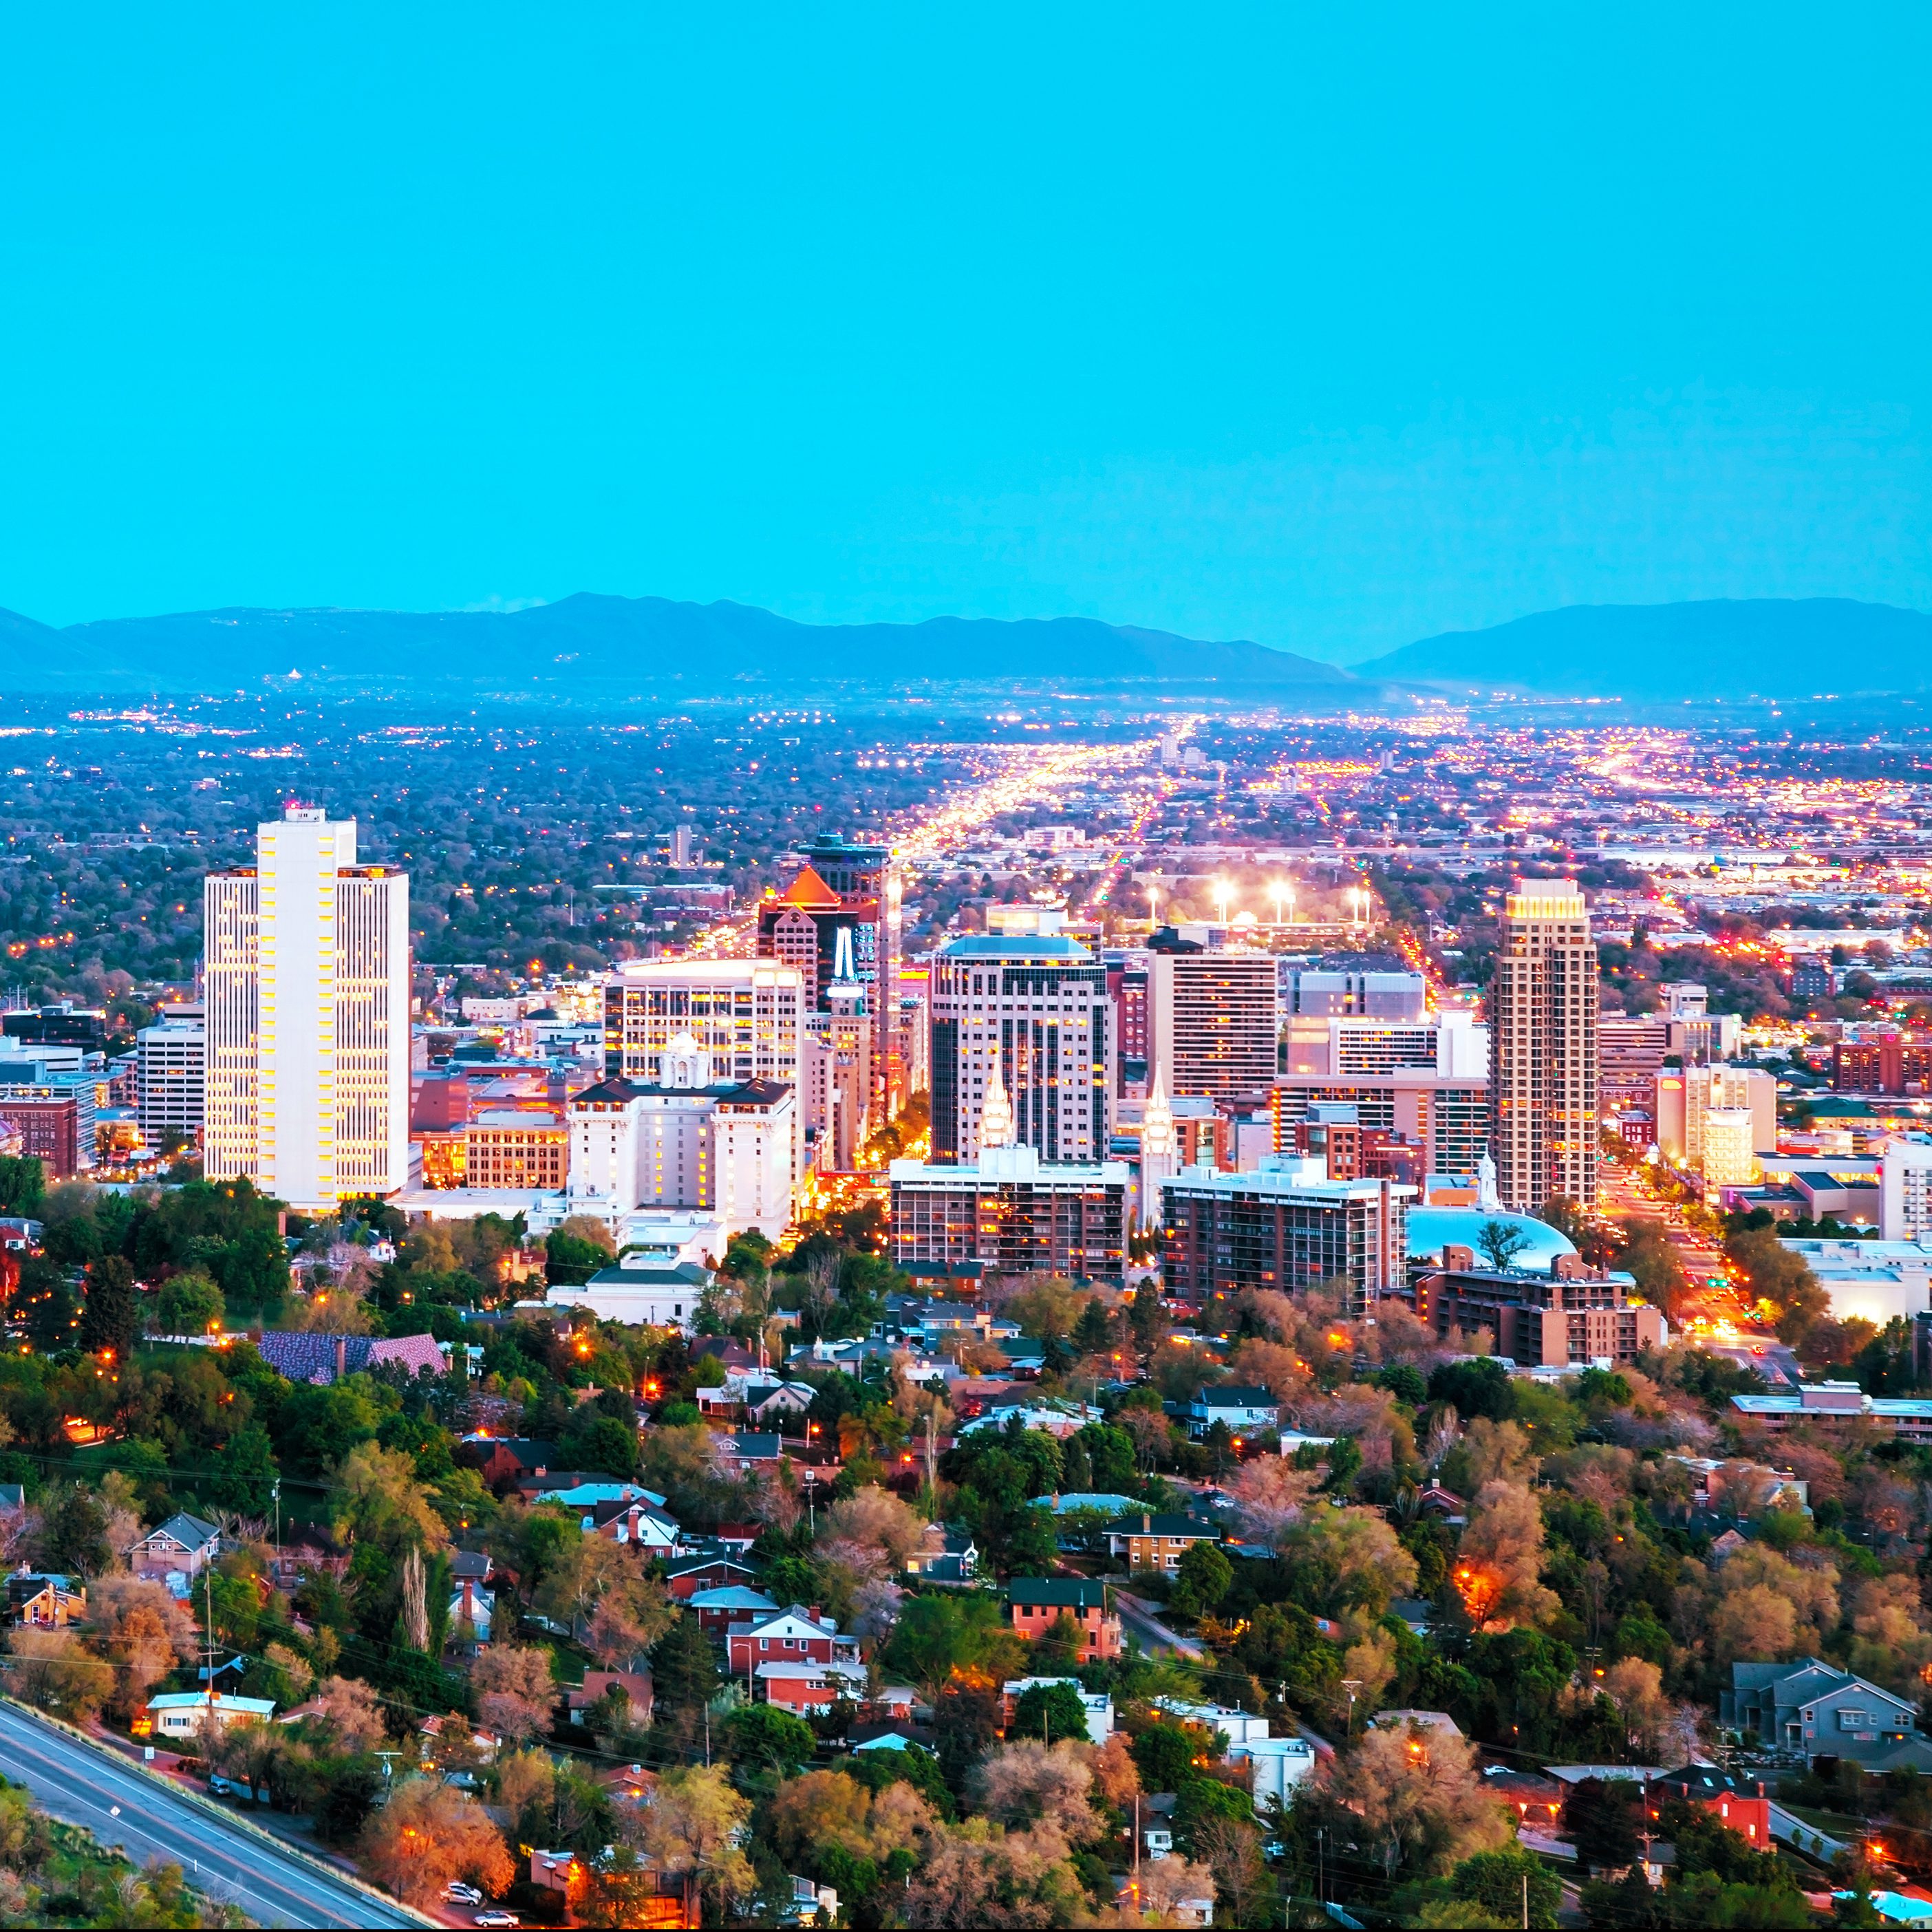
3. Utah
> 10-yr. employment change: +13.6%
> Employment change: 171,900
> Dec. unemployment: 3.1%
> Total employment: 1,437,100
Utah’s employment rose by 171,900 workers during the past decade, a 13.6% increase. This was the third largest proportional improvement in the country. Employment increased in a number of sectors in the state since 2007, including the professional and scientific sector. The sector added more than 33,000 workers, a 25% increase.
Compared to other states, Utah fared relatively well during and after the Great Recession. Unemployment peaked at just 8%, compared to many states in which unemployment exceeded 10% for a time. The state’s current unemployment rate of 3.1% is effectively unchanged from the rate prior to the recession, and is eighth lowest in the country.

2. Texas
> 10-yr. employment change: +15.3%
> Employment change: 1,612,800
> Dec. unemployment: 4.6%
> Total employment: 12,141,300
Employment in Texas rose in the past 10 years by more than 1.6 million, a 15.3% increase. That is roughly half a million more jobs added than the next largest increase — in California — and more than the combined total increase of 30 other states that added jobs. Compared to other states with large economies, Texas largely avoided the worst effects of the recession, in part because much of the housing speculation that occurred in California and parts of the Southwest missed Texas. The state’s booming oil industry also helped provide economic stability during the recession. Texas added workers in a number of sectors since 2007, including more than half a million educational services and health care workers and 300,000 workers in professional, scientific, and management roles.
[in-text-ad-2]
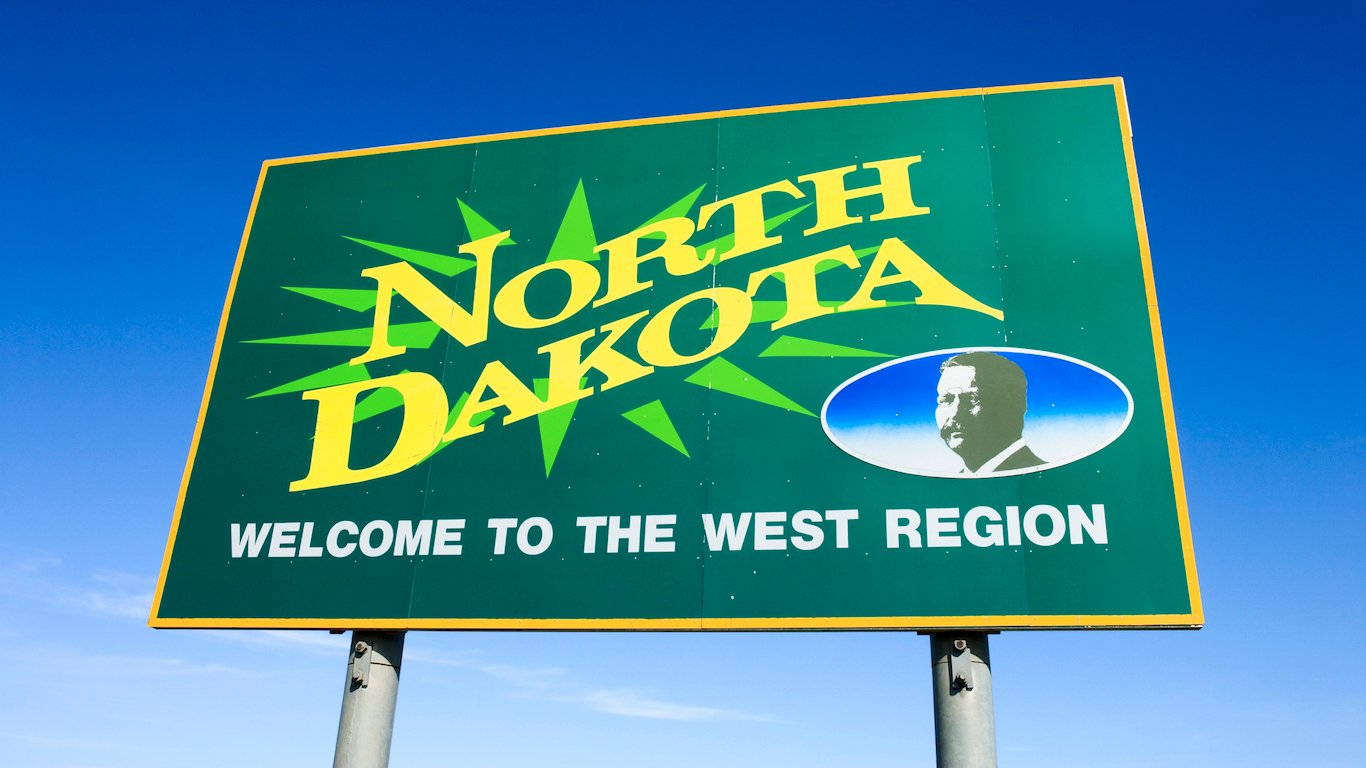
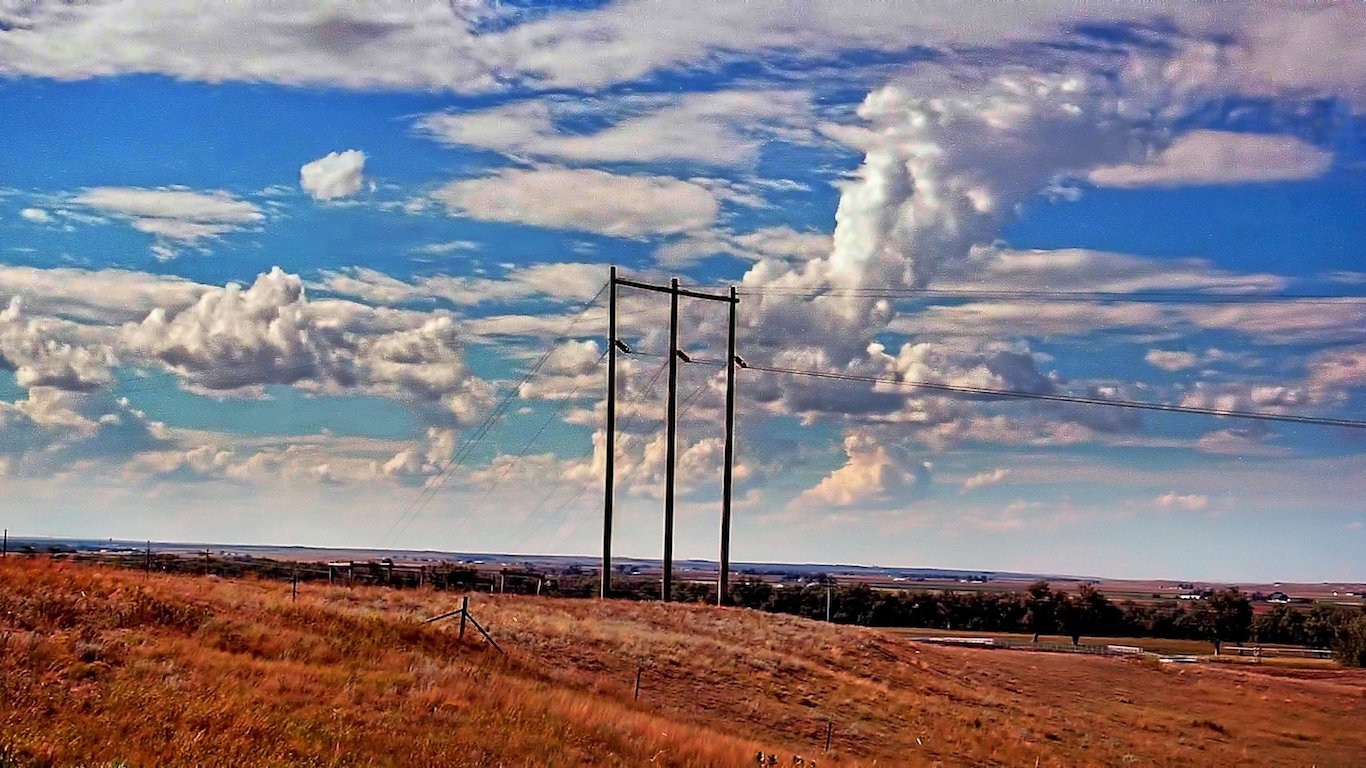
1. North Dakota
> 10-yr. employment change: +20.7%
> Employment change: 74,900
> Dec. unemployment: 3.0%
> Total employment: 436,900
North Dakota was one of just a handful of states to effectively avoid the recession. North Dakota was one of just a handful of states to effectively avoid the recession. While unemployment peaked at 10% or higher in many states, unemployment in North Dakota peaked at just 4.3%. The surge in oil and gas development in the state’s Bakken shale contributed to a strong economic boom that is only now beginning to fade after energy prices began plummeting in 2014. The number of people employed in the state’s agriculture, forestry, fishing, and mining industry, which includes oil and gas, increased by 33% between 2007 and 2015, one of the largest increases of any state for that industry.
Contact [email protected] for any questions or corrections.