[cnxvideo id=”508885″ placement=”ros”]In an executive order signed Friday, President Donald Trump enacted a 120-day suspension of all refugee admissions to the United States, and a 90-day suspension of all visas for nationals from seven Muslim-majority countries: Iraq, Iran, Libya, Sudan, Syria, and Yemen.
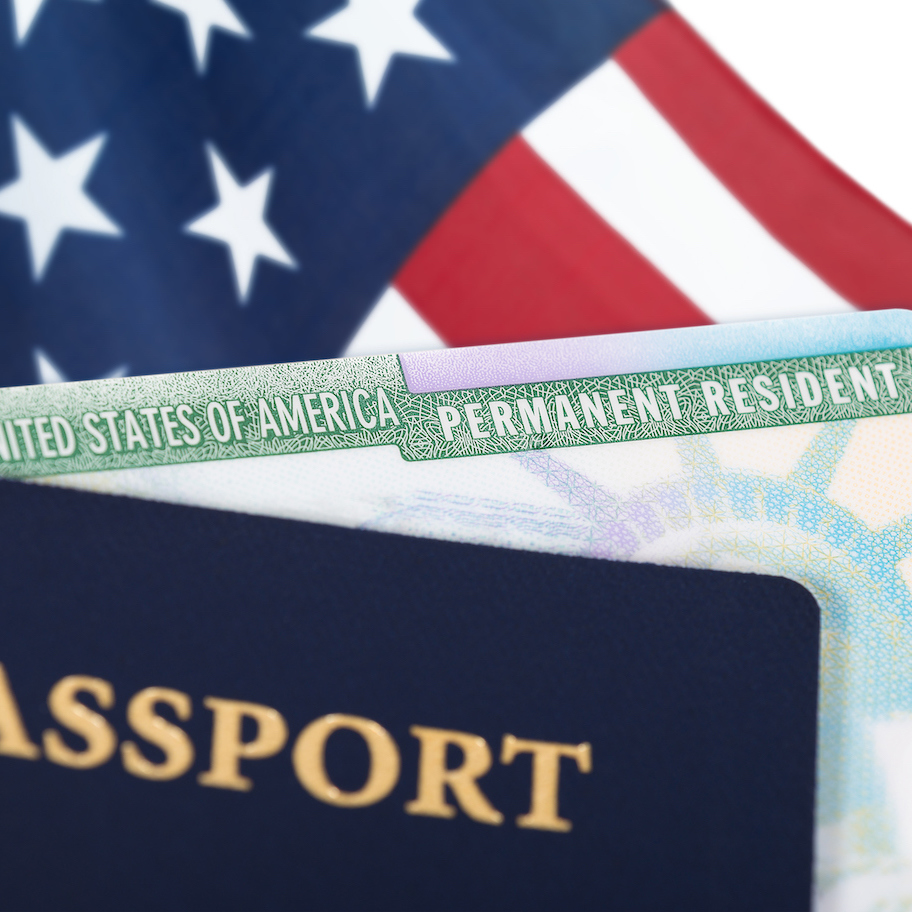
Green card holders — legal U.S. immigrants permitted to live and work in the United States indefinitely as well as serve in the military — were also being detained at airports over the weekend. After a day of protest, Trump administration officials clarified in a statement that green card holders from the seven nations will be admitted but subject to additional screening on a case-by-case basis.
While the United States has long been the largest destination of immigrants in the world, this is not the case for refugees. The United States accepted 146,158 refugees in 1975. Annual refugee admissions peaked in 1980 at 207,116 after a resettlement program during the American-led air strikes on Kosovo. Since then, annual refugee admissions have remained well below 1980 levels. Less than 100,000 refugees have been admitted to the United States each year since 1995. The limit for fiscal 2017 under Trump’s order is 50,000, down from the previous limit of 110,000.
Because foreigners seeking employment and eventually citizenship in the United States almost always choose communities where they have families or friends, certain areas of the country continue to attract greater numbers of immigrants than others. The annual flow of green card holding residents tends to be higher in states with larger foreign born populations nearly without exception. 24/7 Wall St. reviewed the number of green cards issued per capita in 2015 in each state. New York reported the highest flow, with 658.4 green cards issued per 100,000 people. In West Virginia, on the other hand, just 42.7 residents for every 100,000 residents obtained a green card, the lowest of all states.
Click here to see the states where the most people have green cards.
In an interview with 24/7 Wall St, Sarah Pierce, associate policy analyst at the Washington D.C.-based think tank Migration Policy Institute, explained that although green card holders traveling from one of the seven nations included in the ban should be allowed back in the country, there is still a risk. “[As] an attorney of a legal permanent resident from one of those seven countries, I would not advise my clients to travel. I would advise [them] to behave as if this executive order affected them,” she said.
According to the Migration Policy Institute, the United States issued 52,000 green cards in 2015 to individuals from the seven nations — less than 5% of all green cards issued that year. The U.S. immigrant population is largely dominated by foreign-born citizens from other countries. Between 11% and 70% of any U.S. state’s foreign-born population comes from Mexico, the most common country of birth among immigrant populations in 32 of 50 states.
Reactions among legislators and experts on both sides of the isle suggest that the justifications for Trump’s order are incomplete. As a consequence, it is unclear to many who may be targeted in the future. Citing the terrorist attacks on September 2011, Trump gave security concerns as the justification for the order. But between 1975 and the end of 2015, foreigners from these seven nations killed zero Americans on U.S. soil in terrorist attacks — according to a recent publication from the right-leaning think tank Cato Institute.
“We’re having trouble seeing a direct line between restricting these populations, both the individuals from the seven countries and refugees, and security concerns,” Pierce said. With so little history of security threats among individuals from these countries, and because residents of the seven nations included in the ban comprise such a small share of immigration to the United States, it seems unlikely that national security threats are the basis of Trump’s order. “I think the administration might be hard pressed to prove how these two bans are going to improve security.”
To identify the states where the highest share of residents have green cards, 24/7 Wall St. reviewed the number of green cards issued in 2015 to residents of each state from the report, Yearbook of Immigration Statistics: 2015, published in 2016 by the U.S. Department of Homeland Security, Office of Immigration Statistics. To compare states, we adjusted the number of green cards issued in 2015 to each state’s population. The foreign born population in each state (the immigrant population), the most common country of birth, the number of immigrants in each state from the most common country of birth, and the number of immigrants from the seven nations under Trump’s ban, came from the U.S. Census Bureau’s 2015 American Community Survey.
These are the states where the most people have green cards.

50. West Virginia
> Green cards issued in 2015: 42.7 per 100,000
> Immigrant pop.: 1.6% (the lowest)
> Most common country of origin: Germany
> German pop.: 3,101 (0.17% of total)
> Pop. from countries under ban: 2,592 (0.14% of total)
[in-text-ad]

49. Montana
> Green cards issued in 2015: 50.3 per 100,000
> Immigrant pop.: 2.1% (2nd lowest)
> Most common country of origin: Canada
> Canadian pop.: 5,703 (0.55% of total)
> Pop. from countries under ban: 00 (0.00% of total)
[recirclink id=373752]

48. Mississippi
> Green cards issued in 2015: 53.1 per 100,000
> Immigrant pop.: 2.4% (3rd lowest)
> Most common country of origin: Mexico
> Mexican pop.: 25,987 (0.87% of total)
> Pop. from countries under ban: 285 (0.01% of total)

47. Alabama
> Green cards issued in 2015: 80.9 per 100,000
> Immigrant pop.: 3.5% (6th lowest)
> Most common country of origin: Mexico
> Mexican pop.: 53,882 (1.11% of total)
> Pop. from countries under ban: 3,219 (0.07% of total)
[in-text-ad-2]

46. South Carolina
> Green cards issued in 2015: 90.2 per 100,000
> Immigrant pop.: 4.8% (14th lowest)
> Most common country of origin: Mexico
> Mexican pop.: 65,553 (1.34% of total)
> Pop. from countries under ban: 1,696 (0.03% of total)

45. Wyoming
> Green cards issued in 2015: 91.9 per 100,000
> Immigrant pop.: 3.8% (8th lowest)
> Most common country of origin: Mexico
> Mexican pop.: 10,326 (1.76% of total)
> Pop. from countries under ban: 133 (0.02% of total)
[in-text-ad]

44. Arkansas
> Green cards issued in 2015: 94.5 per 100,000
> Immigrant pop.: 4.8% (16th lowest)
> Most common country of origin: Mexico
> Mexican pop.: 54,405 (1.83% of total)
> Pop. from countries under ban: 711 (0.02% of total)
[recirclink id=375655]

43. Louisiana
> Green cards issued in 2015: 100.6 per 100,000
> Immigrant pop.: 4.0% (10th lowest)
> Most common country of origin: Mexico
> Mexican pop.: 26,975 (0.58% of total)
> Pop. from countries under ban: 2,910 (0.06% of total)

42. Maine
> Green cards issued in 2015: 110.1 per 100,000
> Immigrant pop.: 3.4% (5th lowest)
> Most common country of origin: Canada
> Canadian pop.: 9,753 (0.73% of total)
> Pop. from countries under ban: 1,900 (0.14% of total)
[in-text-ad-2]

41. Missouri
> Green cards issued in 2015: 110.8 per 100,000
> Immigrant pop.: 4.0% (11th lowest)
> Most common country of origin: Mexico
> Mexican pop.: 45,198 (0.74% of total)
> Pop. from countries under ban: 5,552 (0.09% of total)

40. Wisconsin
> Green cards issued in 2015: 115.4 per 100,000
> Immigrant pop.: 4.8% (17th lowest)
> Most common country of origin: Mexico
> Mexican pop.: 88,219 (1.53% of total)
> Pop. from countries under ban: 6,765 (0.12% of total)
[in-text-ad]

39. Oklahoma
> Green cards issued in 2015: 124.9 per 100,000
> Immigrant pop.: 6.0% (22nd lowest)
> Most common country of origin: Mexico
> Mexican pop.: 114,207 (2.92% of total)
> Pop. from countries under ban: 2,035 (0.05% of total)
[recirclink id=373768]

38. Vermont
> Green cards issued in 2015: 126.5 per 100,000
> Immigrant pop.: 4.5% (13th lowest)
> Most common country of origin: Canada
> Canadian pop.: 4,205 (0.67% of total)
> Pop. from countries under ban: 270 (0.04% of total)

37. Kentucky
> Green cards issued in 2015: 127.6 per 100,000
> Immigrant pop.: 3.6% (7th lowest)
> Most common country of origin: Mexico
> Mexican pop.: 30,271 (0.68% of total)
> Pop. from countries under ban: 4,672 (0.11% of total)
[in-text-ad-2]

36. Indiana
> Green cards issued in 2015: 129.4 per 100,000
> Immigrant pop.: 4.9% (18th lowest)
> Most common country of origin: Mexico
> Mexican pop.: 101,519 (1.54% of total)
> Pop. from countries under ban: 5,395 (0.08% of total)

35. Tennessee
> Green cards issued in 2015: 133.9 per 100,000
> Immigrant pop.: 5.0% (19th lowest)
> Most common country of origin: Mexico
> Mexican pop.: 89,699 (1.36% of total)
> Pop. from countries under ban: 12,613 (0.19% of total)
[in-text-ad]

34. Ohio
> Green cards issued in 2015: 138.3 per 100,000
> Immigrant pop.: 4.3% (12th lowest)
> Most common country of origin: India
> Indian pop.: 62,232 (0.54% of total)
> Pop. from countries under ban: 17,400 (0.15% of total)
[recirclink id=375655]

33. South Dakota
> Green cards issued in 2015: 147.4 per 100,000
> Immigrant pop.: 3.2% (4th lowest)
> Most common country of origin: Mexico
> Mexican pop.: 3,359 (0.39% of total)
> Pop. from countries under ban: 401 (0.05% of total)

32. Idaho
> Green cards issued in 2015: 153.1 per 100,000
> Immigrant pop.: 5.7% (20th lowest)
> Most common country of origin: Mexico
> Mexican pop.: 50,229 (3.04% of total)
> Pop. from countries under ban: 1,363 (0.08% of total)
[in-text-ad-2]

31. Iowa
> Green cards issued in 2015: 161.7 per 100,000
> Immigrant pop.: 4.8% (15th lowest)
> Most common country of origin: Mexico
> Mexican pop.: 43,526 (1.39% of total)
> Pop. from countries under ban: 1,290 (0.04% of total)

30. New Hampshire
> Green cards issued in 2015: 162.3 per 100,000
> Immigrant pop.: 6.0% (21st lowest)
> Most common country of origin: Canada
> Canadian pop.: 8,924 (0.67% of total)
> Pop. from countries under ban: 1,848 (0.14% of total)
[in-text-ad]

29. New Mexico
> Green cards issued in 2015: 174.3 per 100,000
> Immigrant pop.: 9.5% (19th highest)
> Most common country of origin: Mexico
> Mexican pop.: 137,934 (6.63% of total)
> Pop. from countries under ban: 2,090 (0.10% of total)
[recirclink id=373518]

28. Michigan
> Green cards issued in 2015: 182.0 per 100,000
> Immigrant pop.: 6.6% (24th lowest)
> Most common country of origin: Mexico
> Mexican pop.: 74,901 (0.76% of total)
> Pop. from countries under ban: 78,688 (0.79% of total)

27. North Carolina
> Green cards issued in 2015: 184.3 per 100,000
> Immigrant pop.: 7.9% (24th highest)
> Most common country of origin: Mexico
> Mexican pop.: 242,892 (2.42% of total)
> Pop. from countries under ban: 11,433 (0.11% of total)
[in-text-ad-2]

26. Kansas
> Green cards issued in 2015: 186.4 per 100,000
> Immigrant pop.: 7.1% (25th highest)
> Most common country of origin: Mexico
> Mexican pop.: 83,215 (2.86% of total)
> Pop. from countries under ban: 2,950 (0.10% of total)

25. Pennsylvania
> Green cards issued in 2015: 195.2 per 100,000
> Immigrant pop.: 6.5% (23rd lowest)
> Most common country of origin: India
> Indian pop.: 89,553 (0.70% of total)
> Pop. from countries under ban: 15,311 (0.12% of total)
[in-text-ad]

24. North Dakota
> Green cards issued in 2015: 211.4 per 100,000
> Immigrant pop.: 3.8% (9th lowest)
> Most common country of origin: Philippines
> Filipino pop.: 4,032 (0.53% of total)
> Pop. from countries under ban: 1,433 (0.19% of total)
[recirclink id=375655]

23. Alaska
> Green cards issued in 2015: 213.1 per 100,000
> Immigrant pop.: 7.9% (23rd highest)
> Most common country of origin: Philippines
> Filipino pop.: 20,541 (2.78% of total)
> Pop. from countries under ban: 310 (0.04% of total)

22. Oregon
> Green cards issued in 2015: 215.1 per 100,000
> Immigrant pop.: 9.9% (17th highest)
> Most common country of origin: Mexico
> Mexican pop.: 146,979 (3.65% of total)
> Pop. from countries under ban: 8,633 (0.21% of total)
[in-text-ad-2]

21. Delaware
> Green cards issued in 2015: 229.6 per 100,000
> Immigrant pop.: 9.3% (20th highest)
> Most common country of origin: Mexico
> Mexican pop.: 15,889 (1.68% of total)
> Pop. from countries under ban: 137 (0.01% of total)

20. Utah
> Green cards issued in 2015: 230.2 per 100,000
> Immigrant pop.: 8.2% (22nd highest)
> Most common country of origin: Mexico
> Mexican pop.: 105,496 (3.53% of total)
> Pop. from countries under ban: 4,719 (0.16% of total)
[in-text-ad]

19. Colorado
> Green cards issued in 2015: 232.4 per 100,000
> Immigrant pop.: 9.9% (18th highest)
> Most common country of origin: Mexico
> Mexican pop.: 232,360 (4.26% of total)
> Pop. from countries under ban: 6,813 (0.13% of total)
[recirclink id=373021]

18. Georgia
> Green cards issued in 2015: 254.1 per 100,000
> Immigrant pop.: 10.0% (16th highest)
> Most common country of origin: Mexico
> Mexican pop.: 263,036 (2.58% of total)
> Pop. from countries under ban: 12,911 (0.13% of total)

17. Arizona
> Green cards issued in 2015: 264.0 per 100,000
> Immigrant pop.: 13.4% (14th highest)
> Most common country of origin: Mexico
> Mexican pop.: 513,128 (7.53% of total)
> Pop. from countries under ban: 19,980 (0.29% of total)
[in-text-ad-2]

16. Minnesota
> Green cards issued in 2015: 268.8 per 100,000
> Immigrant pop.: 8.3% (21st highest)
> Most common country of origin: Mexico
> Mexican pop.: 63,413 (1.16% of total)
> Pop. from countries under ban: 32,011 (0.58% of total)

15. Nebraska
> Green cards issued in 2015: 276.4 per 100,000
> Immigrant pop.: 6.8% (25th lowest)
> Most common country of origin: Mexico
> Mexican pop.: 45,550 (2.41% of total)
> Pop. from countries under ban: 7,882 (0.42% of total)
[in-text-ad]

14. Connecticut
> Green cards issued in 2015: 309.7 per 100,000
> Immigrant pop.: 14.5% (10th highest)
> Most common country of origin: India
> Indian pop.: 34,217 (0.95% of total)
> Pop. from countries under ban: 5,942 (0.17% of total)
[recirclink id=375655]

13. Illinois
> Green cards issued in 2015: 315.3 per 100,000
> Immigrant pop.: 14.2% (11th highest)
> Most common country of origin: Mexico
> Mexican pop.: 696,812 (5.43% of total)
> Pop. from countries under ban: 26,881 (0.21% of total)

12. Virginia
> Green cards issued in 2015: 330.1 per 100,000
> Immigrant pop.: 12.2% (15th highest)
> Most common country of origin: El Salvador
> El Salvadoran pop.: 108,373 (1.30% of total)
> Pop. from countries under ban: 28,061 (0.34% of total)
[in-text-ad-2]

11. Rhode Island
> Green cards issued in 2015: 342.0 per 100,000
> Immigrant pop.: 13.5% (13th highest)
> Most common country of origin: Dominican Republic
> Dominican pop.: 25,286 (2.40% of total)
> Pop. from countries under ban: 3,432 (0.33% of total)

10. Washington
> Green cards issued in 2015: 345.9 per 100,000
> Immigrant pop.: 13.7% (12th highest)
> Most common country of origin: Mexico
> Mexican pop.: 237,213 (3.31% of total)
> Pop. from countries under ban: 19,268 (0.27% of total)
[in-text-ad]

9. Texas
> Green cards issued in 2015: 363.6 per 100,000
> Immigrant pop.: 17.0% (7th highest)
> Most common country of origin: Mexico
> Mexican pop.: 2,572,148 (9.38% of total)
> Pop. from countries under ban: 56,053 (0.20% of total)
[recirclink id=372674]

8. Maryland
> Green cards issued in 2015: 377.4 per 100,000
> Immigrant pop.: 15.2% (9th highest)
> Most common country of origin: El Salvador
> El Salvadoran pop.: 120,202 (2.01% of total)
> Pop. from countries under ban: 18,519 (0.31% of total)

7. Nevada
> Green cards issued in 2015: 383.3 per 100,000
> Immigrant pop.: 19.4% (5th highest)
> Most common country of origin: Mexico
> Mexican pop.: 220,579 (7.65% of total)
> Pop. from countries under ban: 6,278 (0.22% of total)
[in-text-ad-2]

6. Massachusetts
> Green cards issued in 2015: 420.6 per 100,000
> Immigrant pop.: 16.2% (8th highest)
> Most common country of origin: China
> Chinese pop.: 96,177 (1.42% of total)
> Pop. from countries under ban: 14,013 (0.21% of total)

5. Hawaii
> Green cards issued in 2015: 457.0 per 100,000
> Immigrant pop.: 17.8% (6th highest)
> Most common country of origin: Philippines
> Filipino pop.: 116,757 (8.19% of total)
> Pop. from countries under ban: 673 (0.05% of total)
[in-text-ad]

4. California
> Green cards issued in 2015: 537.4 per 100,000
> Immigrant pop.: 27.4% (the highest)
> Most common country of origin: Mexico
> Mexican pop.: 4,274,650 (10.96% of total)
> Pop. from countries under ban: 295,102 (0.76% of total)
[recirclink id=375655]

3. New Jersey
> Green cards issued in 2015: 557.3 per 100,000
> Immigrant pop.: 22.1% (3rd highest)
> Most common country of origin: India
> Indian pop.: 246,954 (2.76% of total)
> Pop. from countries under ban: 13,742 (0.15% of total)

2. Florida
> Green cards issued in 2015: 587.2 per 100,000
> Immigrant pop.: 20.2% (4th highest)
> Most common country of origin: Cuba
> Cuban pop.: 930,104 (4.59% of total)
> Pop. from countries under ban: 23,449 (0.12% of total)
[in-text-ad-2]

1. New York
> Green cards issued in 2015: 658.4 per 100,000
> Immigrant pop.: 22.9% (2nd highest)
> Most common country of origin: Dominican Republic
> Dominican pop.: 506,284 (2.56% of total)
> Pop. from countries under ban: 51,582 (0.26% of total)
Contact [email protected] for any questions or corrections.