[cnxvideo id=”655235″ placement=”ros”]By many measures, the U.S. economy is booming: unemployment is close to a decade-long low; the Federal Reserve recently raised interest rates for the second time in roughly a decade, signaling confidence in the economy; and the Dow Jones Industrial Average reached an all-time high earlier this year.
Despite the nearly decade-long period of growth, there have been signs the American middle class is being left behind. Over the past five years alone, incomes among the top 20% of earning households in the United States rose about 1.5 times faster than that of middle class households. Incomes among the top 5% of households increased at roughly double the rate middle class incomes did. In some states, the gap is widening at a much faster rate. In Wyoming, incomes among the top quintile of households increased by 12.2%, while the average income among middle class households rose by just 2.5%. 24/7 Wall St. reviewed the nine states where the middle class is being left behind.
[in-text-ad]
As the economy has recovered from the Great Recession, a trend began to develop among the nation’s middle class. Americans who lost their jobs managed to eventually find work again, but often at a lower pay, or only part time. The result was that even as the stock market soared and unemployment improved, incomes among the nation’s middle class — often referred to as the backbone of the economy — fell.
Click here to see the states where the middle class is being left behind.
As the recovery continued, however, middle class incomes began to rise somewhat, growing since 2011 in all but one state. Middle class household incomes declined by 0.8% in Delaware. However, throughout the country, and particularly in the nine states on our list, income growth among the top earners dwarfed the income growth of the middle class. In the nine states on our list, income growth among the top quintile was roughly double the growth of the middle quintile, and in the case of Wyoming and Alaska, it was more than four times that of the middle class.
One possible explanation for the relatively low income growth in some of the states on this list is, perhaps counterintuitively, the relative strength of the middle class there. Four states on this list have higher than average household incomes among the middle quintile. This includes Alaska, where the average household income in the middle quintile is about $73,500 a year, roughly $17,500 greater than the national average household income for the middle class.
Historically, strong labor unions have been integral to a vibrant middle class. Collective bargaining has helped improve wages, benefits, and rights for workers, both union and nonunion alike, nationwide. However, according to the Economic Policy Institute, a nonpartisan think tank, union membership has fallen considerably in the last several decades. In addition to declining membership, labor laws have weakened unions and their ability to contribute to higher wages. Since union membership began to rapidly decline in the 1980s, the share of income going to the top 10% of earners has increased dramatically.
Perhaps because unions are not as influential as they once were, there does not appear to be a strong overarching pattern between union membership and stagnant middle class wages. Nationwide, some 11.1% of all working adults are union members. Among the states where the middle class is disappearing, unionized workers comprise anywhere from 5.2% of workers in Arizona to 24.7% in New York.
Click here to read our methodology.
These are the states where the middle class is being left behind.

9. Montana
> Middle class income growth 2011-2015: 5.3% (23rd highest)
> Fifth quintile income growth: 16.3% (2nd highest)
> Fifth quintile share of income: 49.9% (24th lowest)
> Middle class household income: $48,954 (13th lowest)
In Montana, incomes of middle class residents are increasing at a far slower pace than incomes of the wealthiest residents. The average annual income among the state’s highest earning households — those that comprise the top 20% of earners — is $164,992, up 16.3% from half a decade ago. This was the second largest increase of any state’s top quintile of earners. At the same time, the average middle class income in Montana has increased by only 5.3%.
Labor unions strengthen workers’ bargaining power, and union strength has historically been closely tied to the vibrancy of the middle class. As has been the case nationwide, union membership has been declining in Montana in the last five years. Today, an estimated 12.1% of employed state workers are union members, down from 13.0% in 2011.
[in-text-ad]
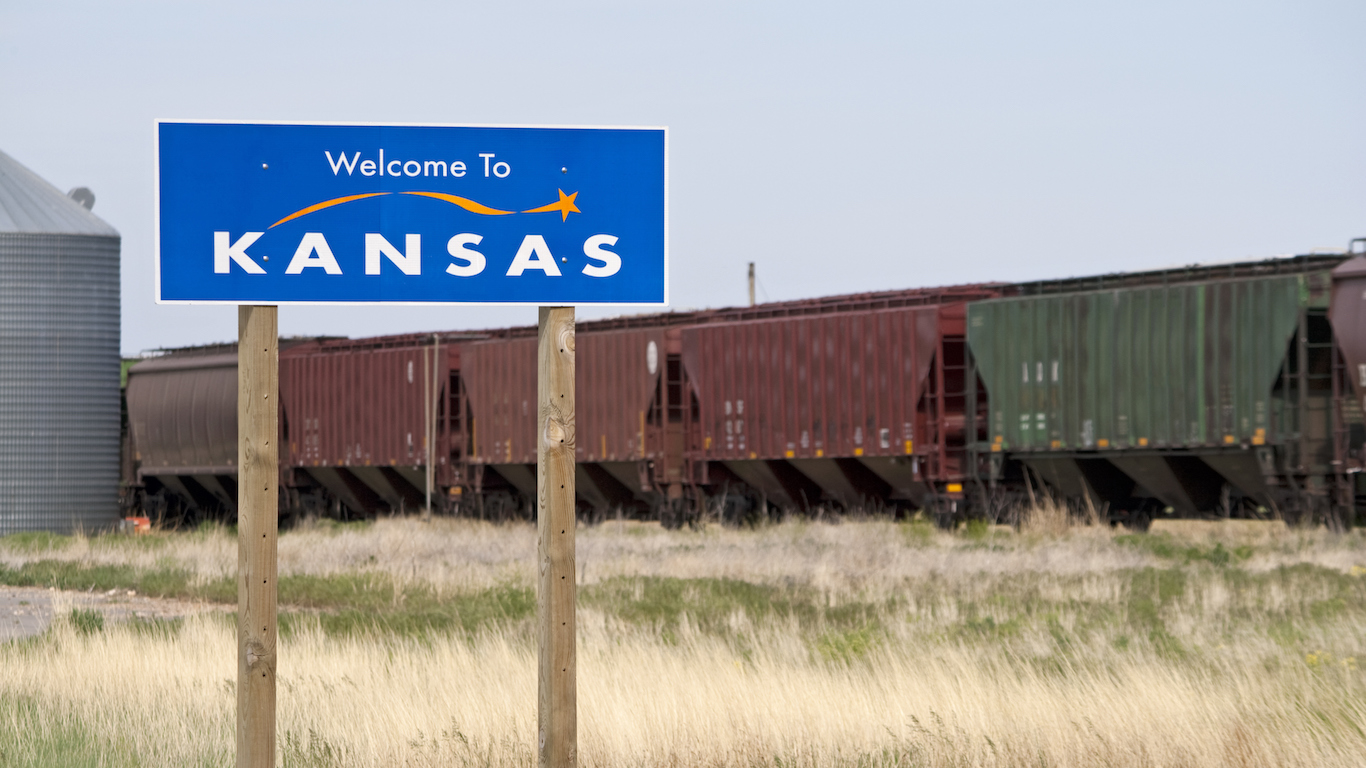
8. Kansas
> Middle class income growth 2011-2015: 5.2% (25th highest)
> Fifth quintile income growth: 10.9% (9th highest)
> Fifth quintile share of income: 49.6% (21st lowest)
> Middle class household income: $54,296 (24th lowest)
About half of all income in Kansas is earned by the top 20% of households. Meanwhile, the state’s middle class, which is typically the engine of economic growth, earns only 14.9% of income. The disparity will likely get worse before it gets better. Kansas is one of only a handful of states where income growth among the highest earners outpaces the corresponding income growth nationwide, while income growth among the state’s middle class lags behind the comparable growth of the American middle class nationwide.
Despite the financial eclipse of the middle class, Kansas’s economy is faring better than most. Only 4.0% of the state’s labor force is out of a job, well below the 4.9% unemployment rate nationwide.
[recirclink id=376816]

7. Idaho
> Middle class income growth 2011-2015: 5.1% (25th lowest)
> Fifth quintile income growth: 12.1% (7th highest)
> Fifth quintile share of income: 48.8% (14th lowest)
> Middle class household income: $48,216 (11th lowest)
Currently, income inequality is less profound in Idaho than it is across the country. This may not remain the case for long, however. Middle class incomes in Idaho have not increased as rapidly as they have nationwide. Meanwhile, income growth among the top 20% of households has outpaced comparable growth nationwide by a considerable margin.
Historically, labor unions have been a major factor in the economic vitality of the middle class. The relatively small presence of organized labor in Idaho may partially explain the slower than average wage growth among middle income households. Only 6.8% of working adults in Idaho are unionized, well below the 11.1% of U.S. workers who are.

6. South Dakota
> Middle class income growth 2011-2015: 5.0% (23rd lowest)
> Fifth quintile income growth: 9.8% (13th highest)
> Fifth quintile share of income: 48.2% (8th lowest)
> Middle class household income: $53,266 (23rd lowest)
South Dakota has one of the healthiest economies in the country. Only 2.8% of the state’s labor force is out of a job, the second lowest state unemployment rate in the country. In addition to a healthy job market, incomes are more evenly distributed in South Dakota than in most other states.
This may not remain the case for much longer, however. In the last five years, incomes among the middle 20% of earners have increased by only 5.0%, slightly slower than the 5.3% income growth among comparable households nationwide. Meanwhile, incomes among the wealthiest 20% of households in the state have gone up by 9.8%, higher than the comparable 8.4% average national income growth in the top quintile.
[in-text-ad]

5. Arizona
> Middle class income growth 2011-2015: 4.9% (22nd lowest)
> Fifth quintile income growth: 9.2% (19th highest)
> Fifth quintile share of income: 50.5% (18th highest)
> Middle class household income: $51,612 (21st lowest)
Arizona is one of a handful of states where incomes are rising rapidly for the wealthiest 20%, while middle class household incomes remain relatively stagnant. Arizona’s middle class accounts for just 14.6% of state income, down from 14.9% in 2011. Meanwhile, the state’s top quintile of earners account for 50.5% of income compared to 49.5% half a decade ago.
Income growth disparity is one of several challenges the state faces. Poverty and joblessness are also major issues. Some 17.4% of Arizona residents live in poverty, well above the 14.7% national poverty rate. And, some 5.6% of the Arizona labor force is out of a job, slightly higher than the 4.9% national unemployment rate.
[recirclink id=375300]
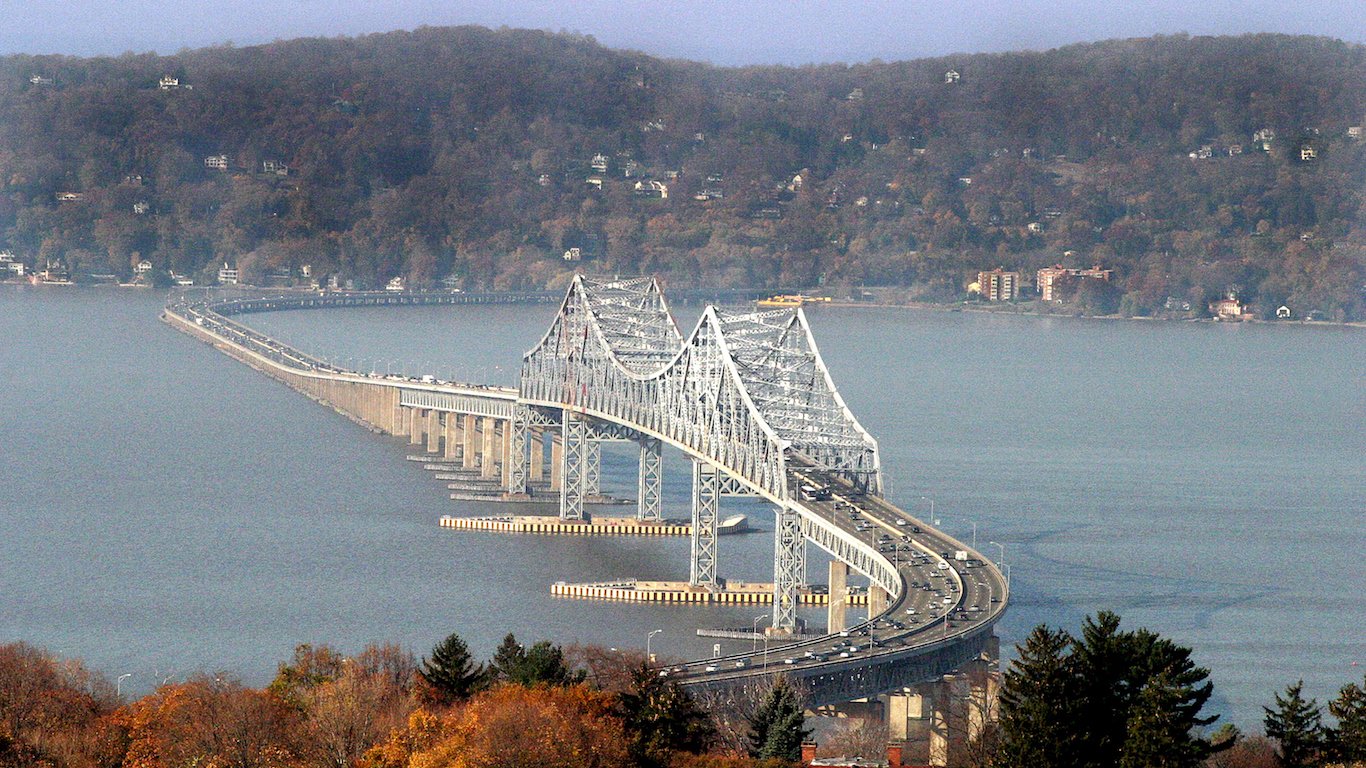
4. New York
> Middle class income growth 2011-2015: 4.4% (20th lowest)
> Fifth quintile income growth: 8.7% (21st highest)
> Fifth quintile share of income: 54.2% (the highest)
> Middle class household income: $60,867 (15th highest)
Income inequality is more pronounced in New York than in any other state in the country. The top 20% of earners in the state account for 54.2% of all income annually, the largest share among all states. Meanwhile, the state’s middle class households earn the equivalent of only 13.5% of all incomes, the smallest share in the country. The disparity appears to be getting worse. Incomes among the state’s highest earning households have increased by 8.7% over the last five years, while middle class incomes have increased by a relatively slight 4.4%.
Incomes among the state’s top 5% of households have increased even more dramatically, jumping by 12.1% in the past half decade. The top 5% of households account for 26% of income in New York annually, more than in any other state.

3. Vermont
> Middle class income growth 2011-2015: 3.2% (11th lowest)
> Fifth quintile income growth: 8.4% (23rd highest)
> Fifth quintile share of income: 48.2% (9th lowest)
> Middle class household income: $57,362 (20th highest)
Incomes among Vermont’s middle class households have gone up by only 3.2% over the last five years, one of the smallest increases of any state. Meanwhile, incomes among the highest earning 20% of Vermont households have gone up by 8.4%. Due in part to slow wage growth, Vermont’s middle class now accounts for 15.4% of all income earned in the state, down from 15.8% in 2011.
Despite slower than average income growth, Vermont’s middle class is relatively well off. The average income among middle class households in the state is $57,362 a year, slightly higher than the $55,947 average income nationwide.
[in-text-ad]

2. Alaska
> Middle class income growth 2011-2015: 2.7% (8th lowest)
> Fifth quintile income growth: 11.7% (8th highest)
> Fifth quintile share of income: 47.2% (3rd lowest)
> Middle class household income: $73,491 (2nd highest)
Incomes among Alaska’s middle class households have gone up by only 2.7% over the last five years, well below the national 5.3% middle class income growth rate. The slow income growth is partially because Alaska’s middle class was relatively well off to begin with. The average income of Alaska’s middle 20% of earners was $71,551 in 2011, the second highest average middle class income of any state in the country. Today, the average middle class Alaskan household income remains the second highest in the country at $73,491 a year.
On the other side of the income spectrum, wage increases are far outpacing comparable national growth. The top 20% of households in the state make 11.7% more now than they did just five years ago, compared to the comparable 8.4% national increase.
[recirclink id=376816]
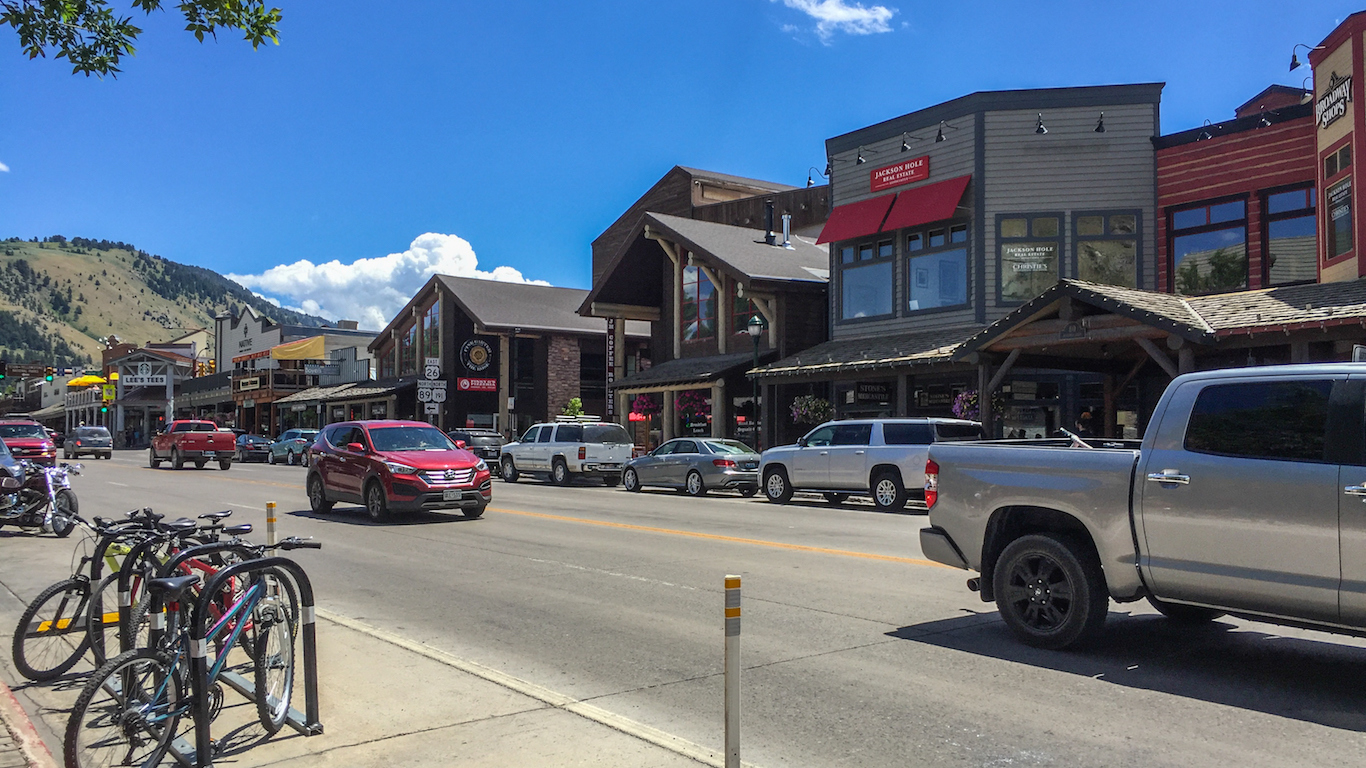
1. Wyoming
> Middle class income growth 2011-2015: 2.5% (5th lowest)
> Fifth quintile income growth: 12.2% (5th highest)
> Fifth quintile share of income: 47.3% (4th lowest)
> Middle class household income: $60,404 (16th highest)
Wyoming’s highest earning 20% of households take home 47.3% of all income annually in the state. Nationwide, the highest earning quintile accounts for some 51.5% of all income. Wyoming’s wealthiest citizens may soon account for a much larger share, however, as their incomes are climbing far faster than incomes of middle class households statewide.
Incomes among Wyoming’s highest earning quintile have increased at nearly five times the income growth among the state’s middle class households over the last five years. Incomes among the state’s wealthiest 5% of households are climbing even faster, surging by 24.7% since 2011, more than double the comparable 11.3% income increase nationwide.
Methodology
To determine the states where the middle class is being left behind, 24/7 Wall St. used data on the average pre-tax income earned by each income quintile from the U.S. Census Bureau’s 2015 American Community Survey. We defined the middle class as the third quintile, or the middle 20% of households. We examined the growth in average household incomes in the third and fifth quintiles between 2011 and 2015 to identify income trends in the middle and upper class. The final list is composed of states where middle class incomes increased at or slower than the national increase for the middle quintile, and where incomes for the upper quintile rose at the same rate or faster than the national upper quintile. Because ACS income data reflect pre-tax levels, they may overstate the degree of income inequality in the poorer quintiles. However, it is unlikely that the tax burden of the third quintile is significant enough to skew the data.
We also looked at data on each state quintile’s share of aggregate state income from the ACS, and how that share changed between 2011 and 2015. Also from the ACS, we reviewed poverty rates and the Gini coefficients. The Gini coefficient indicates the degree to which incomes in an area deviate from a perfectly equal income distribution. Scaled between 0 and 1, a coefficient of 0 represents perfectly equal incomes among all people. All data are from 2011 to 2015. From the Bureau of Labor Statistics (BLS), we looked at annual unemployment rates from January 2011 through January 2016. The percentage of non-agricultural employees who identify as members of a union came from Unionstats.com. Tax data came from the Tax Foundation, a nonpartisan research group, and reflect sales tax rates as of January 1, 2016.
Contact [email protected] for any questions or corrections.