
[cnxvideo id=”507734″ placement=”ros”]For 83 straight months, nearly seven years, the U.S. private sector has added jobs. Unemployment has steadily declined and remains close to a 10-year low. And with investors confident about the economy, the Dow Jones Industrial Average broke through the 20,000 mark early this year. By these and other key measures, business in the United States appears to be booming.
This period of economic growth — much of it as a recovery from the Great Recession — has by no means been even across the country. While employment in North Dakota and Texas grew by 21% and 15% over the past decade, a handful of states, including Mississippi and New Mexico, lost jobs. GDP growth across states has also been uneven.
A number of factors can explain the regional differences in economic growth, including the varying business climates across states. While many factors affect the success of a region’s businesses, socioeconomic conditions, differences in geography, and regional regulations contribute to an overall business environment. Depending on these conditions, running a successful business in one state can be much easier than in another. To determine which states have the best and worst business climates, 24/7 Wall St. identified and reviewed nearly 50 measures of doing business. These were divided into eight major categories: economic conditions, business costs, state infrastructure, the availability and skill level of the workforce, quality of life, regulations, technology and innovation, and cost of living.
Click here to see the best and worst states for business.
A number of region-specific policies, costs, and regulations affect a state’s business climate, including liability and oversight laws, utility costs, insurance requirements, and tax policy.
For many businesses, the most important consideration for choosing one place over another is human capital. Corporations will often choose to locate in major metropolitan area, where costs are higher but where the workforce tends to be more skilled. States that have high shares of adults with bachelor’s and advanced degrees, and states that show growth among the working-age population present a greater diversity of potential hires for corporations.
For many corporations, the potential livability of an area is just as important as the talent pool to be found there. Workers might be more willing to relocate to or stay in a city or state with a lower cost of living, with easier access to airports, less congestion, and more cultural and recreational opportunities. We considered all of these measures in our index.
Another reason businesses choose to locate to a given city or state is to be near other related operations and close to innovation and growth opportunities created and shared by related industries. Such interaction and focus on new technologies can be found in California’s Silicon Valley and North Carolina’s Research Triangle.
Many of the best states for business foster a healthy entrepreneurial atmosphere, with high volumes of venture capital deals and patents issued. Many of these states have a high share of jobs in STEM fields — science, technology, engineering, and math — allowing them to better facilitate technologically advanced business activity. The high presence of STEM jobs, patents, and venture capital indicate the potential for growth and innovation that can allow local businesses to adapt and thrive.
It is important to note that while this index is an attempt to measure the best states for businesses, this list should by no means be treated as the best states for workers. In states with more lax regulations on businesses, workers are more likely exposed to risks and have fewer rights. In our index, we favored states where wages tend to be lower compared to the average compensation across the country, but lower wages are of course a significant negative for workers.
A common argument is that what is good for business is also, in the end, good for workers. Indeed, incomes tend to be higher and unemployment lower in the higher-ranked states on our list, and keeping workers happy is an important consideration for many businesses. But the recent economic recovery appears to have favored corporations more than individuals. While business incomes are higher than ever, the national poverty rate has increased. At the very least, the relationship between what is good for business and what is good for workers is complicated.
These are the best and worst states for business.
Click here to see our full methodology.
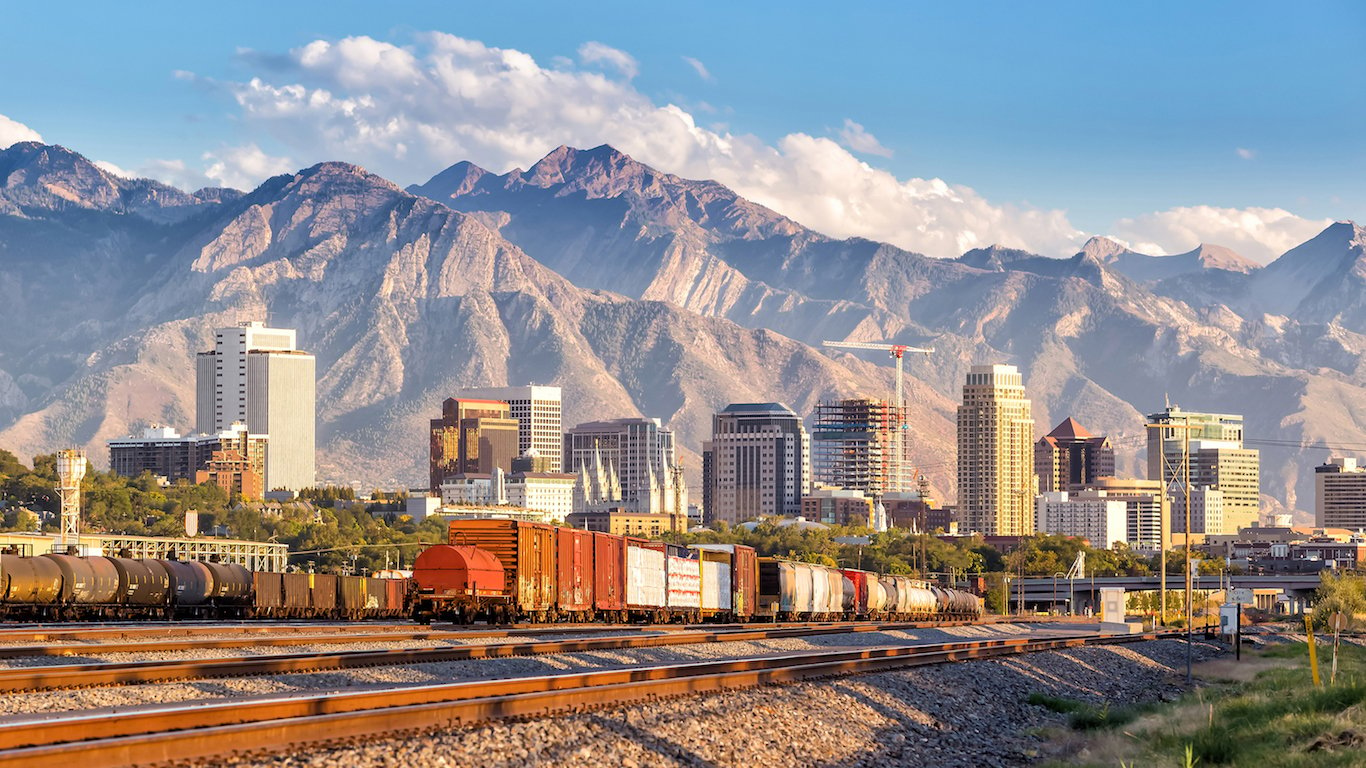
1. Utah
> 1-yr. real GDP change: 3.4% (6th highest)
> Avg. salary: $45,204 (18th lowest)
> Adults w/ bachelor’s degree: 31.8% (16th highest)
> Patents issued: 1,404 (23rd highest)
> Working-age population chg. 2010-2020: +20.5% (2nd highest)
Utah is this year’s best state for business. The state’s labor market and regulatory climate are particularly business friendly compared to other states. Utah’s working-age population is projected to grow by more than 20% between 2010 and 2020, far greater than the comparable projected growth nationwide of less than 5%. Businesses are constantly looking for cost-cutting opportunities. Therefore, a state’s regulatory climate, including its tax policy and the power unions have in the state, can be a major factor when a company is considering where to locate and conduct business. Utah is among the top states in the Mercatus Center’s Regulatory Freedom Index, a ranking of state tax policy. Also, just 3.9% of Utah’s workers are union members, the third lowest share of all states. While this is perhaps less friendly to workers, it is a good sign for most businesses.
[in-text-ad]

2. Massachusetts
> 1-yr. real GDP change: 3.8% (4th highest)
> Avg. salary: $65,196 (2nd highest)
> Adults w/ bachelor’s degree: 41.5% (the highest)
> Patents issued: 6,777 (4th highest)
> Working-age population chg. 2010-2020: -0.6% (12th lowest)
A company’s greatest asset is often its workers, and in Massachusetts, employers have access to a highly qualified labor force. Some 41.5% of state adults have at least a bachelor’s degree, and 18.4% have a graduate or professional degree, each the largest share of any state in the country. Perhaps due to the high levels of educational attainment, Massachusetts’ labor force is especially innovative. About 100 patents were issued per 100,000 state residents in 2014, more than in any other state after California.
Businesses in Massachusetts benefit further from the state’s affluent population. High incomes can contribute to greater consumer spending and are reflective of a healthy economy. The typical Massachusetts household earns $70,628 a year, far more than the $55,775 national median income.
[recirclink id=376999]
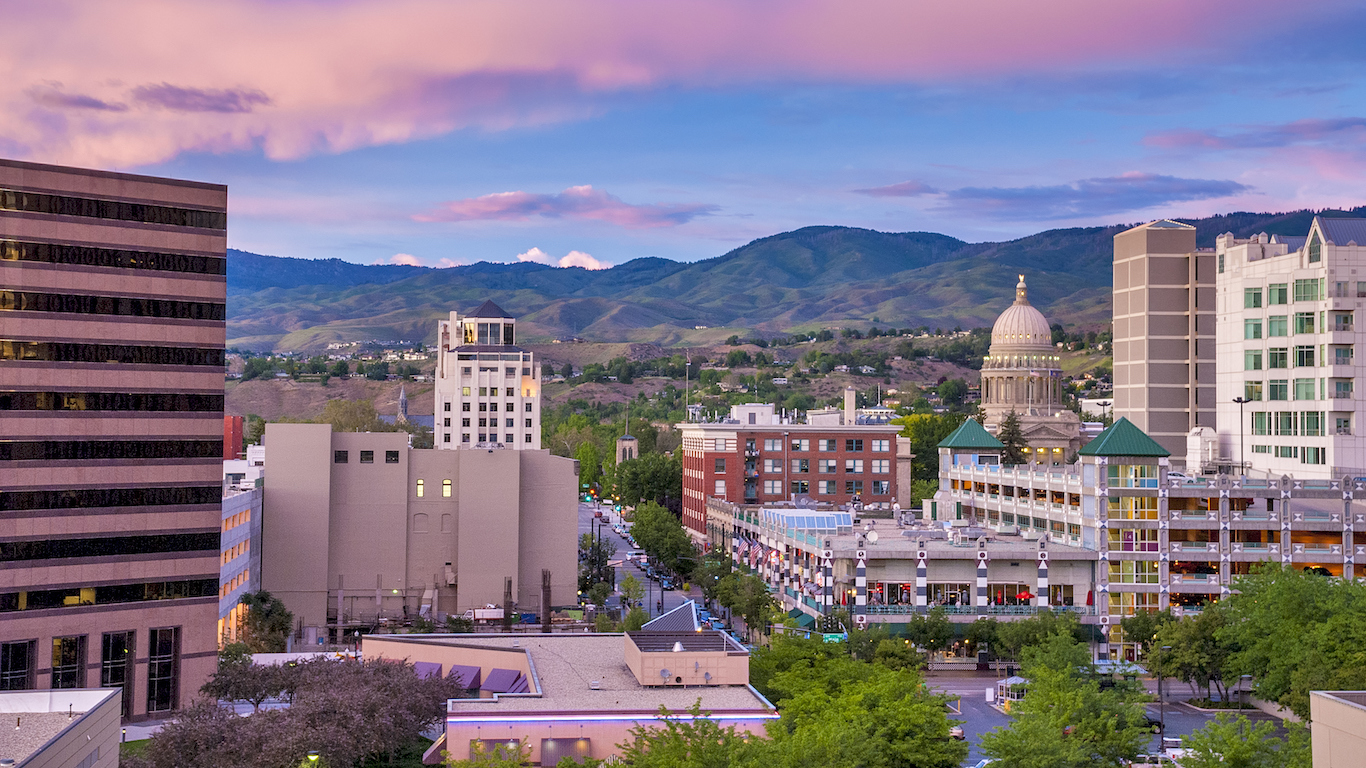
3. Idaho
> 1-yr. real GDP change: 2.7% (10th highest)
> Avg. salary: $39,633 (2nd lowest)
> Adults w/ bachelor’s degree: 26.0% (11th lowest)
> Patents issued: 865 (22nd lowest)
> Working-age population chg. 2010-2020: +15.0% (5th highest)
According to the Census’ Annual Survey of Entrepreneurs, for 31% of businesses in Idaho finding qualified labor is a challenge and a drag on profitability, slightly larger than the national share. This may soon change, however, as Idaho’s working-age population is projected to grow by 15% between 2010 and 2020, roughly triple the corresponding national growth rate.
Currently, businesses in the state benefit from a relatively low level of government regulations. Idaho is a right-to-work state. Only 6.8% of workers in Idaho are union members, well below the 11.1% share of all U.S. workers. The average salary for a worker in Idaho is only $39,633 a year, second lowest in the country. While low salaries may not satisfy workers, they are a boon for businesses.

4. Colorado
> 1-yr. real GDP change: 3.2% (7th highest)
> Avg. salary: $54,900 (11th highest)
> Adults w/ bachelor’s degree: 39.2% (2nd highest)
> Patents issued: 3,045 (14th highest)
> Working-age population chg. 2010-2020: +8.6% (11th highest)
One of the best aspects of Colorado’s business climate is the state’s deep pool of talented workers. An estimated 39.2% of Colorado adults have at least a bachelor’s degree, the largest share of any state other than Massachusetts. Some 14.5% of adults in the state also have a graduate or professional degree, the seventh most of all states. This high level of qualification among residents likely helps attract high paying, high-tech business to the area. Some of the highest paying occupations are in science, technology, engineering, and mathematics (STEM) fields, which in Colorado comprise 7.4% of all jobs — the fourth highest share of any state.
The state’s decision to legalize marijuana in 2012 created an industry trail blazed by small businesses and entrepreneurs, which generated over $1.1 billion in the first 10 months of 2016. A growing economy, Colorado issued the sixth most new building permits per capita in 2015 and had the fifth fastest growth in private business establishments.
[in-text-ad-2]

5. North Dakota
> 1-yr. real GDP change: -2.6% (the lowest)
> Avg. salary: $49,795 (19th highest)
> Adults w/ bachelor’s degree: 29.1% (24th lowest)
> Patents issued: 118 (4th lowest)
> Working-age population chg. 2010-2020: +0.4% (15th lowest)
North Dakota has experienced something of a modern gold rush in recent years. After the discovery of the Parshall Oil Field in the Bakken formation in 2006, North Dakota ramped its oil production from less than 200,000 barrels a day to more than 1 million by 2014. While the oil boom has slowed considerably since then, North Dakota’s GDP annual growth rate of 7.7% from 2010 to 2015 was more than that of any other state and four times the national growth rate.
For the many Americans who relocated to North Dakota during the oil boom, the move was likely made easier by the state’s low cost of living. Goods and services cost 92 cents on the dollar in North Dakota compared to the nation as a whole, and the state’s median homeownership expenses amount to just 17.5% of household income — a smaller share than in any state other than West Virginia.

6. Washington
> 1-yr. real GDP change: 3.0% (8th highest)
> Avg. salary: $57,057 (8th highest)
> Adults w/ bachelor’s degree: 34.2% (11th highest)
> Patents issued: 6,378 (5th highest)
> Working-age population chg. 2010-2020: +7.5% (14th highest)
The headquarters of Amazon.com, Starbucks, Costco, and Microsoft, Washington is home to some of the nation’s largest, most profitable, and innovative companies. The state’s record of innovation may be partially due to the 8.3% of the Washington workforce employed in STEM fields, the largest share in the country. Washington’s entrepreneurial climate is also reflected by the high number of investments and inventions made in the state. In 2014, Washington residents closed 116 venture capital deals and won 6,378 patents, or 88 patents per capita — third most of any state.
Washington is also the third largest exporter of all states. Located on the Pacific Coast, roughly one-third of Washington’s exports go to China, Japan, and South Korea. Airplane parts account for 59% of all state exports, a significant portion of which are manufactured by Boeing. Washington’s value of exports per capita, at $11,849, is more than any other state.
[in-text-ad]

7. Texas
> 1-yr. real GDP change: 4.8% (2nd highest)
> Avg. salary: $53,769 (12th highest)
> Adults w/ bachelor’s degree: 28.4% (23rd lowest)
> Patents issued: 9,934 (2nd highest)
> Working-age population chg. 2010-2020: +16.1% (4th highest)
Texas is home to several of the nation’s largest metropolitan economies. While depressed oil prices have of late dealt much of the Texas economy a blow, the major metro economies of Dallas, Austin, and other areas have remained strong, providing companies throughout the state a solid climate to do business. The GDP of Texas grew at an average rate of 4.8% each year between 2010 and 2015, the second fastest growth rate behind North Dakota. Texas had 630 building permits issued per 100,000 residents in 2015, also second only to North Dakota, and another indication of economic confidence among businesses operating in the state.
[recirclink id=377173]
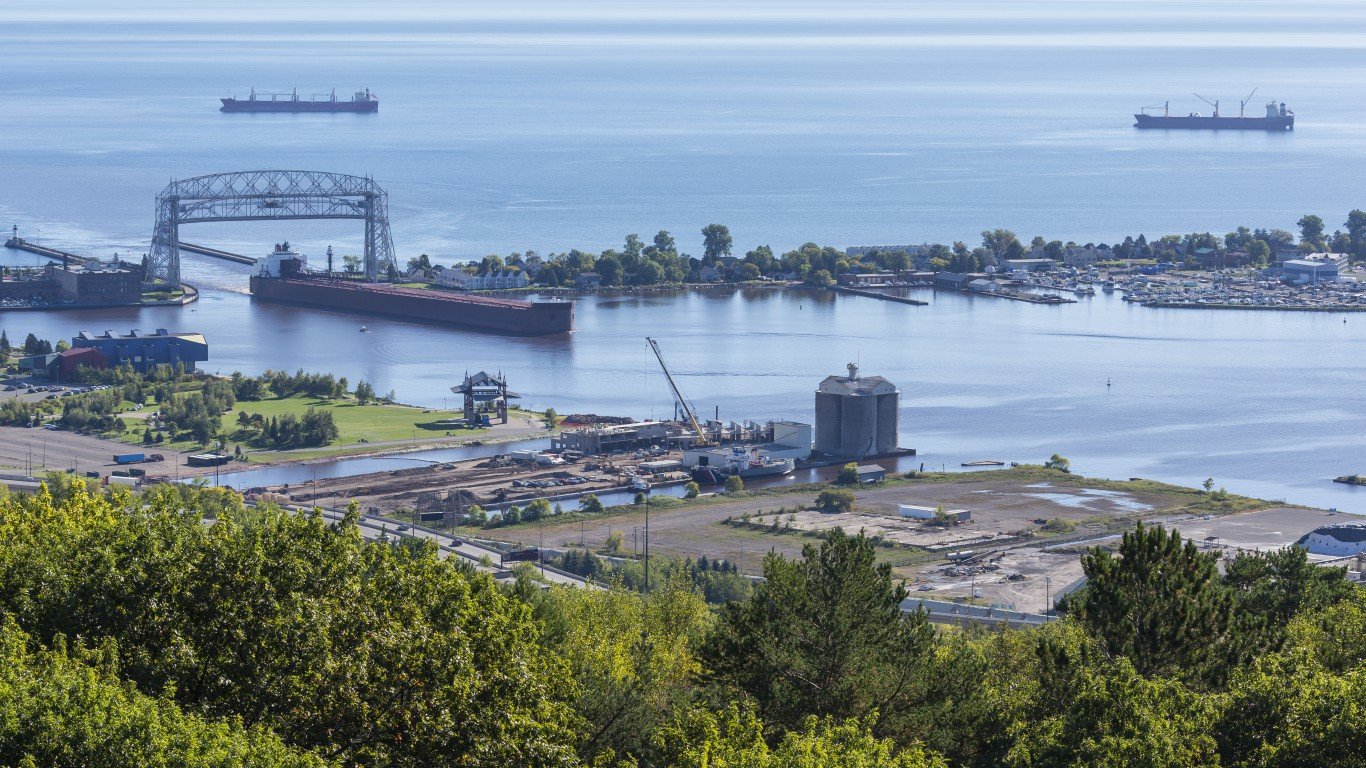
8. Minnesota
> 1-yr. real GDP change: 1.9% (23rd highest)
> Avg. salary: $52,632 (14th highest)
> Adults w/ bachelor’s degree: 34.7% (10th highest)
> Patents issued: 4,394 (9th highest)
> Working-age population chg. 2010-2020: +1.7% (21st lowest)
Minnesota has some of the best infrastructure of any state. The state has 142 airports, and well-maintained, functional roadways. Just 8.9% of bridges are structurally deficient, the smallest share nationwide. For every mile of interstate in Minnesota, the trucking industry lost an estimated $43,014 in operational costs due to congestion in 2016 — one of the smaller losses from traffic of any state.
Minnesota also has one of the most active entrepreneurial environments in the country. State residents closed 30 venture capital deals in 2014 at an average of $12.4 million per deal — the eighth most of any state. Residents were also awarded an average of 80 patents per 100,000 people, nearly twice the national average. Minnesota’s large share of workers employed in STEM fields, at 6.0%, also helps support the state’s innovative business climate.

9. Delaware
> 1-yr. real GDP change: 2.7% (10th highest)
> Avg. salary: $53,175 (13th highest)
> Adults w/ bachelor’s degree: 30.9% (19th highest)
> Patents issued: 361 (13th lowest)
> Working-age population chg. 2010-2020: +8.9% (9th highest)
Delaware’s regulations are extremely favorable to businesses. The state’s tax structure gives businesses more opportunities for loopholes. For example, state law allows business disputes to be settled swiftly by a judge without a jury, which is considered favorable to businesses. Also, state policies allow businesses to minimize liability. With such favorable regulations, the vast majority of American companies are incorporated in Delaware — a state with the sixth smallest population in the country. According to the state government website, approximately two-thirds of all publicly traded U.S. companies are incorporated in the state.
[in-text-ad-2]
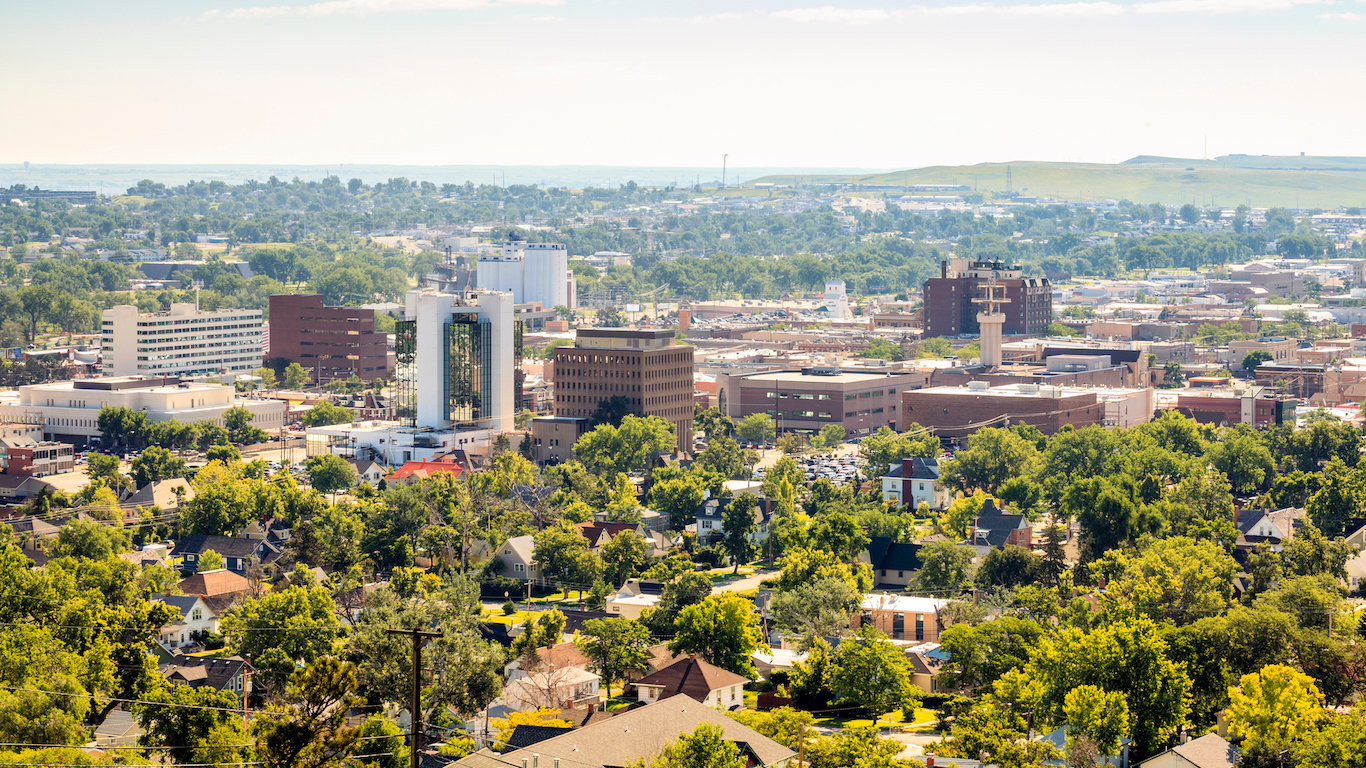
10. South Dakota
> 1-yr. real GDP change: 2.6% (13th highest)
> Avg. salary: $39,658 (3rd lowest)
> Adults w/ bachelor’s degree: 27.5% (17th lowest)
> Patents issued: 113 (3rd lowest)
> Working-age population chg. 2010-2020: +3.7% (22nd highest)
South Dakota has one of the the most business-friendly tax climates of any state. The estimated tax burden for state residents, at just 7.1% of per capita income, is second lowest of all states. Low taxes leave residents with more disposable income that can lead to more spending at area businesses. On the Annual Survey of Entrepreneurs just 30.8% of surveyed South Dakota businesses said their profits were hurt by slow sales, the smallest share nationwide. The state has an active economy with a 3.1% unemployment rate, the third lowest in the country. South Dakota’s GDP has grown by an average 2.0% annually since 2010, one of the fastest growth rates of any state.
In the same survey, however, 36.0% of South Dakota businesses cited finding qualified labor as having a negative impact on profits, the largest share in the country. One reason may be the small share of adults with a graduate degree, which at 7.9% is fifth smallest of any state.

11. New Hampshire
> 1-yr. real GDP change: 1.4% (21st lowest)
> Avg. salary: $51,752 (15th highest)
> Adults w/ bachelor’s degree: 35.7% (8th highest)
> Patents issued: 850 (21st lowest)
> Working-age population chg. 2010-2020: -1.9% (8th lowest)
Businesses may have little difficulty attracting qualified workers in New Hampshire. An estimated 93.1% of residents have at least a high school diploma, and 35.7% a bachelor’s degree, the second and eighth highest such rates of any state. New Hampshire residents also enjoy relatively abundant amenities and other indications of a high quality of life, which can make an area more attractive to business and prospective employees. There are 57 art, entertainment, and recreation establishments per 100,000 people, one of the highest such figures nationwide. Just 199 violent crimes were reported per 100,000 New Hampshire residents in 2015, the fourth lowest crime rate of any state.
Low crime levels are likely tied to the state’s low poverty and unemployment rates. Just 3.4% of New Hampshire’s workforce is unemployed, and 8.1% of the population lives in poverty, far below the corresponding 5.3% and 14.7% national rates.
[in-text-ad]
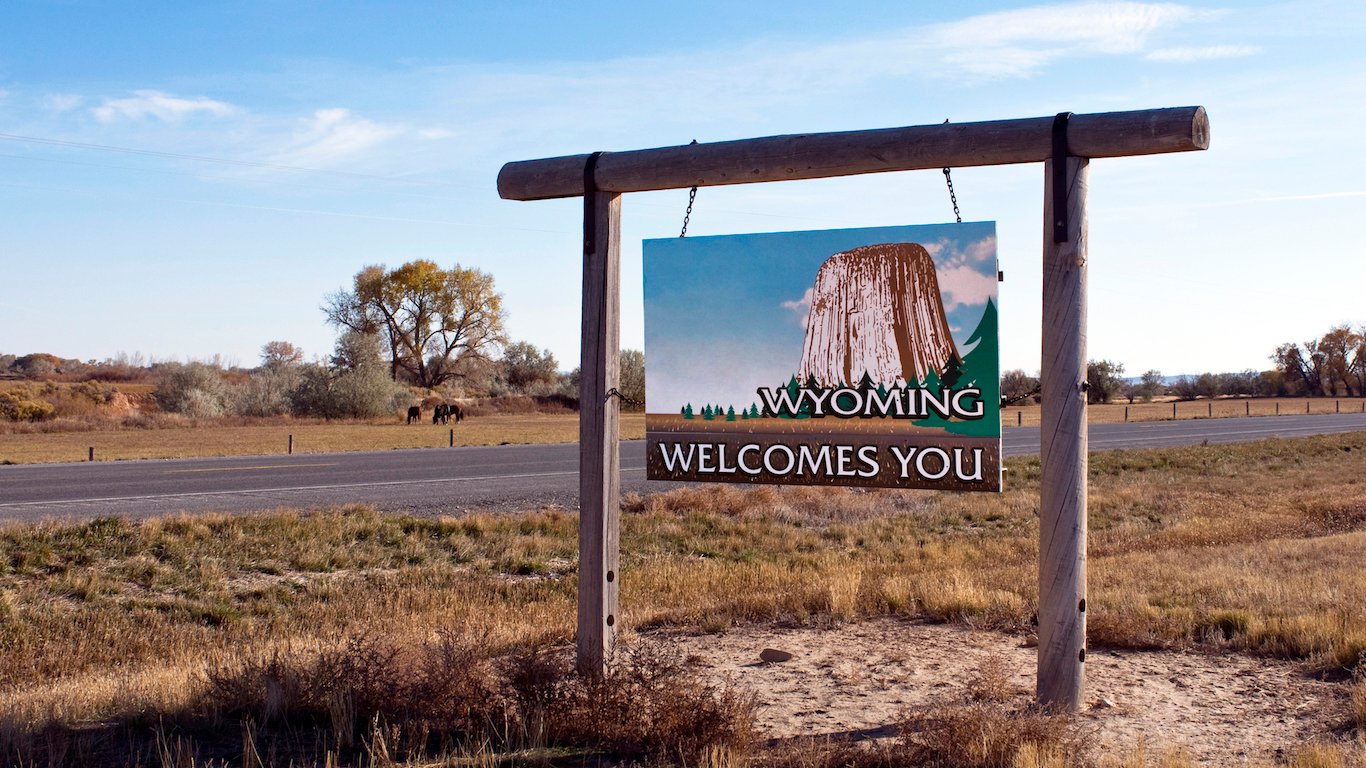
12. Wyoming
> 1-yr. real GDP change: -0.1% (3rd lowest)
> Avg. salary: $47,173 (24th lowest)
> Adults w/ bachelor’s degree: 26.2% (12th lowest)
> Patents issued: 110 (2nd lowest)
> Working-age population chg. 2010-2020: +8.8% (10th highest)
Wyoming’s low cost of living benefits consumers and businesses alike. Annual homeownership expenses amount to just 19.1% of the state’s median household income, the third smallest share nationwide. Additionally, state and local taxes amount to just 7.1% of income per capita, tied with South Dakota as the second smallest average tax burden in the country. With low housing costs and a relatively low tax burden, consumers may have more disposable income to spend at businesses in Wyoming. Further, retail electricity costs an average of 8 cents per kilowatt-hour, the fourth lowest price of any state. On the Annual Survey of Entrepreneurs, just 8.1% of Wyoming businesses claimed the cost of resources needed to conduct business has had a negative impact on profits, the smallest share of any state.
[recirclink id=376616]

13. Virginia
> 1-yr. real GDP change: 2.0% (18th highest)
> Avg. salary: $55,663 (10th highest)
> Adults w/ bachelor’s degree: 37.0% (6th highest)
> Patents issued: 2,057 (19th highest)
> Working-age population chg. 2010-2020: +7.5% (13th highest)
A safe community is often essential for businesses to thrive. With one of the lowest violent crime rates of any state, Virginia is a relatively safe and potentially attractive destination for businesses. The state is one of only four with fewer than 200 violent crimes annually per 100,000 residents.
Employers in the Old Dominion State also have a highly educated talent pool to select from. Some 37.0% of adults in the state have at least a bachelor’s degree, and 15.7% have a graduate or professional degree, each among the higher shares of any U.S. state. High educational attainment tends to track closely with greater numbers of STEM occupations. Such science and technology workers comprise 8% of Virginia’s labor force, the third highest share of all states.

14. Maryland
> 1-yr. real GDP change: 2.0% (18th highest)
> Avg. salary: $58,639 (6th highest)
> Adults w/ bachelor’s degree: 38.8% (3rd highest)
> Patents issued: 1,838 (22nd highest)
> Working-age population chg. 2010-2020: +3.6% (24th highest)
A highly educated population is often a major draw as businesses are more likely to choose to locate to an area with a talented workforce. In Maryland, employers likely benefit from a highly skilled workforce, as 38.8% of adults have at least a bachelor’s degree, and 17.7% have a graduate or professional degree, the third and second highest proportions of any state.
Not surprisingly, Maryland is home to a disproportionately high share of science, technology, engineering, and math workers. Of all jobs in the state, 8.2% are STEM jobs, the second highest share in the country. These kinds of jobs can create higher incomes and increase the spending power of the population. They also are reflect the potential for growth and innovation among businesses.
[in-text-ad-2]
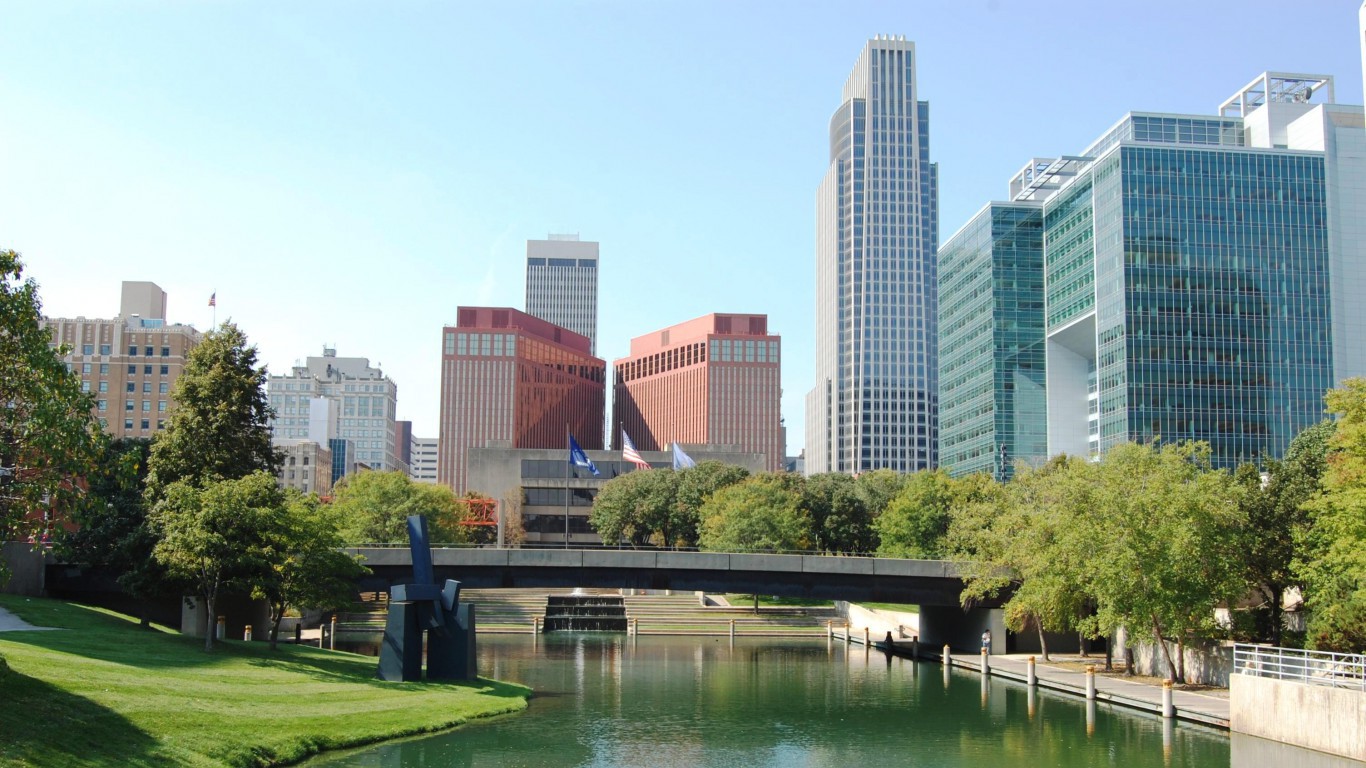
15. Nebraska
> 1-yr. real GDP change: 0.9% (11th lowest)
> Avg. salary: $44,385 (14th lowest)
> Adults w/ bachelor’s degree: 30.2% (21st highest)
> Patents issued: 313 (11th lowest)
> Working-age population chg. 2010-2020: +2.4% (24th lowest)
Businesses in Nebraska benefit from a number of favorable conditions. Commercial real estate is cheaper in Nebraska than in the majority of states, as are commercial electricity costs. In addition, according to a census survey of entrepreneurs, customers in Nebraska are more likely to pay in full and on time than customers in any other state.
Nebraska’s business climate is further bolstered by reliable infrastructure. Only 6.7% of miles of roadway in the state are in poor condition, well below the 11.2% share nationwide, and traffic congestion is much less of a problem in Nebraska than it is in the majority of other states, allowing for cheaper transportation costs, and curbing business lost due to late workers.

16. North Carolina
> 1-yr. real GDP change: 2.0% (18th highest)
> Avg. salary: $47,465 (25th lowest)
> Adults w/ bachelor’s degree: 29.4% (25th lowest)
> Patents issued: 3,354 (13th highest)
> Working-age population chg. 2010-2020: +12.5% (7th highest)
In North Carolina, a stark economic divide exists between the urban and rural parts of the state. While Charlotte, Raleigh, Durham, and other cities have experienced substantial economic growth since the recession, population loss in rural parts of the state has limited economic recovery, as businesses in these areas have struggled to fill available positions. The result has been average growth for the state as a whole. North Carolina’s GDP grew 2.0% in 2014, slightly less than the 2.5% national growth rate. Similarly, the state’s 5.7% unemployment rate is slightly higher than the 5.3% national figure.
[in-text-ad]
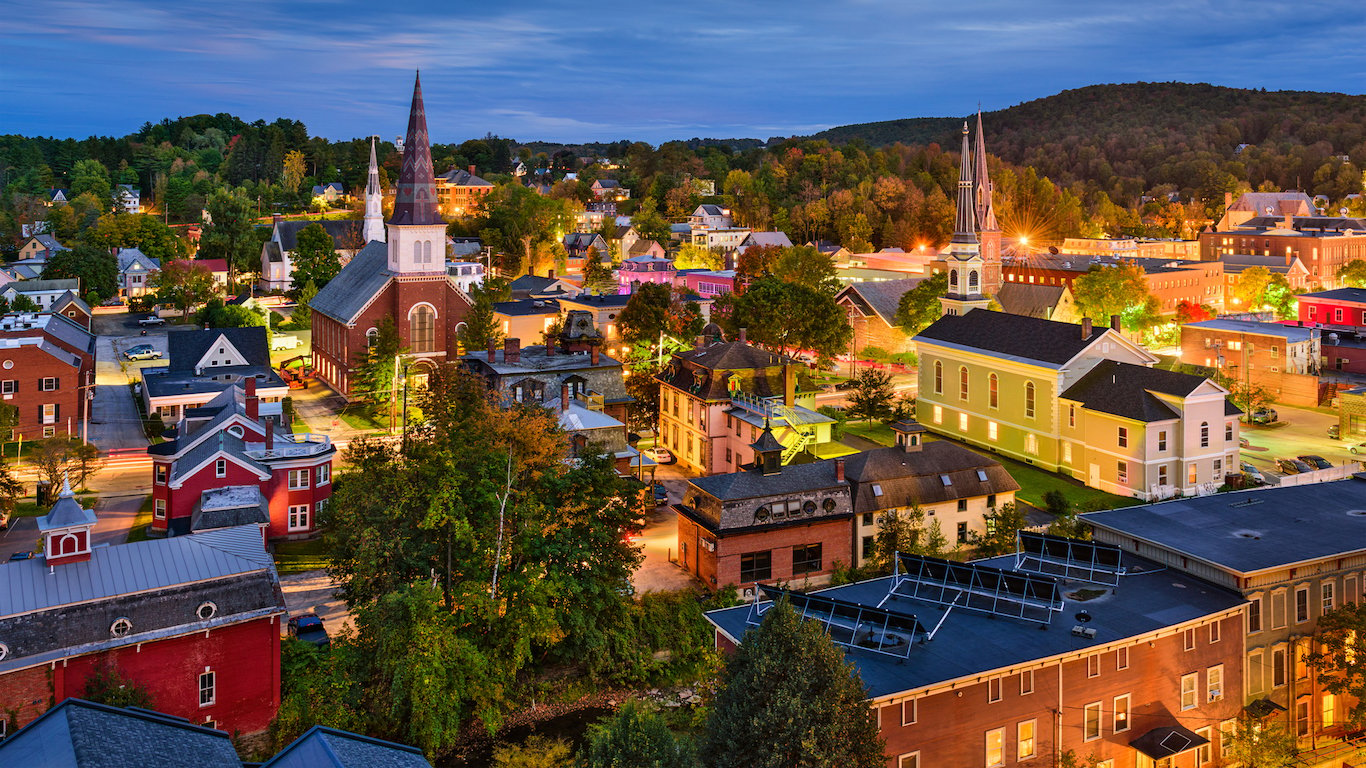
17. Vermont
> 1-yr. real GDP change: 0.4% (4th lowest)
> Avg. salary: $43,360 (11th lowest)
> Adults w/ bachelor’s degree: 36.9% (7th highest)
> Patents issued: 451 (16th lowest)
> Working-age population chg. 2010-2020: -5.2% (2nd lowest)
While some aspects of Vermont’s business climate are excellent, others are quite poor. For example, Vermont is exceptionally safe, residents are well educated, and Vermonters display a relatively high level of innovation. There were just 118 violent crimes reported per 100,000 people in 2015, by far the lowest of all states. The percentage of adults with at least a bachelor’s degree, at 36.9%, is seventh highest of all states. And while the average value of a venture capital investment in the state is $2.55 million — one of the lower figures — there were 72 patents issued for every 100,000 residents in 2014, fifth most of all states.
What may be holding the state back is its shrinking workforce. A sufficient pool of applicants is critical for businesses to grow and function optimally. Vermont’s working population is projected to shrink by 5.2% by the end of the decade through 2020.
[recirclink id=377173]
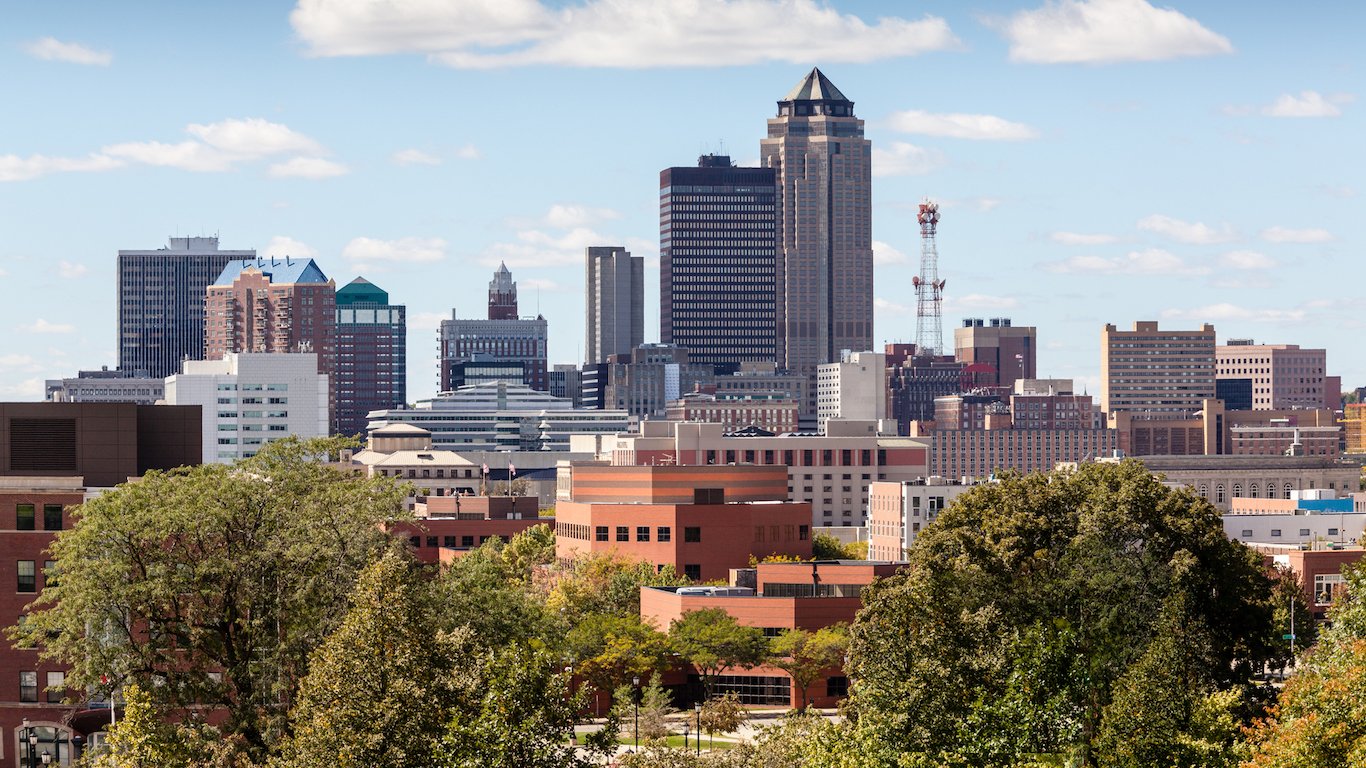
18. Iowa
> 1-yr. real GDP change: 1.3% (15th lowest)
> Avg. salary: $43,134 (9th lowest)
> Adults w/ bachelor’s degree: 26.8% (16th lowest)
> Patents issued: 992 (25th lowest)
> Working-age population chg. 2010-2020: +0.1% (14th lowest)
One clear sign of a favorable business climate is economic growth. Over the five years through 2015, Iowa’s economy expanded by 2.0% on average each year, slightly faster than the national average growth rate.
For businesses, it is also important for a state to be appealing to potential employees considering relocation. One such attraction in Iowa is affordability. For example, housing in Iowa is among the least expensive in the country, with the median annual costs of homeownership coming to 19.2% of median household income, versus the national average of 23.8%. The overall cost of goods and services in the state is roughly 90% of the average cost across the country.

19. California
> 1-yr. real GDP change: 3.8% (4th highest)
> Avg. salary: $62,104 (4th highest)
> Adults w/ bachelor’s degree: 32.3% (14th highest)
> Patents issued: 40,196 (the highest)
> Working-age population chg. 2010-2020: +5.2% (20th highest)
Though it is better than in most states, California’s business climate is a mix of favorable and unfavorable conditions. The most populous state in the country, employers in California are among the least likely to struggle to find qualified labor. Parts of the state are also hotbeds of innovation. Across the state, there were 1,773 venture capital deals in 2014 alone, accounting for over 40% of all venture capital deals nationwide that year. Many of these deals funded tech startups in Silicon Valley, a region just south of San Francisco and home to such companies as Apple, Facebook, and Google.
However, operating a business is not cheap in California. Commercial real estate and electricity costs are each nearly the highest in the country. Additionally, the state’s high cost of living translates to strains on payroll departments. The average salary among workers in California is $62,104 a year, higher than in all but three other states.
[in-text-ad-2]

20. Arizona
> 1-yr. real GDP change: 1.4% (21st lowest)
> Avg. salary: $48,854 (22nd highest)
> Adults w/ bachelor’s degree: 27.7% (18th lowest)
> Patents issued: 2,540 (15th highest)
> Working-age population chg. 2010-2020: +18.8% (3rd highest)
Arizona is favorably for business by some metrics, but quite poor in others. For example, on the Annual Survey of Entrepreneurs, business owners in Arizona were less likely than those in most states to cite either taxes or trouble finding qualified workers as having a negative impact on profits. At the same time, state business owners are among the most likely to say poor access to financial capital was a hindrance to doing business.
An affluent population usually helps companies, especially customer-facing businesses, flourish. However, Arizona has one of the higher poverty rates in the country, and the state’s median household income falls below that of the nation.

21. Georgia
> 1-yr. real GDP change: 2.6% (13th highest)
> Avg. salary: $50,519 (18th highest)
> Adults w/ bachelor’s degree: 29.9% (23rd highest)
> Patents issued: 2,465 (16th highest)
> Working-age population chg. 2010-2020: +12.0% (8th highest)
Only about a quarter of entrepreneurial enterprises in Georgia reported struggling to find qualified labor, one of the smaller shares of any state. Labor shortages will likely be even less of a problem in the coming years. The state’s working-age population is projected to increase by 14.3% between 2010 and 2020, more than double the corresponding national growth rate.
However, the limited spending power among a relatively large share of consumers in the Peach State is not helping business. The typical Georgia household earns $51,244 a year, or $4,500 less than the typical American household. Also, 17% of state residents live in poverty, one of the larger shares of any state.
[in-text-ad]

22. Florida
> 1-yr. real GDP change: 4.0% (3rd highest)
> Avg. salary: $47,686 (25th highest)
> Adults w/ bachelor’s degree: 28.4% (23rd lowest)
> Patents issued: 4,054 (10th highest)
> Working-age population chg. 2010-2020: +13.6% (6th highest)
Florida has a reputation for being a destination for retirees, but the state also has a growing population of younger residents, which will likely benefit state businesses looking for workers. The working-age population in the state is projected to grow by 13.6% between 2010 and 2020, nearly three times the national growth rate. According to the Census’ Annual survey of Entrepreneurs, Florida also has a highly favorable tax structure for startups.
On the other hand, entrepreneurs in the same study were among the most likely in the country to report difficulty accessing financial capital.
[recirclink id=376243]
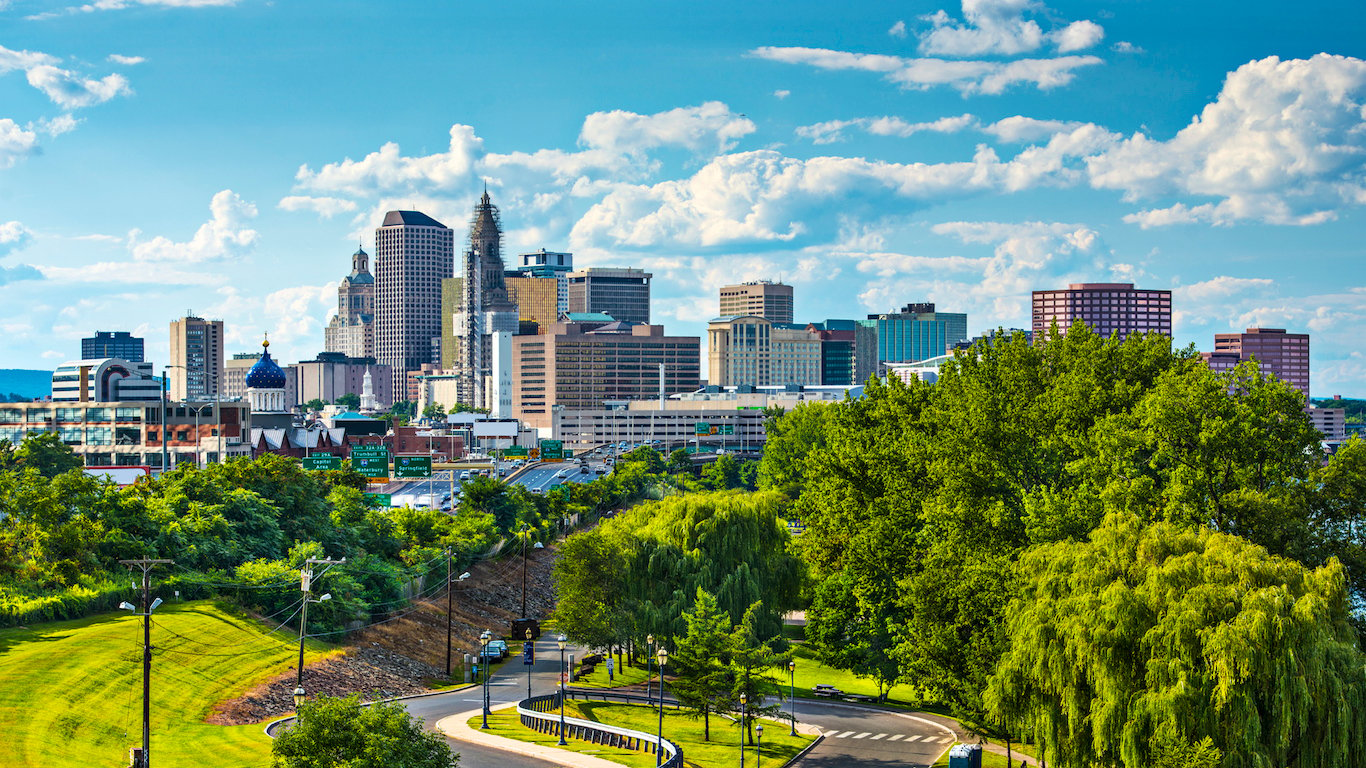
23. Connecticut
> 1-yr. real GDP change: 0.7% (7th lowest)
> Avg. salary: $64,551 (3rd highest)
> Adults w/ bachelor’s degree: 38.3% (4th highest)
> Patents issued: 2,158 (18th highest)
> Working-age population chg. 2010-2020: +1.1% (18th lowest)
In Connecticut, opposing forces work to both foster and stymie a healthy business environment. One favorable condition is the state’s deep talent pool. An estimated 38.3% of Connecticut adults have at least a bachelor’s degree, and 16.7% have a graduate or professional degree, the fourth and third largest shares of any state.
However, population loss and outbound migration have hindered economic growth in Connecticut, and other signs point to low confidence in the state’s economy. On the Annual Survey of Entrepreneurs, nearly half of all Connecticut businesses claimed slow sales have hurt profits, the third largest share of any state. The number of private establishments grew by just 0.1% in 2013, and in 2015 just 170 building permits were issued per 100,000 residents, less than half the national average.

24. New Jersey
> 1-yr. real GDP change: 2.0% (18th highest)
> Avg. salary: $61,765 (5th highest)
> Adults w/ bachelor’s degree: 37.6% (5th highest)
> Patents issued: 4,602 (8th highest)
> Working-age population chg. 2010-2020: +0.9% (17th lowest)
New Jersey has one of the most active entrepreneurial environments in the country. There were an estimated 53 venture capital deals in New Jersey in 2014 at an average of $18.2 million per deal — roughly $4.8 million more than the national average deal value. State workers and businesses were also awarded 51 patents per 100,000 people, among the most of any state.
One drawback to New Jersey’s business environment is the state’s poor roadway infrastructure. Despite spending $191,903 per mile on highways, nearly five times the national average, an estimated 31.0% of New Jersey roads are designated to be in poor condition, the third largest share of any state. For every mile of interstate in New Jersey in 2016, the trucking industry lost an estimated $526,323 in operational costs due to congestion, more than any other state.
[in-text-ad-2]
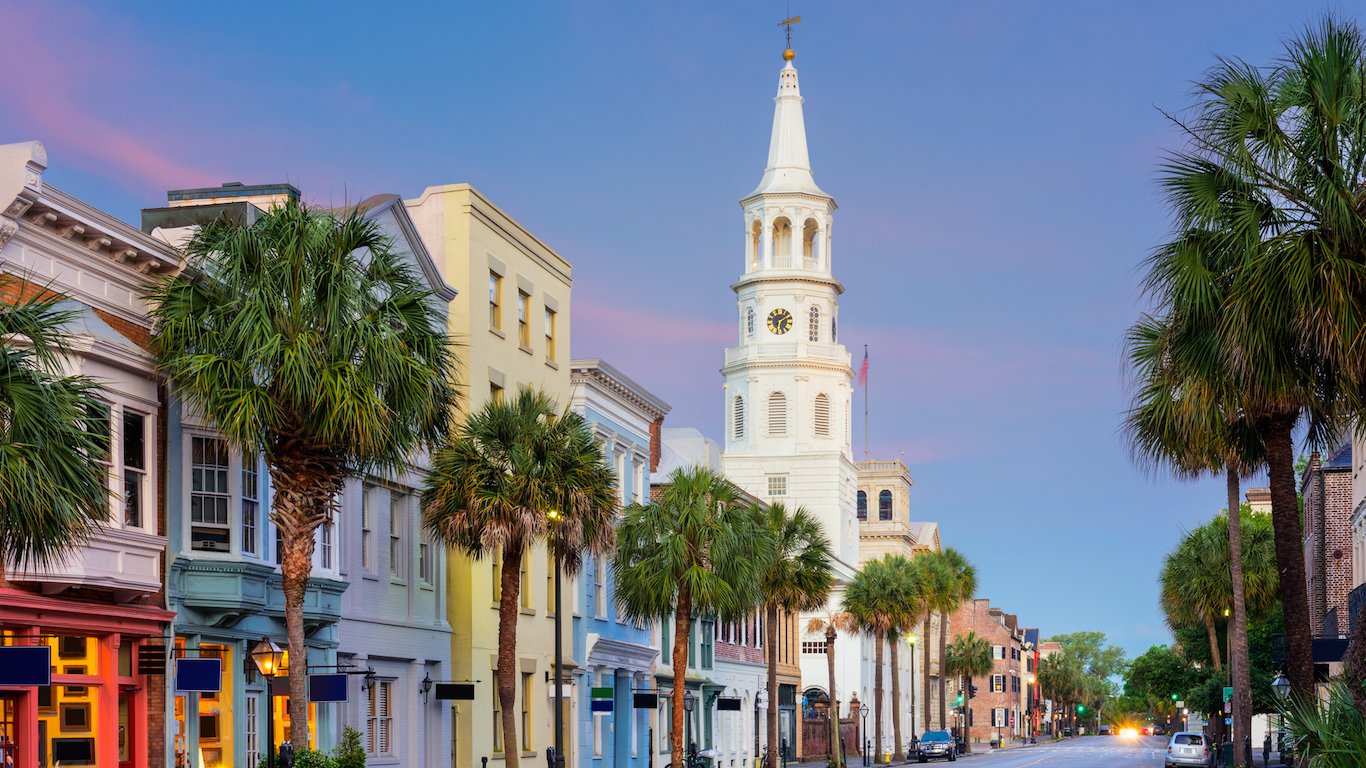
25. South Carolina
> 1-yr. real GDP change: 2.5% (15th highest)
> Avg. salary: $43,223 (10th lowest)
> Adults w/ bachelor’s degree: 26.8% (16th lowest)
> Patents issued: 950 (24th lowest)
> Working-age population chg. 2010-2020: +8.2% (12th highest)
Businesses are less likely to thrive in dangerous, high crime areas — even the perception that a community is unsafe can be a major hindrance to commerce. In South Carolina there were 505 violent crimes for every 100,000 residents in 2015, more than in all but six other states. The state’s high violent crime rate does not likely help consumer spending. More than 45% of South Carolina business owners said they struggle slow sales, a larger share than in most other states.
Some conditions in South Carolina are favorable to employers, however. South Carolina is a right-to-work state. Only 2.1% of workers in the state are unionized, the smallest share nationwide.

26. Tennessee
> 1-yr. real GDP change: 2.7% (10th highest)
> Avg. salary: $46,176 (20th lowest)
> Adults w/ bachelor’s degree: 25.7% (10th lowest)
> Patents issued: 1,009 (25th highest)
> Working-age population chg. 2010-2020: +6.3% (16th highest)
Tennessee’s economy is expanding slightly faster than the economies of most states. The state’s GDP has grown at an average annual rate of 2.4% over the five years through 2015, faster than the 1.9% national growth rate. Also, an estimated 483 building permits were issued per 100,000 state residents in 2015, far more than the 366 permits issued per 100,000 Americans nationwide — a reflection of GDP growth as well as an indication of economic confidence. S&P recently upgraded the Tennessee’s credit rating from AA+ to AAA, the highest possible rating. The upgrade was issued in response to the state’s growing economy, growing rainy day fund, and falling debt levels.
Despite the growing economy, Tennessee lags behind most states in a number of measures tied to innovation. Just 3.7% of workers are employed in STEM fields, and residents were awarded just 15 patents per 100,000 people in 2014 — each among the lowest figures nationwide.
[in-text-ad]
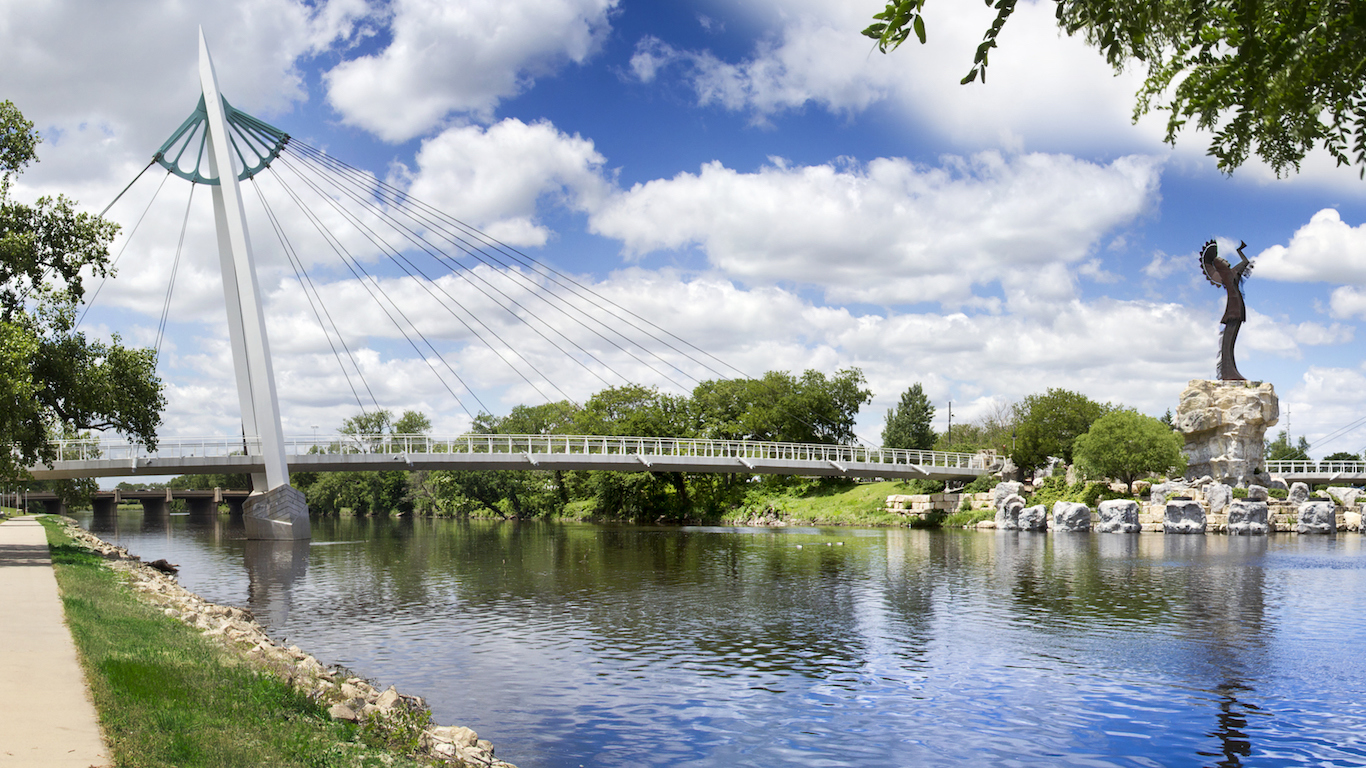
27. Kansas
> 1-yr. real GDP change: 0.8% (8th lowest)
> Avg. salary: $44,998 (16th lowest)
> Adults w/ bachelor’s degree: 31.7% (17th highest)
> Patents issued: 915 (23rd lowest)
> Working-age population chg. 2010-2020: +1.7% (20th lowest)
For companies that rely heavily on the quality of roads and other infrastructure systems, Kansas is one of the best states for business. Just 2.2% of Kansas roads are in sub-optimal condition, the lowest percentage of all states and in stark contrast to the 11.2% of roads in need of repair nationwide.
The Kansas economy is struggling compared to most states, however. Credit agencies Moody’s and S&P rate the state Aa2 negative and AA- stable, each worse than the majority of states.
[recirclink id=377173]

28. Nevada
> 1-yr. real GDP change: 1.6% (23rd lowest)
> Avg. salary: $47,091 (23rd lowest)
> Adults w/ bachelor’s degree: 23.6% (6th lowest)
> Patents issued: 725 (20th lowest)
> Working-age population chg. 2010-2020: +28.4% (the highest)
A safe, relatively crime free neighborhood is often a prerequisite for a successful business. While there are plenty of safe parts in the state, violent crime is a considerable problem in Nevada. There were 696 violent crimes, including aggravated assault, robbery, and murder, for every 100,000 residents in 2015, the second highest violent crime rate of any state in the country.
Nevada’s economy is also hurting. The state’s 6.7% unemployment rate in 2015 was the highest of any state, and a rapidly expanding labor force may add additional strain. Nevada’s working-age population is on pace to increase by 28.4% between 2010 and 2020, the largest population expansion of any state. While a high jobless rate and growing population gives employers more options, it is also a sign of a suffering economy, which can translate to lower consumer spending.

29. Michigan
> 1-yr. real GDP change: 1.6% (23rd lowest)
> Avg. salary: $49,590 (20th highest)
> Adults w/ bachelor’s degree: 27.8% (20th lowest)
> Patents issued: 5,561 (6th highest)
> Working-age population chg. 2010-2020: -7.6% (the lowest)
Michigan has one of the most active entrepreneurial environments nationwide. Some 56 patents were awarded per 100,000 Michigan residents in 2014, among the most of any state. The high degree of innovation is likely supported by the relatively high 6.2% share of Michigan workers employed in STEM fields, the seventh largest share of any state.
Despite Michigan’s entrepreneurial climate, population loss and outbound migration has slowed economic growth in the state. In the decade between 2010 and 2020, Michigan’s working-age population is projected to decline by 7.6%, the largest decrease nationwide. With relatively few new residents, just 183 building permits per 100,000 residents were issued in Michigan in 2015, roughly half the national average. The state’s GDP grew by just 1.6% in 2014, far less than the 2.5% national growth rate.
[in-text-ad-2]

30. Oregon
> 1-yr. real GDP change: 4.9% (the highest)
> Avg. salary: $49,206 (21st highest)
> Adults w/ bachelor’s degree: 32.2% (15th highest)
> Patents issued: 2,366 (17th highest)
> Working-age population chg. 2010-2020: +3.7% (23rd highest)
Oregon reported nation-leading economic growth in 2014. The state’s GDP increased by 4.9% that year, nearly double the corresponding national growth. While unemployment has also fallen in Oregon, at 5.7%, it remains higher than in most states. As is generally the case, high unemployment in Oregon could be partially due to insufficient qualifications among jobseekers. According to the Annual Survey of Entrepreneurs, 29.2% of businesses in the state report trouble finding qualified labor, slightly higher than the national share.
In some respects, owning a business in Oregon is more expensive than in many other states. Commercial real estate costs and the state’s corporate tax rates are each higher than in most other states.

31. Montana
> 1-yr. real GDP change: 2.0% (18th highest)
> Avg. salary: $40,182 (4th lowest)
> Adults w/ bachelor’s degree: 30.6% (20th highest)
> Patents issued: 142 (8th lowest)
> Working-age population chg. 2010-2020: +1.8% (22nd lowest)
Although Montana spends just $10,189 per mile on its highways — the third least in the country — only 4.0% of its roads are considered to be in poor condition, much less than the 11.2% of roadways nationwide. The trucking industry lost an estimated total of $124.9 million due to congestion on Montana roads in 2016. At $14,742 lost per mile, the fifth least of any state, Montana roads are some of the most trucking-friendly in the country. The state is also friendly to commuters. The average worker in Montana has an 18 minute commute, the third shortest of any state.
While solid infrastructure may benefit business climate in the state, lack of innovation may be a hindrance. There were just two venture capital deals made in the state in 2014, each worth considerably less than the average across the nation. Further, just 14 patents were awarded per 100,000 residents, roughly one-third the national average.
[in-text-ad]

32. Alaska
> 1-yr. real GDP change: -0.6% (2nd lowest)
> Avg. salary: $57,740 (7th highest)
> Adults w/ bachelor’s degree: 29.7% (24th highest)
> Patents issued: 40 (the lowest)
> Working-age population chg. 2010-2020: +5.6% (18th highest)
Business owners and operators pay more for basic needs in Alaska than in many other states. Only five states have higher commercial real estate costs than Alaska, and for the average business, electricity costs 18 cents per kilowatt-hour, more than in all but two other states. With the ongoing decline in the price of oil, the high cost of electricity could be the least of Alaska’s problems. The drop in oil prices has created a multi-billion dollar budget deficit for the Alaskan government, which collects 90% of its revenue through the state’s oil industry. The oil-dependent state is one of only three to report economic contraction in 2014.
With its traditionally profitable oil sector, Alaska has had one of the most business-friendly tax policies. In fact, the state levies no sales tax and every Alaskan has for decades been entitled to an annual state pay-out from the government. With the decline in oil prices these policies will soon no longer be sustainable, according to state officials.
[recirclink id=376338]

33. New York
> 1-yr. real GDP change: 0.9% (11th lowest)
> Avg. salary: $66,774 (the highest)
> Adults w/ bachelor’s degree: 35.0% (9th highest)
> Patents issued: 8,464 (3rd highest)
> Working-age population chg. 2010-2020: -1.4% (9th lowest)
More than 40% of the New York state population lives in New York City. This dense clustering of population and businesses attracts a number of highly skilled professionals and facilitates the sharing of technologies and ideas. New York City’s business environment may explain why the state as a whole has one of the most entrepreneurial climates in the country. There were 462 venture capital deals in New York state in 2014, the second most of any state in the country.
However, high cost of living and high business expenses likely hinder commercial activity in the state. State and local taxes amount to 12.7% of income per capita in New York, the largest tax burden nationwide. Goods and services cost 16 cents more on the dollar in New York than they do on average across the country, a higher markup than in any state other than Hawaii. Commercial real estate in New York is also far more expensive than in most states.

34. Missouri
> 1-yr. real GDP change: 1.7% (25th lowest)
> Avg. salary: $46,582 (21st lowest)
> Adults w/ bachelor’s degree: 27.8% (20th lowest)
> Patents issued: 1,082 (24th highest)
> Working-age population chg. 2010-2020: +2.4% (25th lowest)
The number of private sector businesses in Missouri grew by 2.4% in 2014, versus the less than 1% growth reported by most states. Beyond this encouraging growth, however, there are few indications that Missouri is much better than other states for business. The number of patents awarded per capita in a state is one indication of a healthy labor force and thriving business environment. In Missouri, just 17.8 patents were awarded per 100,000 people in 2014, one of the lowest such figures and well below the average of 43.6 per 100,000 people nationwide.
Businesses operating in Missouri benefit from a very low cost of living, on the other hand. Goods and services in the state cost 11% less on average than they do across the nation.
[in-text-ad-2]
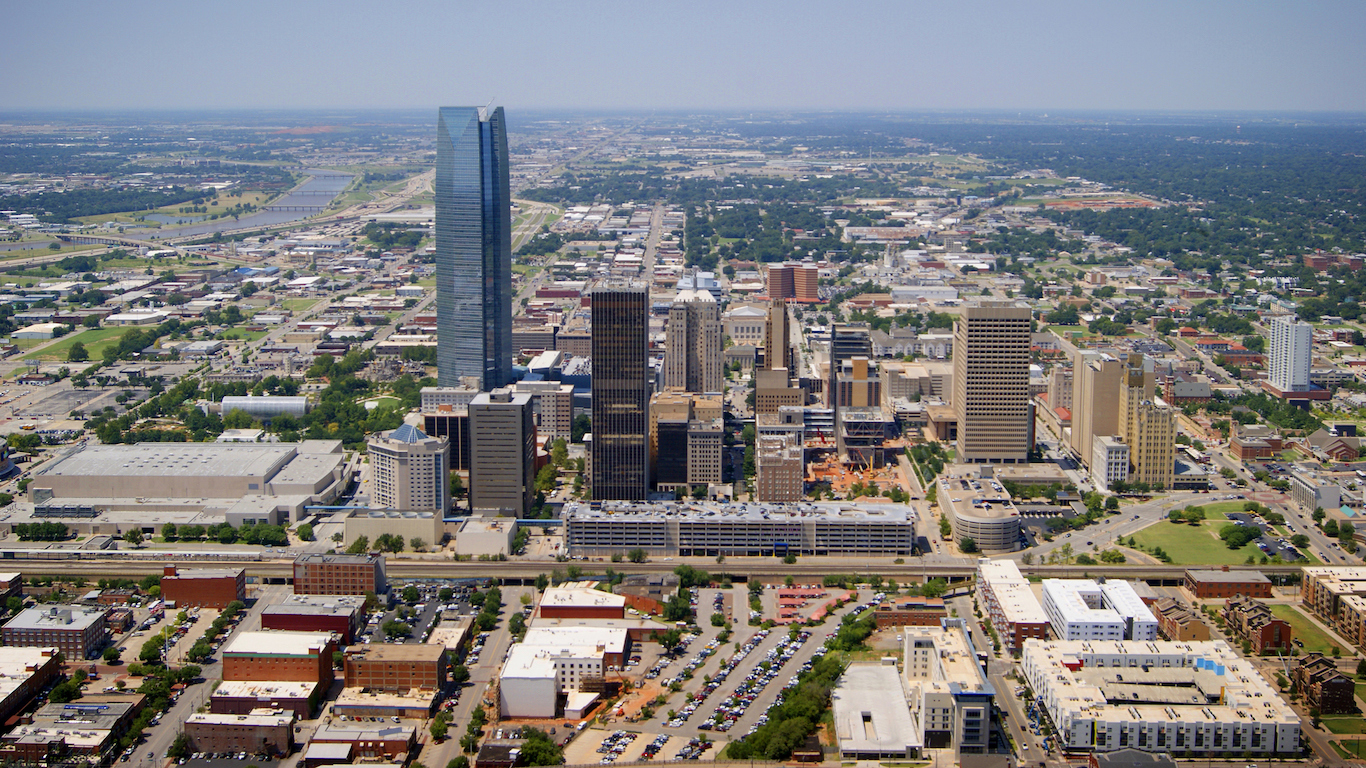
35. Oklahoma
> 1-yr. real GDP change: 2.2% (17th highest)
> Avg. salary: $45,045 (17th lowest)
> Adults w/ bachelor’s degree: 24.6% (8th lowest)
> Patents issued: 532 (18th lowest)
> Working-age population chg. 2010-2020: +5.5% (19th highest)
Businesses in Oklahoma benefit from one of the lowest corporate tax rates in the country. Additionally, as a right-to-work state, a relatively small 5.6% share of workers are unionized, which allows businesses greater control over worker wages and benefits.
Still, conditions in Oklahoma are far from ideal for business. Only 24.6% of adults in the state have at least a bachelor’s degree, and 8.1% have a graduate or professional degree, each among the smaller shares of any state. Partially as a result, businesses in Oklahoma are more likely to have problems finding qualified labor than the average business nationwide.

36. Indiana
> 1-yr. real GDP change: 1.4% (21st lowest)
> Avg. salary: $44,634 (15th lowest)
> Adults w/ bachelor’s degree: 24.9% (9th lowest)
> Patents issued: 2,033 (21st highest)
> Working-age population chg. 2010-2020: +1.3% (19th lowest)
Indiana is fairly unremarkable across most measures of business friendliness. The state’s talent pool is relatively shallow compared to the national labor force. An estimated 25% of adults in the state have at least a bachelor’s degree, and 9% have a graduate or professional degree, two of the smallest shares nationwide. On the Annual Survey of Entrepreneurs, an estimated 29.5% of businesses claimed that their inability to find qualified labor has negatively impacted their profits, one of the larger shares in the country.
Indiana’s working-age population is projected to grow by just 1.3% between 2010 and 2020, roughly one-fourth the national growth rate. In 2013, the number of private establishments in Indiana grew by just 0.2%, among the least of any state. The relatively slow population and business growth reflects weak economic growth and more generally a low level of confidence in the state’s economy.
[in-text-ad]
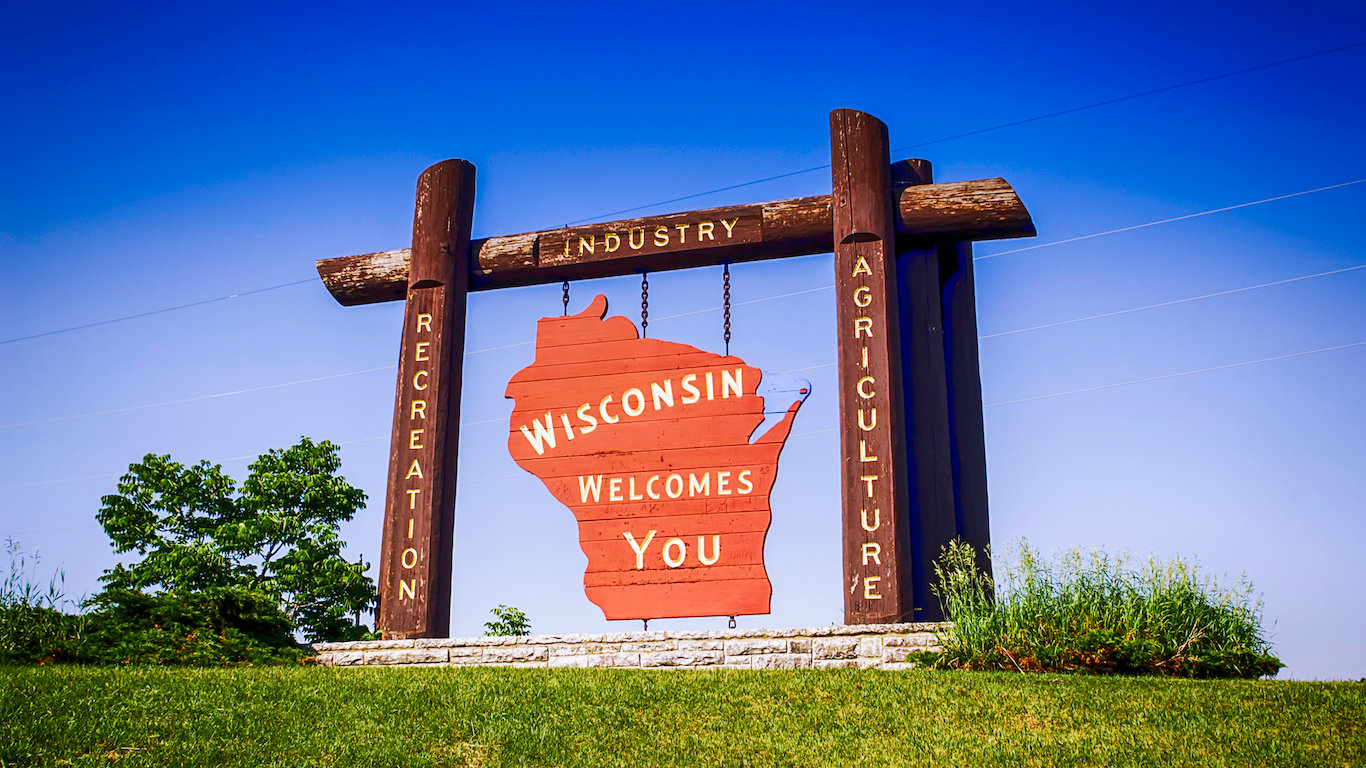
37. Wisconsin
> 1-yr. real GDP change: 1.1% (14th lowest)
> Avg. salary: $45,966 (19th lowest)
> Adults w/ bachelor’s degree: 28.4% (23rd lowest)
> Patents issued: 2,039 (20th highest)
> Working-age population chg. 2010-2020: +0.5% (16th lowest)
Starting up a business in Wisconsin appears to be less expensive than in most states. Goods and services on the whole cost about 93 cents on the dollar compared to average prices nationwide. The price of commercial real estate in the state is also among the most affordable in the country.
On the other hand, Wisconsin’s tax structure may be less favorable to both business and potential employees. In the Census Bureau’s Annual Survey of Entrepreneurs, 51.6% said their business had been negatively impacted by the state’s tax policies. High taxes for individuals may also discourage workers from moving to the state. As of fiscal 2012, the average state and local taxes paid in Wisconsin amounted to 11% of state income per capita, the fifth highest proportion in the country.
[recirclink id=377173]

38. Alabama
> 1-yr. real GDP change: 0.9% (11th lowest)
> Avg. salary: $43,622 (13th lowest)
> Adults w/ bachelor’s degree: 24.2% (7th lowest)
> Patents issued: 473 (17th lowest)
> Working-age population chg. 2010-2020: +2.6% (25th highest)
Incomes are low in Alabama, and serious financial hardship is common. The typical Alabama household earns only $44,765 a year, about $11,000 less than the typical American household. Additionally, 18.5% of state residents live in poverty, a far larger share than the 14.7% of Americans. Low incomes often translate to lower consumer spending, and 47.1% of business establishments in Alabama report struggling with slow sales, one of the highest shares in the country.
Employers in Alabama may also find it hard to fill positions in the coming years. The state’s working-age population is projected to increase by only 2.6% between 2010 and 2020, well below the corresponding 4.6% national growth.

39. Hawaii
> 1-yr. real GDP change: 2.3% (16th highest)
> Avg. salary: $48,371 (23rd highest)
> Adults w/ bachelor’s degree: 31.4% (18th highest)
> Patents issued: 127 (6th lowest)
> Working-age population chg. 2010-2020: +5.7% (17th highest)
Hawaiians routinely report a high quality of life, with near-universal health insurance coverage, top scores in national health rankings, and high incomes. The typical household earns $73,486 a year, second only to Maryland. Despite these advantages, Hawaii is not especially business friendly. The cost of living in the state is 16.8% higher than the national average, the highest of all states.
The value of exports from a state can show whether businesses are flourishing and is reflective of a state’s business climate. The total value of Hawaii’s annual exports, at just $1.3 million per capita, is the lowest of all states.
[in-text-ad-2]

40. Illinois
> 1-yr. real GDP change: 1.8% (24th highest)
> Avg. salary: $57,037 (9th highest)
> Adults w/ bachelor’s degree: 32.9% (12th highest)
> Patents issued: 5,028 (7th highest)
> Working-age population chg. 2010-2020: -0.8% (11th lowest)
Slow economic growth is indicative of a poor business climate in Illinois. Between 2010 and 2015, the state’s GDP has grown at an average of 1.3% annually, less than the 1.9% national growth rate. The state’s average five-year unemployment rate of 8.2% is the sixth highest of any state.
Additionally, Illinois is in the middle of a budget crisis that has left the state without a formal budget for 19 months as state lawmakers could not agree on one. As a result, the three major credit rating agencies downgraded Illinois’ credit score to the worst of any state. Without a state budget, businesses operate in an environment of uncertainty. An estimated 46.6% of surveyed business owners in Illinois claimed the unpredictability of conditions had a negative impact on profits, one of the largest shares of any state.

41. Arkansas
> 1-yr. real GDP change: 0.5% (6th lowest)
> Avg. salary: $41,486 (6th lowest)
> Adults w/ bachelor’s degree: 21.8% (3rd lowest)
> Patents issued: 233 (10th lowest)
> Working-age population chg. 2010-2020: +5.2% (21st highest)
Many states seek to attract companies that create high-paying science, technology, engineering and math jobs, also known as STEM professions. One of the largest obstacles to creating such jobs is a population’s low educational attainment rate. In Arkansas, just 21.8% of adults have a bachelor’s degree, compared to 30.6% of adults nationwide. Also, only 7.8% of state adults have a graduate or professional degree, the second-smallest share of any state.
STEM jobs in Arkansas account for just 3.3% of total employment, the fifth smallest share among states. Further evidence of the minimal high-tech and science development in Arkansas is the relatively few patents that are awarded in the state.
[in-text-ad]

42. Kentucky
> 1-yr. real GDP change: 1.4% (21st lowest)
> Avg. salary: $43,108 (8th lowest)
> Adults w/ bachelor’s degree: 23.3% (5th lowest)
> Patents issued: 663 (19th lowest)
> Working-age population chg. 2010-2020: +2.3% (23rd lowest)
Typically, southern U.S. states have low cost of goods and services, real estate affordability, and relatively low tax burdens. Such favorable measures certainly help make states like Kentucky more business friendly. Only four states are more affordable to live than Kentucky, which also ranks better than most states in business regulations and tax policy.
Beyond these advantages, however, Kentucky is not especially fertile grounds for business. Generally, an educated workforce helps companies flourish. In Kentucky, though, just 23.3% of adults have a bachelor’s degree, close to the lowest such percentage of all states. Educational attainment tracks closely with measures of innovation in a state, itself an indication of a favorable business environment. In Kentucky, venture capital deals, patents awarded per capita, and the share of STEM jobs are all relatively uncommon compared with other states.
[recirclink id=375655]

43. Rhode Island
> 1-yr. real GDP change: 1.4% (21st lowest)
> Avg. salary: $51,321 (16th highest)
> Adults w/ bachelor’s degree: 32.7% (13th highest)
> Patents issued: 324 (12th lowest)
> Working-age population chg. 2010-2020: -3.8% (6th lowest)
A state’s infrastructure is often critical to productivity and output. Of all miles of roadway in Rhode Island, 39.7% are in poor condition and 56.0% of bridges in the state are structurally deficient or functionally obsolete, each the largest share of any state in the country. The state also has a traffic problem. Congestion added an estimated $146.9 million to trucking costs in 2016, which after adjusting for the size of the state’s interstate system, is far more than typical.
As is the case in most states, many Rhode Island businesses also face labor problems. More than 30% of business owners surveyed in the state cited finding qualified labor as a hindrance to doing business. The problem will likely only get worse. The state’s working-age population is projected to decrease by 3.8% between 2010 and 2020, one of the largest declines of any state.

44. Ohio
> 1-yr. real GDP change: 1.8% (24th highest)
> Avg. salary: $48,007 (24th highest)
> Adults w/ bachelor’s degree: 26.8% (16th lowest)
> Patents issued: 3,590 (12th highest)
> Working-age population chg. 2010-2020: -4.1% (5th lowest)
A shrinking working-age population is a sign of a low level of confidence in a state’s economy and means businesses can count on fewer individuals in the applicant pool. The population of working-age adults nationwide is projected to grow 4.6% over the decade through 2020. In Ohio, by contrast, the working-age population is projected to shrink by 4.1% over that period. Just as a growing pool of working-age adults suggests future prosperity for businesses, a highly qualified workforce is indicative of a business-friendly environment. In Ohio, however, just 26.8% of adults have a bachelor’s degree, one of the lower shares of all states.
[in-text-ad-2]

45. New Mexico
> 1-yr. real GDP change: 1.7% (25th lowest)
> Avg. salary: $43,553 (12th lowest)
> Adults w/ bachelor’s degree: 26.5% (13th lowest)
> Patents issued: 427 (15th lowest)
> Working-age population chg. 2010-2020: +6.4% (15th highest)
A less affluent population with little disposable income can be problematic to businesses — particularly customer-facing ones. In New Mexico, over 20% of the population lives in poverty, compared to the national poverty rate of 14.7%. The typical household income is just $45,382 annually, about $10,000 less than the national median household income.
Due to the high crime rate in the state, New Mexico is potentially a less attractive place to live, which can impact businesses’ ability to attract employees. New Mexico had the third highest violent crime rate in the country in 2015, at 656 incidents per 100,000 residents, compared to the national rate of 373 incidents per 100,000 Americans.
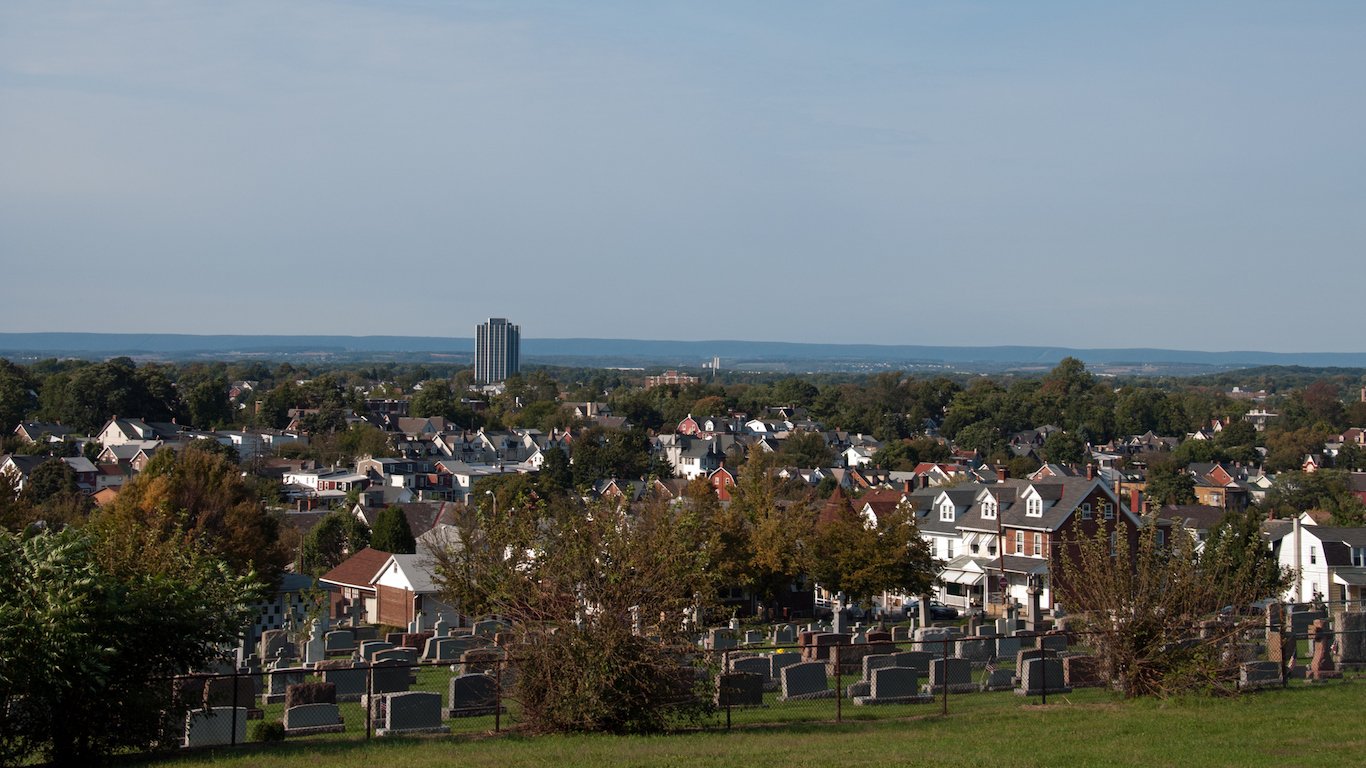
46. Pennsylvania
> 1-yr. real GDP change: 2.8% (9th highest)
> Avg. salary: $51,044 (17th highest)
> Adults w/ bachelor’s degree: 29.7% (24th highest)
> Patents issued: 3,825 (11th highest)
> Working-age population chg. 2010-2020: -0.9% (10th lowest)
One of the largest impediments to business in Pennsylvania is the state’s poor infrastructure. An estimated 40% of the state’s bridges are structurally deficient or functionally obsolete, the fourth largest share in the country. In 2016, truckers lost $2.2 trillion in operational costs to congestion on Pennsylvania roads. At $14,629 lost per interstate mile, Pennsylvania has some of the least business-friendly roads in the country.
Population loss in Pennsylvania has likely slowed economic growth in the state. In the decade between 2010 and 2020, Pennsylvania’s working-age population is projected to decline by 0.9%, while the corresponding national population is projected to grow 4.6%. In 2015, just 179 building permits were issued per 100,000 residents, less than half the national figure, another indication of sluggish commercial activity.
[in-text-ad]

47. Maine
> 1-yr. real GDP change: 1.1% (14th lowest)
> Avg. salary: $42,931 (7th lowest)
> Adults w/ bachelor’s degree: 30.1% (22nd highest)
> Patents issued: 201 (9th lowest)
> Working-age population chg. 2010-2020: -4.1% (3rd lowest)
Maine is the worst state for business in New England, and one of the worst states for business in the country. The state does not appear to foster high levels of innovation, which can be important to business development and versatility. There were only 15 patents issued for every 100,000 Maine residents in 2014, well below the national rate of 44 patents per 100,000 people.
Businesses in Maine face strain from a heavy tax burden — corporate taxes are higher in Maine than in the vast majority of states. Companies in the state may also experience a labor shortage in the coming years. The state’s working-age population is on pace to decline by 4.1% between 2010 and 2020, nearly the largest projected drop of any state.
[recirclink id=377173]

48. West Virginia
> 1-yr. real GDP change: 1.4% (21st lowest)
> Avg. salary: $41,172 (5th lowest)
> Adults w/ bachelor’s degree: 19.6% (the lowest)
> Patents issued: 127 (6th lowest)
> Working-age population chg. 2010-2020: -4.1% (4th lowest)
In West Virginia, population loss and outbound migration have led to slowed economic growth. In the decade between 2010 and 2020, the state’s working-age population is projected to decline by 4.1%, while nationwide the comparable population is projected to grow by 4.6%. More businesses closed than opened in West Virginia in 2013, with the total number falling by 0.6% — the largest decline of any state.
West Virginia has one of the least active entrepreneurial environments nationwide. There was just one venture capital deal in 2014, and just seven patents were issued per 100,000 residents, compared to 44 per 100,000 Americans nationwide. Also, just 3.3% of workers are employed in STEM jobs in the state, the fourth smallest share in the country.

49. Mississippi
> 1-yr. real GDP change: 0.5% (6th lowest)
> Avg. salary: $38,603 (the lowest)
> Adults w/ bachelor’s degree: 20.8% (2nd lowest)
> Patents issued: 138 (7th lowest)
> Working-age population chg. 2010-2020: -0.6% (13th lowest)
While Mississippi has a relatively low cost of living and cheap business startup expenses, the state’s stagnant economy is likely a drag on commercial activity statewide. Mississippi’s GDP is unchanged from five years ago, and the state’s 22% poverty rate is the highest in the country. An estimated 6.5% of Mississippi’s workforce is unemployed, significantly higher than the national 5.3% unemployment rate.
Mississippi’s talent pool is relatively shallow in comparison to the rest of the country. Just 20.8% of adults have a bachelor’s degree, and just 7.9% have a graduate or professional degree — two of the smallest such shares of any state. Many of the most advanced, high-paying jobs require higher education. Mississippi’s low educational attainment is likely one reason for the 2.8% of workers employed in STEM fields, the lowest share nationwide.
[in-text-ad-2]

50. Louisiana
> 1-yr. real GDP change: 1.0% (12th lowest)
> Avg. salary: $46,784 (22nd lowest)
> Adults w/ bachelor’s degree: 23.2% (4th lowest)
> Patents issued: 399 (14th lowest)
> Working-age population chg. 2010-2020: -3.2% (7th lowest)
No state is worse for business than Louisiana. Working-age Louisianans are less likely than the vast majority of state residents to have the qualifications many businesses look for in job applicants — just 23.2% of adults in the state have a bachelor’s degree, nearly the lowest percentage of all states. The presence of science, technology, engineering, and mathematics-related occupations usually reflects a business-friendly environment where companies can grow. In Louisiana, just 3.2% of occupations are STEM jobs, the third lowest share of all states. Unlike most states, Louisiana’s working-age population is also shrinking.
According to Louisiana’s department of economic development, 80% of the nation’s offshore oil rigs are in waters off the Louisiana coast. This suggests that while Louisiana is not especially business friendly, some types of businesses do better in the state than others.
To determine the best and worst states for business, 24/7 Wall St. compiled 47 measures into eight categories: economic conditions, business costs, state infrastructure, the availability and skill level of the workforce, quality of life, regulations, technology and innovation, and cost of living. Each category aimed to capture the essential elements that businesses consider when deciding where to locate.
Each category consists of several measures. We created an index for each category using a geometric mean. We then used the geometric mean of each index score to calculate the overall scores.
Two categories — labor and human capital and technology and innovation — received double weight, and quality of life and cost of living were given half weights. Cost of business, infrastructure, economy, and regulation received full weight.
The business costs index contains business expenses that can vary between states. A state’s ranking in the Tax Foundation’s 2017 Tax Climate Index was included to capture the impact of state-level taxes on business. We also looked at 2015 commercial prices of electricity from the Energy Information Administration (EIA) and the 2014 costs of purchasing and renting industrial, office, and retail space per square foot from CoStar Group Inc. From the Bureau of Economic Analysis (BEA), we included average compensation per job in 2015 computed as a percentage of average wages and salaries, as well as average wages and salaries in each state.
The cost of living index encapsulates costs to both households and businesses. We included a housing affordability ratio, calculated using median annual homeownership costs as a percentage of median household income. Both measures are from the U.S. Census Bureau’s 2015 American Community Survey (ACS). Also included was regional price parity, a measure of the cost of living, for 2014 from the BEA, and the average state and local tax burden as a percent of per capita income from the Tax Foundation. Tax Foundation figures are for the 2012 fiscal year.
Economy is the broadest category and was designed to measure each state’s productivity, growth potential and labor market. We included both one- and five-year growth rates in real GDP from the BEA, as well as annual and average five-year unemployment rates from the Bureau of Labor Statistics (BLS). We also included data on the number of population-adjusted building permits issued in 2015 from the Department of Housing and Urban Development.
Because many businesses benefit from higher consumer spending, the economy index includes state poverty rates and the individual earnings gap between men and women, both from the 2015 ACS. We added the value of goods shipped from each state in 2015, as well as the growth of non-government establishments between 2013 and 2014 from the County Business Patterns (CBP). Both datasets are produced by the Census. Population density per square land mile from the Census. Finally, we created a composite rank of each state’s credit ratings from Standard & Poor’s and Moody’s Investor Service.
The infrastructure index captures the importance of transportation to businesses and employees. From the Federal Highway Administration (FHWA) we looked at the percentage of bridges deemed structurally deficient or functionally obsolete as of the end of 2015. Also from the FHWA, we used the percentage of rural and urban interstate miles in poor condition. Poor was defined as interstate roads with an International Roughness Index score greater than 170. We also considered FHWA data on state investments per road mile in 2014. From the Federal Aviation Administration, we looked at the number of public use airports in each state, as well as estimated costs to commercial trucking due to traffic congestion in 2016 from the American Transportation Research Institute. Lastly, we used workers’ average commute time in each state from the 2015 ACS.
The labor and human capital index offers a look at the quality of a state’s labor force. We included data on high school, bachelor’s, and graduate educational attainment rates from the 2015 ACS. We also looked at per-pupil education expenditures in each state for 2014 from Education Week. Finally, we incorporated our own population projections from 2010 through 2020, using both the growth in total population as well as the projected growth in the working-age population. Population projections were calculated using the cohort component method and used population data from the ACS and birth and survival rates from the Centers for Disease Control and Prevention.
The quality of life index was constructed to offer insight into why employees may decide to reside in particular areas. We included each state’s 2015 violent crime rate from the FBI, and the percentage of people without health insurance in 2015 from the ACS. We also used the United Health Foundation’s 2015 State Health ranking. From the Department of Education, we incorporated the total number of post-secondary schools in each state. We also looked at the number of art, entertainment, and recreation establishments per 100,000 state residents in 2014 from the CBP.
The regulation index includes each state’s status as a right-to-work state, as well as the share of non-agricultural workers who were union members as of 2014 from UnionStats. Additionally, the index includes parts of the Mercatus Center’s 2016 Regulatory Freedom Index, and the Institute for Legal Reform’s 2015 Lawsuit Climate Index, an indication of how fair and reasonable a state’s legal system is perceived to be by businesses.
The technology and innovation index includes data on the average venture capital investment in businesses in each state, as well as the frequency of venture capital deals. Both metrics are from the National Venture Capital Association and are for 2014. From the U.S. Patent and Trade Office, we included the number of patents issued to state residents in 2014. We used the Milken Institute’s 2016 State Technology and Science Index and the number of science, technology, engineering, and mathematics (STEM) jobs as a share of all jobs calculated from BLS occupation data.
Additionally, we considered the 2014 results of the U.S. Census Bureau’s American Survey of Entrepreneurs. The ASE is annual survey of business owners, who reported on the ease of doing business in their state based on measures such as tax policy, business conditions, access to qualified labor, and other regional factors.
Contact [email protected] for any questions or corrections.