
Marriage is intended to be a lifelong commitment to another person, but the reality is many marriages end in divorce. According to the Census Bureau, 9.7% of males over 15 years old and 8.8% of females over 15 years old are divorced.
Myriad issues — including work stress, money troubles, and even personal changes over time — can lead to divorce. In an email to 24/7 Wall St., clinically trained New York City social worker and matrimonial attorney Debra Lynn Mechanick identified two factors that greatly contribute to divorce: finances and children. “When couples argue about finances or children, what they are really expressing is a fundamental shift in ideology by one or both spouses that strays from the common vision they once held together,” wrote Mechanick.
Anger and fear can diminish effective communication in a marriage, explained Mechanick. As a result, the couple develops problems that, over time, build up until they believe their issues are unsolvable. “At that point, the spouses believe that only the judicial system can help them reach a solution that is fair and equitable,” said Mechanick.
Divorce is a sad reality in every state in the country, but in some states divorce rates are higher than in others. There does not seem to be a regional component between the states with the highest and lowest divorce rates. However, median household income and the unemployment rate seem to affect the rate of divorce.
To identify the states with the highest rate of divorce, 24/7 Wall St. reviewed Census Bureau data on the number of people who divorced in 2016 and the number of married individuals in 2015. The divorce rate is defined as the number of people who divorced per every 1,000 married individuals.
Click here to see which states have the highest rates of divorce.
Click here to see which states have the lowest rates of divorce.
Click to read our detailed findings and methodology.
States with the Highest Rates of Divorce

10. Tennessee
> Divorce rate: 19.1 per 1,000 married people
> Marriage rate: 16.5 per 1,000 people (8th highest)
> Unemployment rate: 4.8% (25th highest)
> Avg. wedding cost: $21,173 (6th lowest)
Country music often deals with relationships that went south. So it’s no surprise that the home state of Nashville, country music’s capital city, has a lot of splits. Some 19.1 individuals per every 1,000 married people in Tennessee divorced, the 10th-highest divorce rate of all states. No doubt, a common reason for divorce is financial issues. Perhaps the high divorce rate in Tennessee is attributable to financial stressors, although — realistically — it’s hard to pinpoint just one cause. Financial stressors, for example, can limit a couple’s ability to go on dates, such as nice dinners or even a trip to the movie theater, which can cause add tension in a relationship. The state’s poverty rate of 15.8% is nearly 2 percentage points higher than the national rate of 14.0%.
[in-text-ad]

9. West Virginia
> # of divorces per 1,000 in past year: 19.2 per 1,000 married people
> Marriage rate: 11.4 per 1,000 people (3rd lowest)
> Unemployment rate: 6.0% (4th highest)
> Avg. wedding cost: $19,367 (2nd lowest)
West Virginia has the ninth-highest divorce rate in the country as 19.2 married individuals out of every 1,000 split in 2016. That’s three people ahead of the national figure of 16.2 per every 1,000 married people divorcing that year.
Financial stressors can play a major role in relationship troubles, and West Virginians are more likely to struggle with such issues than residents in most states. The median household income in the state of $43,385 a year is the second lowest in the country. On the plus side, West Virginia’s average wedding price is the second lowest of all states.
[recirclink id=416973]

8. Montana
> Divorce rate: 19.4 per 1,000 married people
> Marriage rate: 14.8 per 1,000 people (23rd highest)
> Unemployment rate: 4.1% (17th lowest)
> Avg. wedding cost: $22,098 (7th lowest)
Montana, a state amid rocky terrain and stunning bodies of water, has one of the highest rates of divorce of all states. The statewide median household income of $50,027 a year is more than $7,500 less than the nationwide median of $57,617. The jobless rate was actually lower than the 2016 national rate of 4.9%, with 4.1% of the workforce in Montana unemployed.
The number of married individuals in Montana is far lower than in most other states, with only 437,550 married people, the eighth-lowest figure nationwide.

7. Wyoming
> Divorce rate: 19.5 per 1,000 married people
> Marriage rate: 18.4 per 1,000 people (4th highest)
> Unemployment rate: 5.3% (13th highest)
> Avg. wedding cost: $26,679 (23rd highest)
As the least populous state, Wyoming also has the smallest married population. Of the nearly 600,000 state residents, under 255,000 people were married in 2015. But the state’s divorce rate came in higher than most, with 19.5 married people per 1,000 divorcing in 2016.
Wyoming residents are more likely to have gotten married at some point than almost any other state. It has the lowest percentage of males over 15 years old who have never been married at 30.2%, and the third-lowest percentage of females over 15 years old who have never married at 24.7%.
[in-text-ad-2]
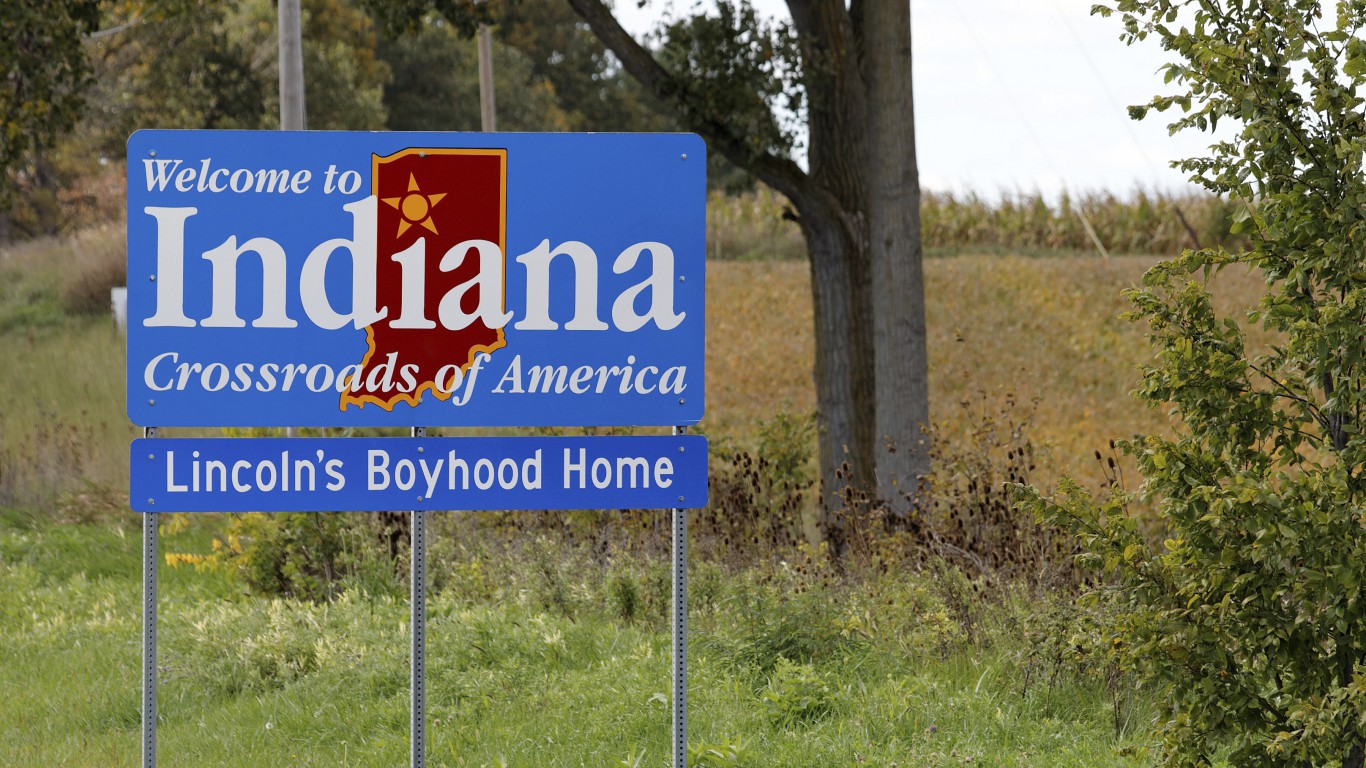
6. Indiana
> Divorce rate: 19.6 per 1,000 married people
> Marriage rate: 16.0 per 1,000 people (11th highest)
> Unemployment rate: 4.4% (21st lowest)
> Avg. wedding cost: $23,912 (16th lowest)
Indiana, home to the century-old Indianapolis 500, has the sixth-highest rate of divorce, with 19.6 per every 1,000 married individuals divorcing in 2016. On the bright side, nearly 40% of Indiana’s population is married, with more than 2.6 million people in a marriage. The median household income of $52,314 a year is more than $5,000 less than the nationwide median income of $57,617, and the unemployment rate of 4.4% was 0.5 percentage points below the 2016 national rate of 4.9%. As is the case in other high divorce states these figures suggest financial stress is a factor for divorce in Indiana.

5. Oklahoma
> Divorce rate: 20.4 per 1,000 married people
> Marriage rate: 16.3 per 1,000 people (9th highest)
> Unemployment rate: 4.9% (20th highest)
> Avg. wedding cost: $22,105 (8th lowest)
Oklahoma came in as the state with the fifth highest divorce rate as 20.4 individuals per 1,000 married people got divorced in the past year. However, it wasn’t just last year that the state had a relatively high rate of divorces.
Some 12.1% of Oklahoma males 15 years and over and 14.4% of Oklahoma females 15 years and over are divorced — the eighth- and seventh-highest shares of men and women who are divorced, respectively.
[in-text-ad]
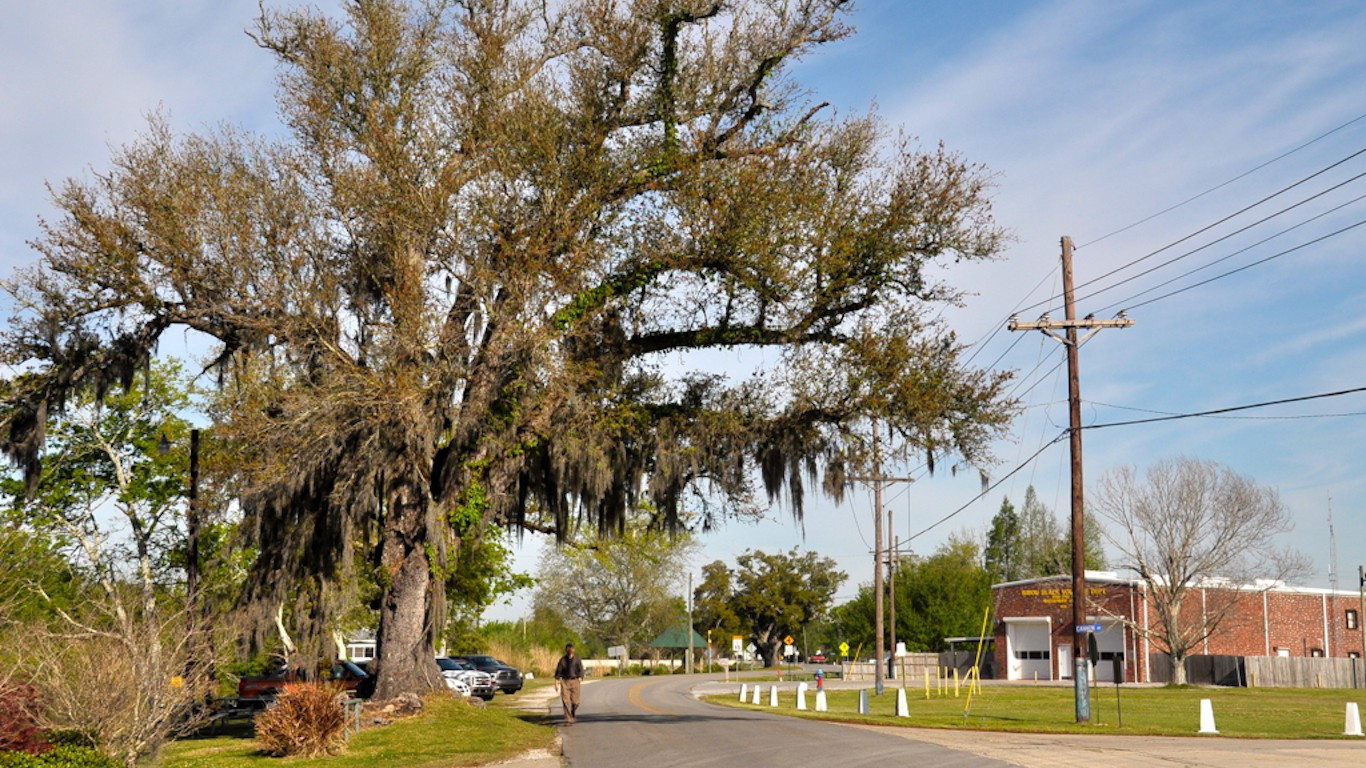
4. Louisiana
> Divorce rate: 20.8 per 1,000 married people
> Marriage rate: 11.9 per 1,000 people (7th lowest)
> Unemployment rate: 6.1% (3rd highest)
> Avg. wedding cost: $22,701 (10th lowest)
The state that includes New Orleans, the nation’s hub for everything jazz, has the fourth-highest divorce rate of any state. Financial stress can be a factor in the deterioration of a marriage, and Louisiana has both a low median household income and a high unemployment rate compared with national figures. It’s no wonder why New Orleans is famous for playing those soulful blues.
The statewide median household income of $45,146 a year is more than $10,000 below the national median income of $57,617– yikes, that’s quite a bit! The unemployment rate was an astonishing 6.1%, the third highest of all the states and higher than the 2016 nationwide rate of 4.9%. Not to mention, the poverty rate is a staggering 20.2%, well above the national rate of 14.0% and the second highest among all the states.
[recirclink id=406269]

3. Nevada
> Divorce rate: 21.3 per 1,000 married people
> Marriage rate: 15.3 per 1,000 people (17th highest)
> Unemployment rate: 5.7% (8th highest)
> Avg. wedding cost: $28,672 (18th highest)
Getting married on a whim after a wild night in Las Vegas is a common theme in movies and TV shows. But it’s not fiction that married people in Nevada have a hard time staying together.
The state had one of the highest divorce rates of all the states last year. And divorces have been pervasive in previous years, too. Nevada has the second-highest rate of both males and females over 15 years old who are divorced.

2. Idaho
> Divorce rate: 21.9 per 1,000 married people
> Marriage rate: 15.8 per 1,000 people (13th highest)
> Unemployment rate: 3.8% (11th lowest)
> Avg. wedding cost: $22,905 (11th lowest)
Idaho, a state with significantly low population density, has the second-highest divorce rate of any state. Interestingly enough, Idaho has the one of the nation’s highest marriage rates. It’s possible that marrying too young drives the divorce rate up, simply because kids are getting hitched without truly knowing their soon-to-be-spouse.
So just how high is the divorce rate? Nearly 22 per every 1,000 married individuals got a divorce in 2016. The statewide unemployment rate of 3.8% at that time was 1.1 percentage points below the nationwide rate of 4.9%, and the median household income of $51,807 a year is quite below the national median income of $57,617. A lower annual salary may be indicative of financial struggles, which can certainly add stress to a relationship.
[in-text-ad-2]

1. Arkansas
> Divorce rate: 23.4 per 1,000 married people
> Marriage rate: 17.3 per 1,000 people (5th highest)
> Unemployment rate: 4.0% (15th lowest)
> Avg. wedding cost: $20,041 (3rd lowest)
Keeping a marriage together is hard work, and in 2016 married people in Arkansas struggled the most to stay married. Some 23.4 out of every 1,000 married individuals divorced last year.
It could be that divorces are relatively common in Arkansas because of the relatively high rate of people who get married there in the first place. The state has the third-lowest percentage of men who have never been married at 31.4%. Similarly, one-quarter of Arkansas women over 15 years old have never been married, the fourth-lowest share in the country.
States with the Lowest Rates of Divorce

10. Iowa
> Divorce rate: 14.1 per 1,000 married people
> Marriage rate: 12.9 per 1,000 people (11th lowest)
> Unemployment rate: 3.7% (10th lowest)
> Avg. wedding cost: $24,182 (18th lowest)
Iowa has the 10th-lowest divorce rate, with only 14.1 per every 1,000 married individuals divorcing in the past year. The state’s unemployment rate is quite low at 3.7%, considering the 2016 nationwide rate is 4.9%. The median household income is smack dab in the middle, the 25th lowest of all the states at $56,247 a year, just a little over $1,000 below the nationwide median of $57,617, so financial stress is no more or less than other states.
[in-text-ad]
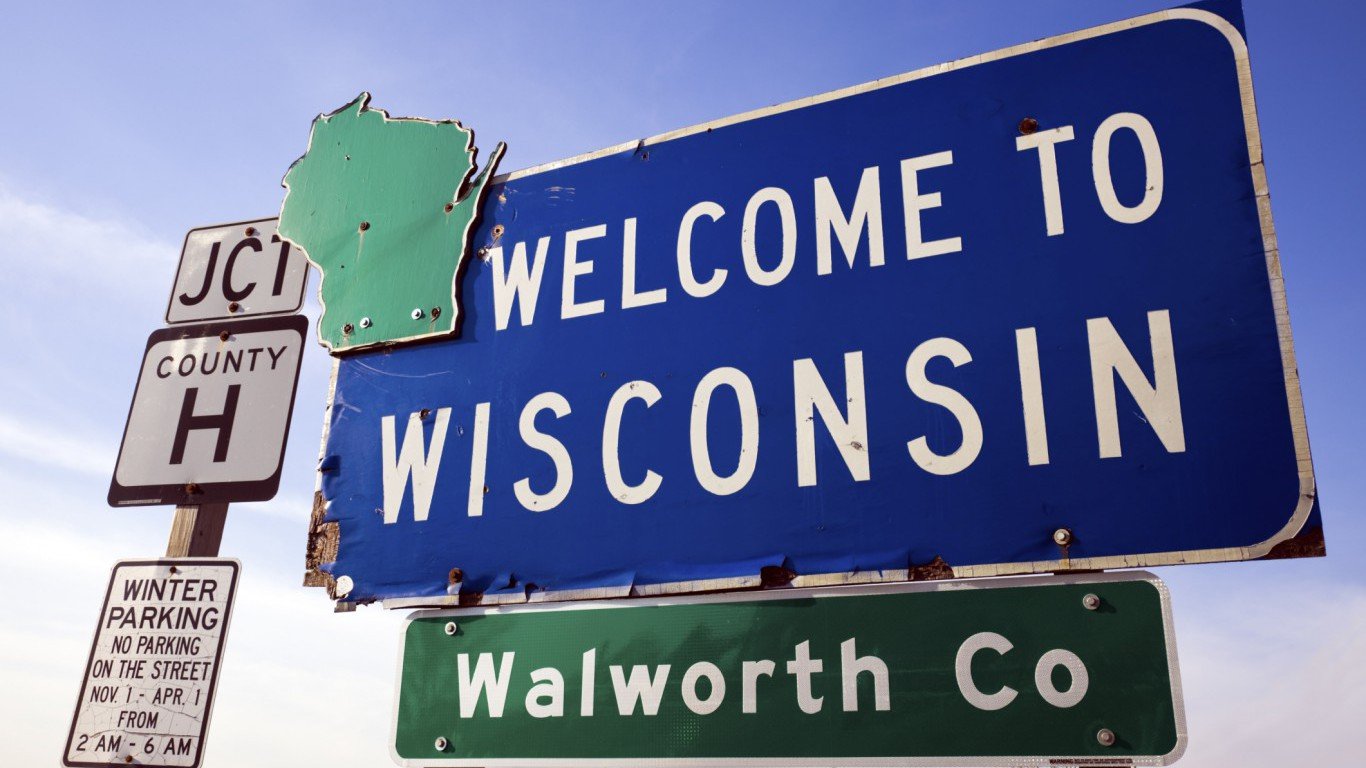
9. Wisconsin
> Divorce rate: 14.0 per 1,000 married people
> Marriage rate: 13.4 per 1,000 people (19th lowest)
> Unemployment rate: 4.1% (17th lowest)
> Avg. wedding cost: $26,462 (25th highest)
Wisconsin has one of the lowest divorce rates in the nation, with 14.0 married individuals out of 1,000 getting a divorce in 2016. Separation often precedes a divorce. Often, married couples who are having problems decide to spend some time apart before opting for a divorce. And there’s good reason to suspect the state will stay on the low end of divorce figures. Wisconsin has the lowest percentage of males 15 and older who are separated, at just 0.9% of that population. It also has the second lowest percentage of females 15 and older who are separated at 1.0%.
[recirclink id=406371]

8. Illinois
> Divorce rate: 13.9 per 1,000 married people
> Marriage rate: 13.0 per 1,000 people (12th lowest)
> Unemployment rate: 5.9% (6th highest)
> Avg. wedding cost: $28,413 (19th highest)
Like most states, Illinois has plenty of married couples, with 5.1 million married people of the state’s population of 12.8 million. Contrary to the other states with the lowest divorce rates, the state’s 2016 unemployment rate of 5.9% surpassed the nationwide rate by a full percentage point. This disparity doesn’t seem to wreak any havoc on people’s marriages in Illinois. The median household income of $60,960 actually rises above the nationwide figure of $57,617. The state has the eighth-lowest rate of divorces with only 13.9 people divorcing in the past year for every 1,000 married individuals.

7. Vermont
> Divorce rate: 13.3 per 1,000 married people
> Marriage rate: 11.1 per 1,000 people (the lowest)
> Unemployment rate: 3.3% (7th lowest)
> Avg. wedding cost: $32,120 (11th highest)
Vermont had the fewest total of people who got a divorce of any state in 2016. Only 3,504 married people in Vermont split last year. That’s largely because of the state’s low population. Vermont had fewer than 265,000 married individuals in 2016, the second-lowest of all 50 states.
Though Vermont had a low divorce rate in 2016, it has a high percentage of residents who are already divorced. Some 14.7% of females over 15 years old in Vermont are divorced, the fourth-highest share in the U.S.
[in-text-ad-2]

6. South Dakota
> Divorce rate: 12.9 per 1,000 married people
> Marriage rate: 15.0 per 1,000 people (21st highest)
> Unemployment rate: 2.8% (2nd lowest)
> Avg. wedding cost: $23,047 (12th lowest)
South Dakota’s state slogan is “Great Faces, Great Places” because of Mount Rushmore. But maybe it should add “great marriages” as well. The divorce rate is quite low, with only 12.9 per every 1,000 married individuals divorcing in the past year. The jobless rate in South Dakota is 2.8%, the second lowest in the nation, so a percolating economy means less financial stress for residents.
More than half of males and females over 15 in South Dakota are married and not separated, one of very few states where that’s the case.

5. Minnesota
> Divorce rate: 12.8 per 1,000 married people
> Marriage rate: 13.9 per 1,000 people (23rd lowest)
> Unemployment rate: 3.9% (13th lowest)
> Avg. wedding cost: $28,778 (17th highest)
Minnesota may be one of the colder states, but luckily the state’s residents probably have a spouse to keep them warm at night. The land of 10,000 lakes is one of the few states in which most of its adult residents are married.
In Minnesota, 51.7% of males 15 years old and over and 50.9% of females 15 years and over are married and not separated — both the seventh-highest shares in the country.
[in-text-ad]

4. New York
> Divorce rate: 12.8 per 1,000 married people
> Marriage rate: 12.5 per 1,000 people (10th lowest)
> Unemployment rate: 4.8% (25th highest)
> Avg. wedding cost: $36,978 (5th highest)
New York, home to the nation’s most diverse city, has a statewide population of 19.8 million people. The state also has the fourth-lowest divorce rate. Perhaps the state’s median household income of $62,909 a year — well above the national median of $57,617 — plays an integral role in feeling stable in a marriage. Only 12.8 people per every 1,000 married residents in New York have gotten a divorce in the past year.
The state also has a significantly high number of married people of about 7.58 million people — that’s over one-third of the population in a marriage.
[recirclink id=414821]

3. New Jersey
> Divorce rate: 12.7 per 1,000 married people
> Marriage rate: 11.6 per 1,000 people (4th lowest)
> Unemployment rate: 5.0% (18th highest)
> Avg. wedding cost: $39,602 (the highest)
Marriage is a significant commitment no matter where you make it, but having a wedding in New Jersey is a bigger financial commitment than anywhere else in the country. The state has the highest average cost of a wedding and an engagement ring.
New Jersey residents have a strong track record of staying married. The state has the lowest percentage of males 15 years old and over who are divorced at just 6.9%. Females over 15 tend to stay married as well — just 10.2% are divorced, the fifth-lowest share of any state.

2. Hawaii
> Divorce rate: 12.6 per 1,000 married people
> Marriage rate: 16.9 per 1,000 people (6th highest)
> Unemployment rate: 3.0% (3rd lowest)
> Avg. wedding cost: $37,755 (4th highest)
Aloha means both ‘hello’ and ‘goodbye’ but Hawaiians don’t seem to say goodbye to their spouses too often. Hawaii has the second lowest divorce rate in the nation as 12.6 per 1,000 married people got divorced in 2016.
Financial distress doesn’t seem to be a major factor in divorce in Hawaii. The median household income of this resort-filled, non-contiguous state is $74,511 a year in 2016 — well above the nationwide figure of $57,617 and the fifth-highest of any state.
[in-text-ad-2]

1. Massachusetts
> Divorce rate: 12.3 per 1,000 married people
> Marriage rate: 13.2 1,000 people (14th lowest)
> Unemployment rate: 3.7% (10th lowest)
> Avg. wedding cost: $38,191 (3rd highest)
Married couples are more likely to stay together in Massachusetts than in any other state. Just 12.3 individuals per 1,000 married people divorced in 2016 in the state, possibly because it is a great environment for stable relationships.
Some 42.7% of the state’s adults hold a bachelor’s degree or higher, the highest percentage in the U.S. That likely contributes to the state’s high median household income of $75,297 a year. High incomes allow couples to focus on their marriage instead of money.
Detailed Findings & Methodology:
Financial burden may contribute to a failed marriage. In the states with the highest divorce rates, the median household income tends to be lower than the nationwide figure. In fact, in nine of the 10 states with the highest rates of divorce, the median household income falls below the national median of $57,617 a year. Earning a lower income can be especially unsettling in a marriage with kids who are financially dependent on their parents.
At the other end of the spectrum, in seven of the 10 states with the lowest rates of divorce, the median household income is above the national figure. In fact, the median income in three of those states is above $70,000 a year. Less stress over finances likely reduces tension in a marriage.
Unemployment may also cause frustration in a marriage. In the states with the highest rates of divorce, four of the 10 had unemployment rates that exceeded the national rate of 4.9% in 2016. Tennessee and Oklahoma are two of the states with the highest rates of divorce with jobless rates that don’t exceed the national rate, but rather, are near or equivalent to it. The unemployment rate in Tennessee is just 0.1 percentage point below the nationwide rate at 4.8% whereas Oklahoma’s rate is identical to it at 4.9%. In the states with the lowest rate of divorce, only two of the 10 have unemployment rates greater than the nationwide rate.
To identify the states with the highest rates of divorce, 24/7 Wall St. reviewed data from the Census Bureau’s American Community Survey (ACS) on the number of people who divorced in 2016 and the total number of married individuals in 2015. The divorce rate is defined as the number of people who divorced per every 1,000 married individuals. Since 2013, the ACS has included data on same sex marriages. We retrieved the median household income from the ACS and the unemployment rate from the Bureau of Labor Statistics, both for 2016. The 2016 average cost of a wedding in every state came from wedding industry research company The Wedding Report, Inc. The rank is based on the rate of divorce in each state.
The U.S. Census Bureau broke down marriage status into five categories: never married, now married except separated, separated, widowed, and divorced. The category of now married except separated consists of people who are married but excludes those who are still married but legally separated. The separated category consists of people who are still married but legally separated.
Contact [email protected] for any questions or corrections.