[cnxvideo id=”625479″ placement=”ros”]The vast majority of crimes committed in the United States are nonviolent property crimes — larceny-thefts such as shoplifting, vehicle thefts, and burglaries. There were nearly 8 million such crimes in 2016, a decline of 1.3% from the previous year and of 19.9% from a decade ago. Still, property crimes remain quite common — and costly. Property crimes cost Americans an estimated $15.6 billion in 2016.
Crime tends to cluster in hotspots, and the likelihood of witnessing or experiencing a crime can vary greatly among residents even of the same local area. Looking at the city with the highest property crime rate in every state demonstrates how property crime rates can vary within states and across the nation.
To find the city with the most property crime in every state, 24/7 Wall St. reviewed the number of property crimes reported for every 100,000 residents in U.S. cities of 20,000 people or more. For context, there are approximately 2,500 property crimes for every 100,000 Americans in a year. Property crimes range from less than 300 offenses per 100,000 people in Ridgefield, Connecticut to more than 15,000 offenses per 100,000 people in Tukwila, Washington.
John Roman is a senior fellow at NORC, a social research institution at the University of Chicago, formerly known as the National Opinion Research Center. In an interview with 24/7 Wall St., Roman explained that several conditions often come together in high property crime areas: There must be individuals motivated to commit crimes; there must be suitable targets — people who have things worth stealing; and there must be what criminologists call a lack of guardianship, basic security provisions like guards or surveillance cameras. “[P]laces that have more property crime could have any combination of those three things going against them,” he said.
Click here to see the cities with the most property crime in every state.
Click here to see our detailed findings and methodology.
1. Bessemer, Alabama
> Property crimes per 100,000 people: 9,037 (total crimes: 2,403; total pop.: 26,592)
> Total larceny-thefts: 1,621
> Total burglaries: 573
> Total vehicle thefts: 209
> Poverty rate: 30.7%
> Statewide property crimes per 100,000 people: 2,948 (13th highest)
[in-text-ad]

2. Anchorage, Alaska
> Property crimes per 100,000 people: 4,898 (total crimes: 14,649 total pop.: 299,097)
> Total larceny-thefts: 10,599
> Total burglaries: 2,008
> Total vehicle thefts: 2,042
> Poverty rate: 8.1%
> Statewide property crimes per 100,000 people: 3,353 (3rd highest)
[recirclink id=440841]

3. Tucson, Arizona
> Property crimes per 100,000 people: 5,859 (total crimes: 31,265 total pop.: 533,663)
> Total larceny-thefts: 25,185
> Total burglaries: 4,138
> Total vehicle thefts: 1,942
> Poverty rate: 25.1%
> Statewide property crimes per 100,000 people: 2,978 (10th highest)

4. Hot Springs, Arkansas
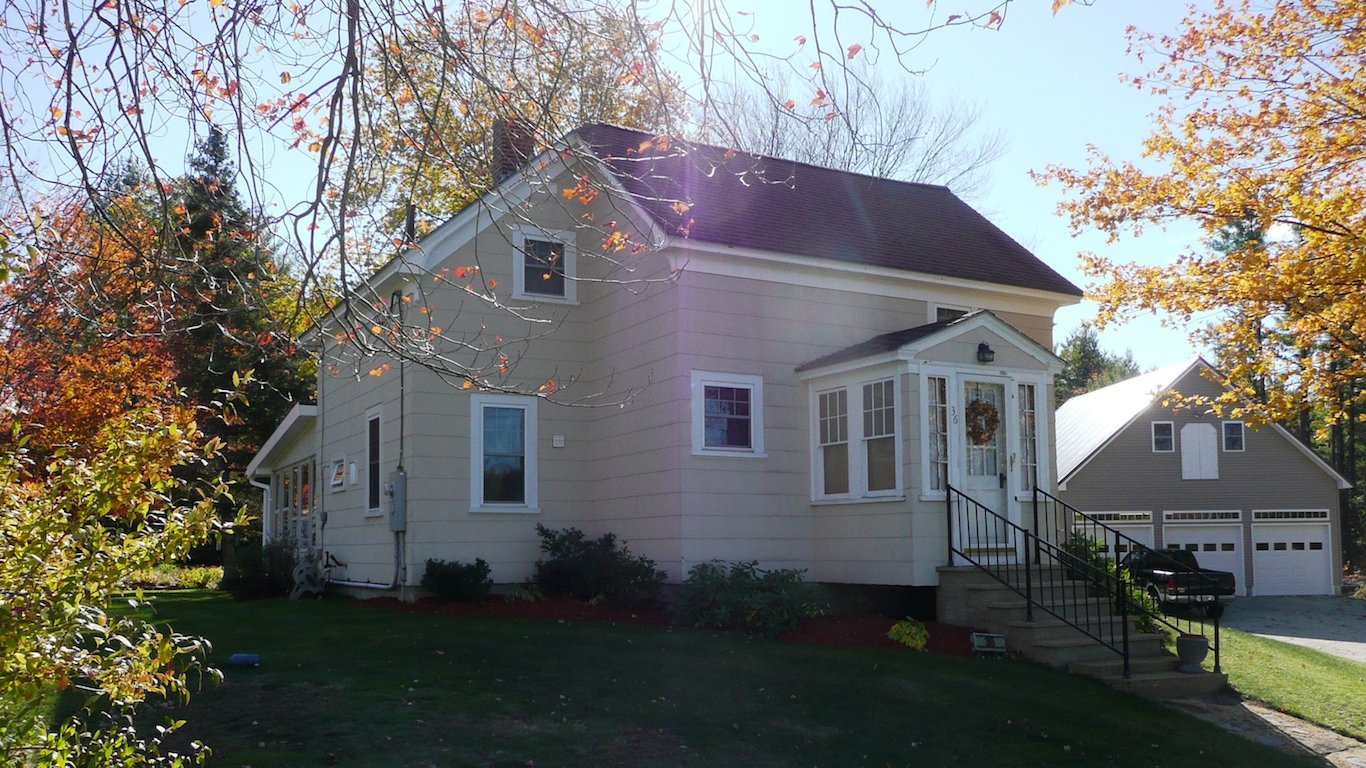
> Property crimes per 100,000 people: 8,069 (total crimes: 2,882 total pop.: 35,716)
> Total larceny-thefts: 1,586
> Total burglaries: 1,059
> Total vehicle thefts: 237
> Poverty rate: 27.9%
> Statewide property crimes per 100,000 people: 3,269 (5th highest)
[in-text-ad-2]

5. Palm Springs, California
> Property crimes per 100,000 people: 5,748 (total crimes: 2,754 total pop.: 47,909)
> Total larceny-thefts: 1,669
> Total burglaries: 746
> Total vehicle thefts: 339
> Poverty rate: 19.4%
> Statewide property crimes per 100,000 people: 2,553 (24th lowest)

6. Pueblo, Colorado
> Property crimes per 100,000 people: 6,798 (total crimes: 7,473 total pop.: 109,927)
> Total larceny-thefts: 4,505
> Total burglaries: 1,797
> Total vehicle thefts: 1,171
> Poverty rate: 25.1%
> Statewide property crimes per 100,000 people: 2,741 (19th highest)
[in-text-ad]
7. New Haven, Connecticut
> Property crimes per 100,000 people: 4,211 (total crimes: 5,492 total pop.: 130,425)
> Total larceny-thefts: 3,925
> Total burglaries: 832
> Total vehicle thefts: 735
> Poverty rate: 26.1%
> Statewide property crimes per 100,000 people: 1,808 (9th lowest)
[recirclink id=440491]

8. Dover, Delaware
> Property crimes per 100,000 people: 4,970 (total crimes: 1,880 total pop.: 37,824)
> Total larceny-thefts: 1,699
> Total burglaries: 100
> Total vehicle thefts: 81
> Poverty rate: 19.7%
> Statewide property crimes per 100,000 people: 2,766 (17th highest)

9. Miami Beach, Florida
> Property crimes per 100,000 people: 9,037 (total crimes: 8,419 total pop.: 93,165)
> Total larceny-thefts: 7,251
> Total burglaries: 603
> Total vehicle thefts: 565
> Poverty rate: 16.7%
> Statewide property crimes per 100,000 people: 2,687 (22nd highest)
[in-text-ad-2]
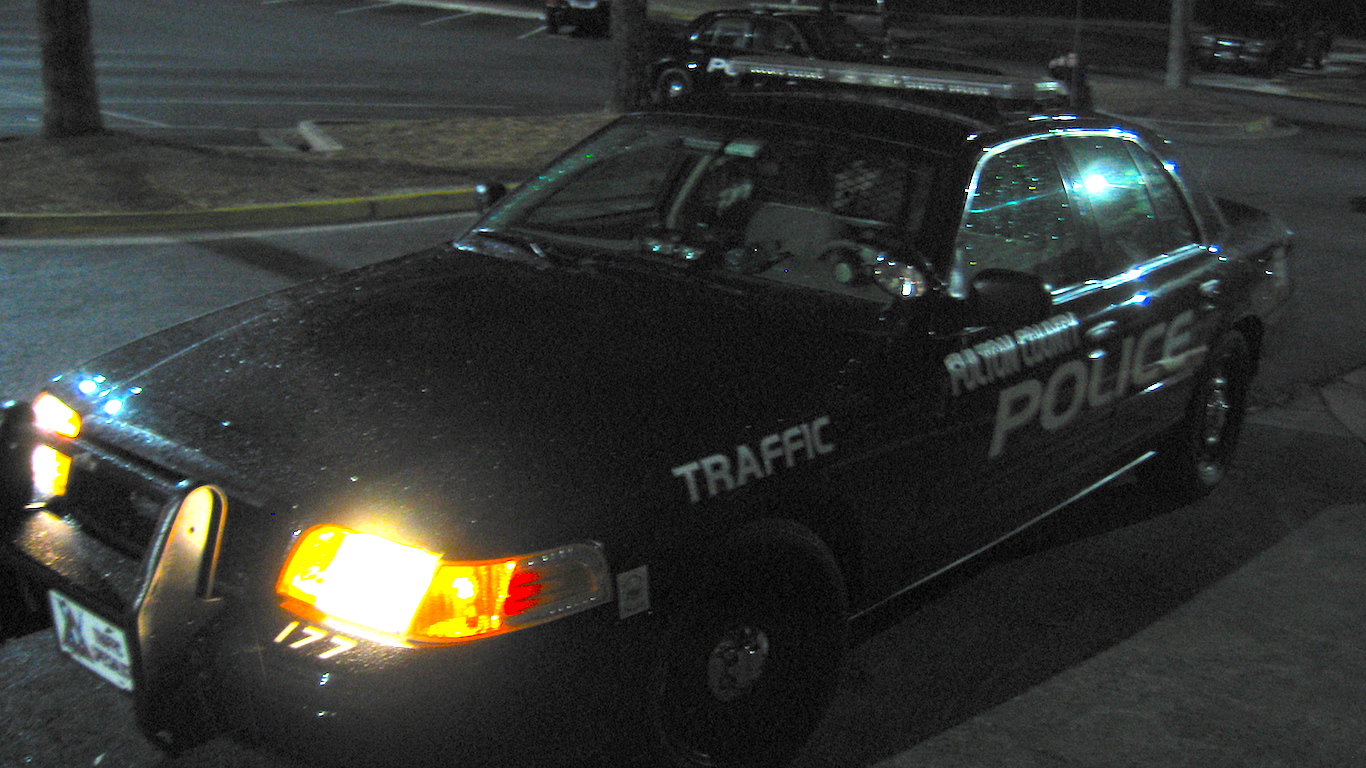
10. Union City, Georgia
> Property crimes per 100,000 people: 10,529 (total crimes: 2,218 total pop.: 21,065)
> Total larceny-thefts: 1,617
> Total burglaries: 234
> Total vehicle thefts: 367
> Poverty rate: 21.3%
> Statewide property crimes per 100,000 people: 3,004 (7th highest)

11. Honolulu, Hawaii
> Property crimes per 100,000 people: 3,073 (total crimes: 30,592 total pop.: 995,572)
> Total larceny-thefts: 22,488
> Total burglaries: 3,758
> Total vehicle thefts: 4,346
> Poverty rate: 15.1%
> Statewide property crimes per 100,000 people: 2,993 (8th highest)
[in-text-ad]

12. Lewiston, Idaho
> Property crimes per 100,000 people: 4,072 (total crimes: 1,330 total pop.: 32,665)
> Total larceny-thefts: 883
> Total burglaries: 366
> Total vehicle thefts: 81
> Poverty rate: 13.5%
> Statewide property crimes per 100,000 people: 1,744 (8th lowest)
[recirclink id=440495]
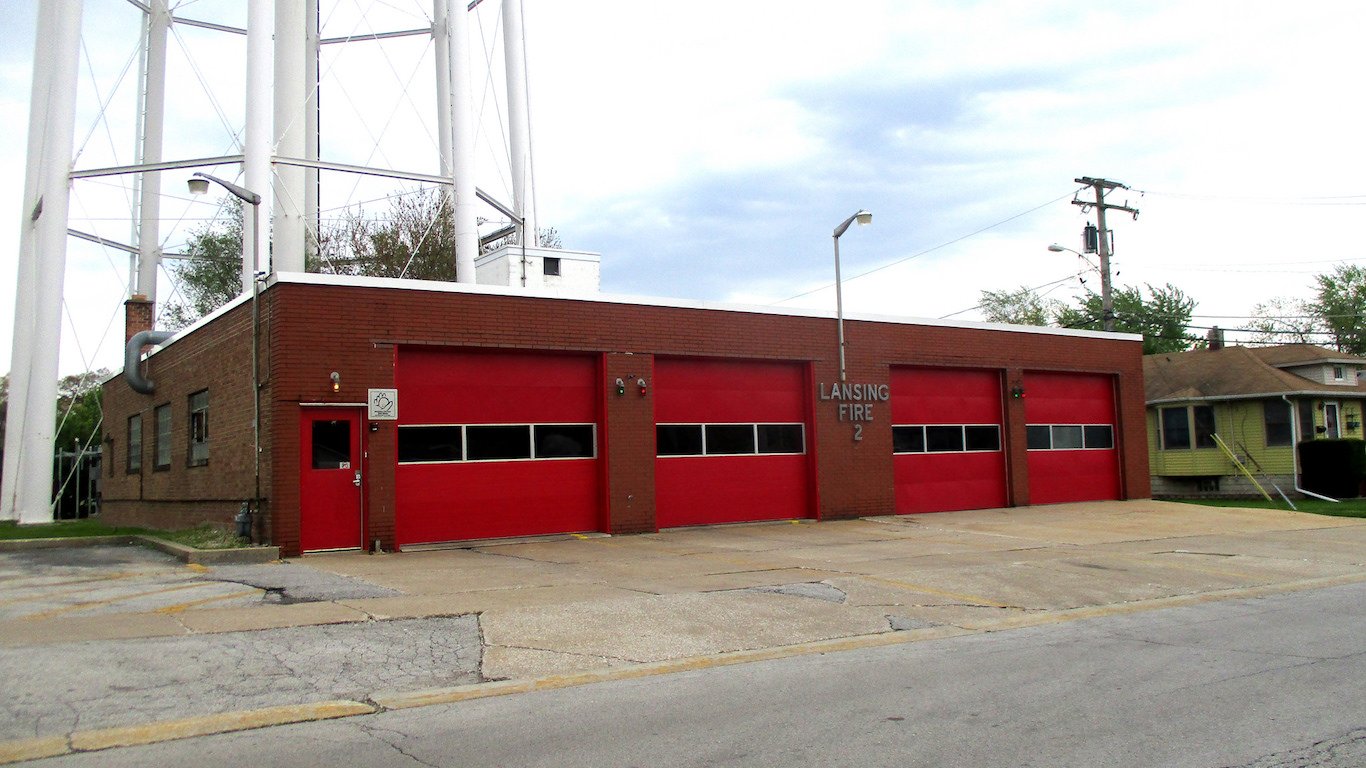
13. Lansing, Illinois
> Property crimes per 100,000 people: 6,653 (total crimes: 1,886 total pop.: 28,347)
> Total larceny-thefts: 1,527
> Total burglaries: 271
> Total vehicle thefts: 88
> Poverty rate: 15.0%
> Statewide property crimes per 100,000 people: 2,049 (17th lowest)

14. Clarksville, Indiana
> Property crimes per 100,000 people: 5,437 (total crimes: 1,190 total pop.: 21,888)
> Total larceny-thefts: 1,019
> Total burglaries: 55
> Total vehicle thefts: 116
> Poverty rate: 10.0%
> Statewide property crimes per 100,000 people: 2,589 (24th highest)
[in-text-ad-2]
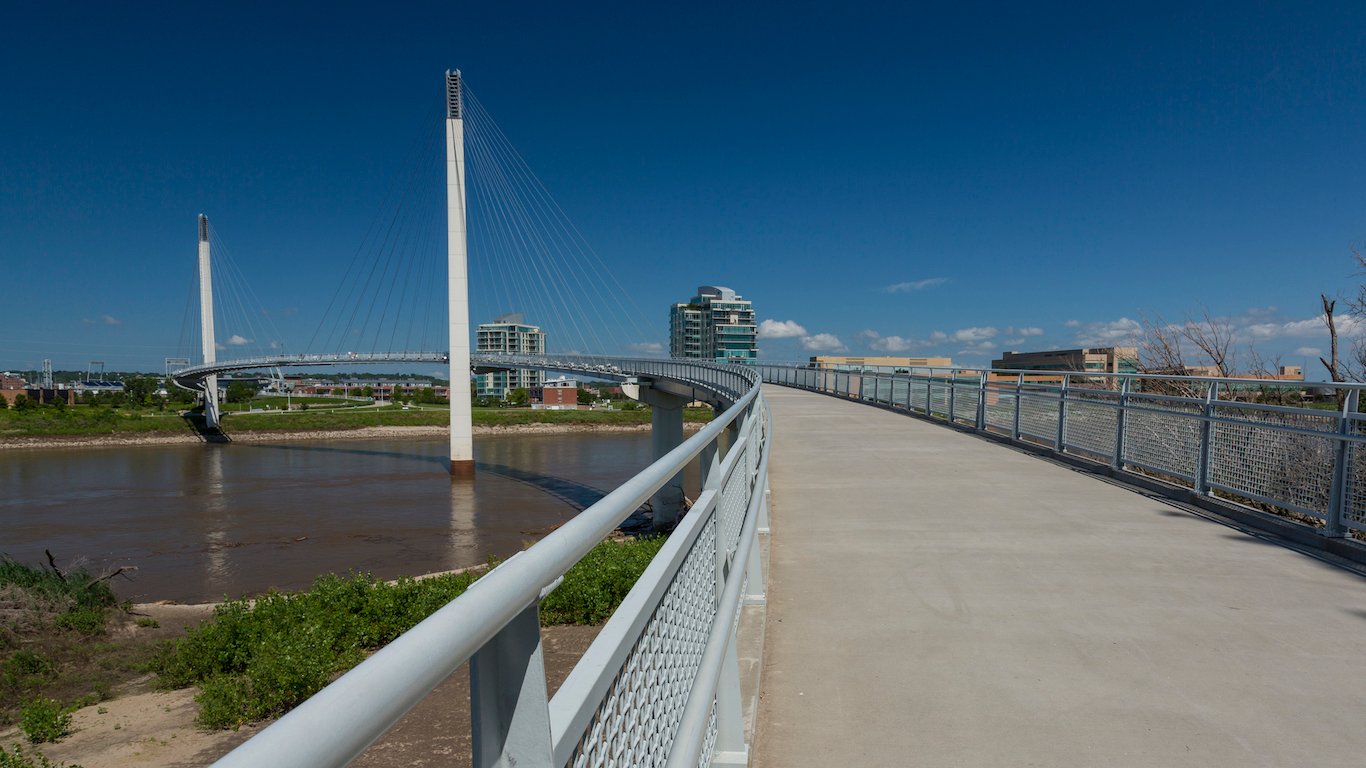
15. Council Bluffs, Iowa
> Property crimes per 100,000 people: 6,165 (total crimes: 3,862 total pop.: 62,642)
> Total larceny-thefts: 3,043
> Total burglaries: 387
> Total vehicle thefts: 432
> Poverty rate: 14.8%
> Statewide property crimes per 100,000 people: 2,086 (18th lowest)

16. Topeka, Kansas
> Property crimes per 100,000 people: 5,621 (total crimes: 7,148 total pop.: 127,166)
> Total larceny-thefts: 5,227
> Total burglaries: 1,114
> Total vehicle thefts: 807
> Poverty rate: 18.3%
> Statewide property crimes per 100,000 people: 2,696 (21st highest)
[in-text-ad]
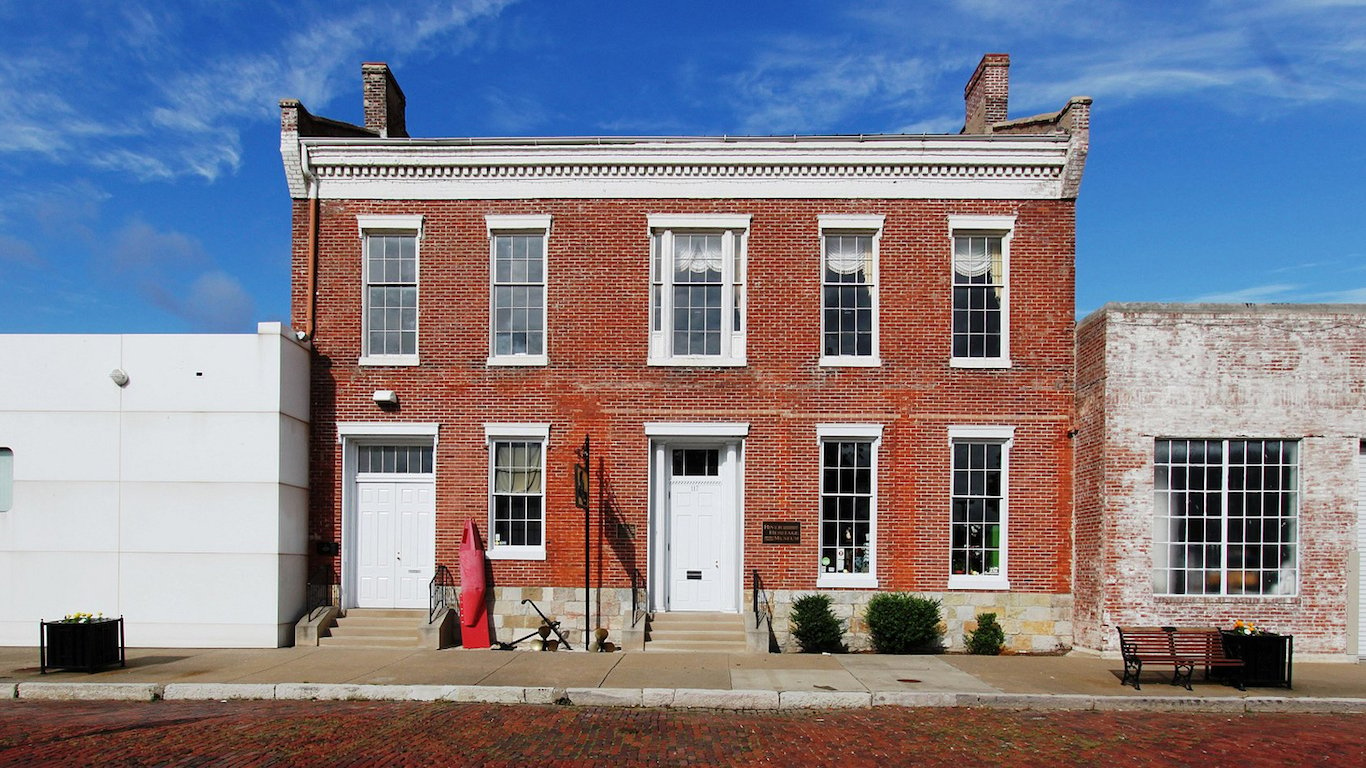
17. Paducah, Kentucky
> Property crimes per 100,000 people: 4,900 (total crimes: 1,217 total pop.: 24,836)
> Total larceny-thefts: 999
> Total burglaries: 150
> Total vehicle thefts: 68
> Poverty rate: 24.3%
> Statewide property crimes per 100,000 people: 2,190 (20th lowest)
[recirclink id=440072]
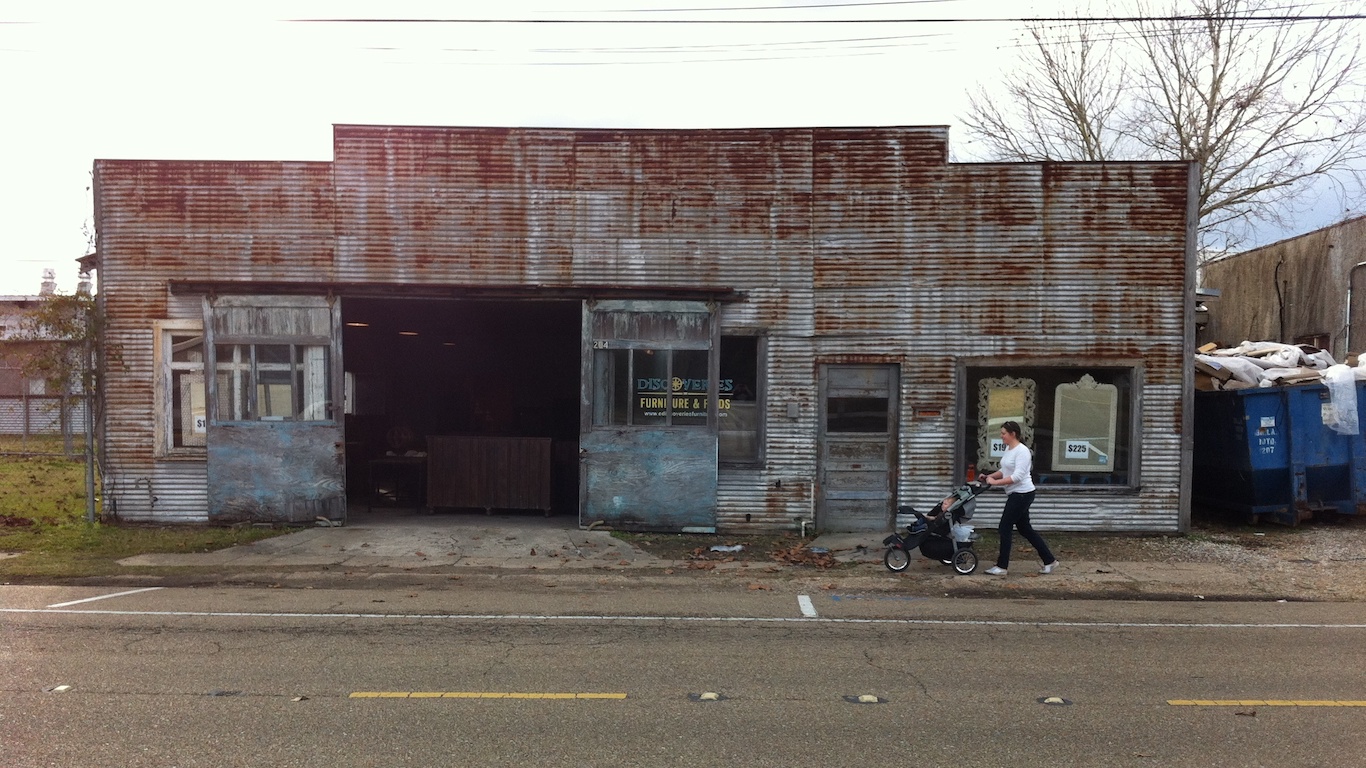
18. Hammond, Louisiana
> Property crimes per 100,000 people: 10,357 (total crimes: 2,131 total pop.: 20,576)
> Total larceny-thefts: 1,412
> Total burglaries: 627
> Total vehicle thefts: 92
> Poverty rate: 32.2%
> Statewide property crimes per 100,000 people: 3,298 (4th highest)
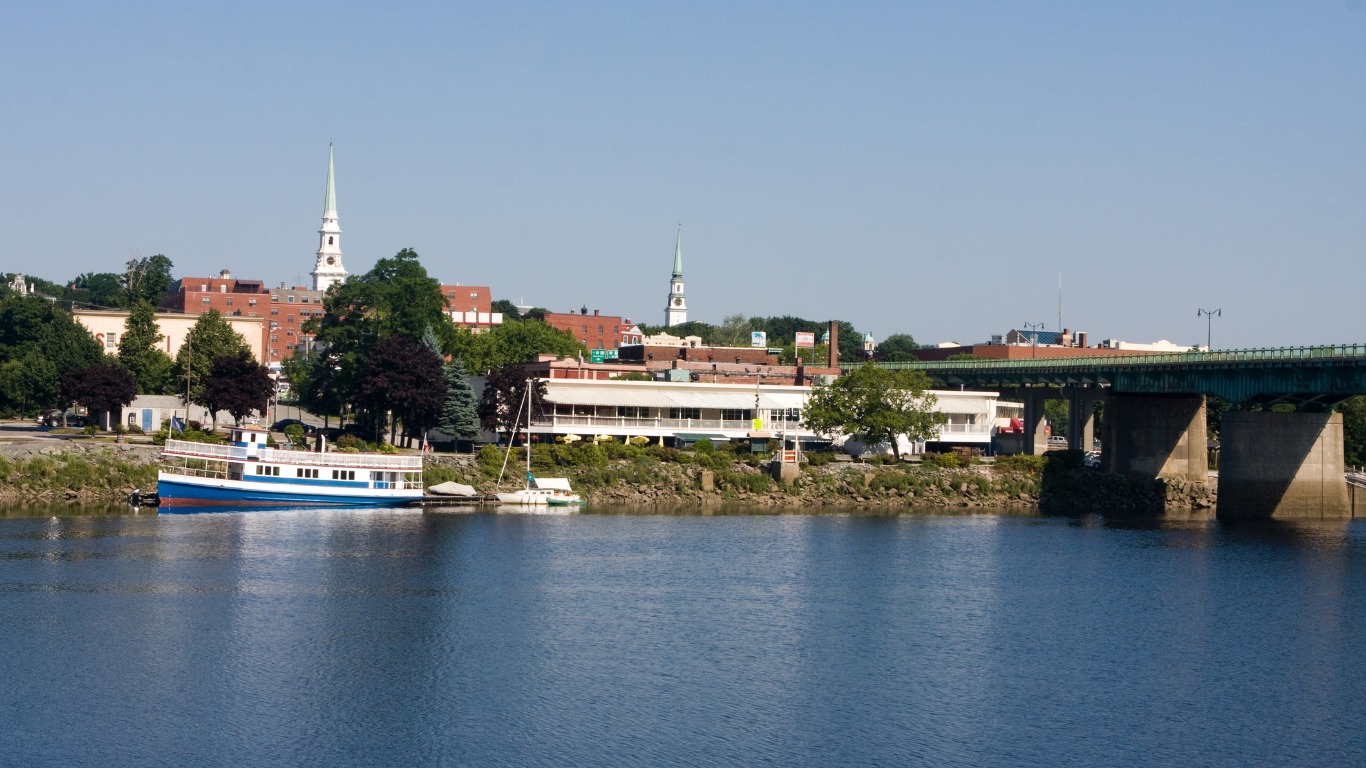
19. Bangor, Maine
> Property crimes per 100,000 people: 4,153 (total crimes: 1,340 total pop.: 32,264)
> Total larceny-thefts: 1,123
> Total burglaries: 180
> Total vehicle thefts: 37
> Poverty rate: 25.1%
> Statewide property crimes per 100,000 people: 1,646 (5th lowest)
[in-text-ad-2]
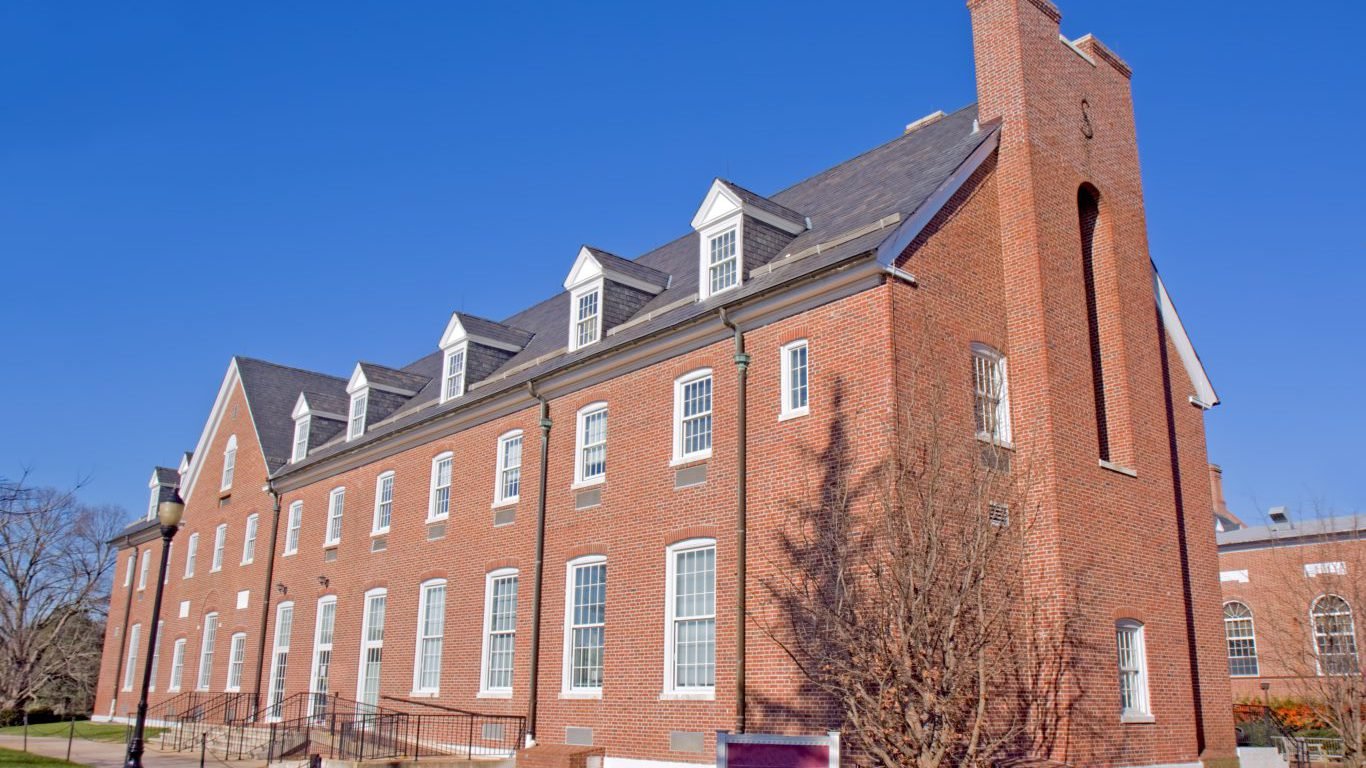
20. Salisbury, Maryland
> Property crimes per 100,000 people: 5,072 (total crimes: 1,695 total pop.: 33,417)
> Total larceny-thefts: 1,410
> Total burglaries: 234
> Total vehicle thefts: 51
> Poverty rate: 27.8%
> Statewide property crimes per 100,000 people: 2,284 (22nd lowest)
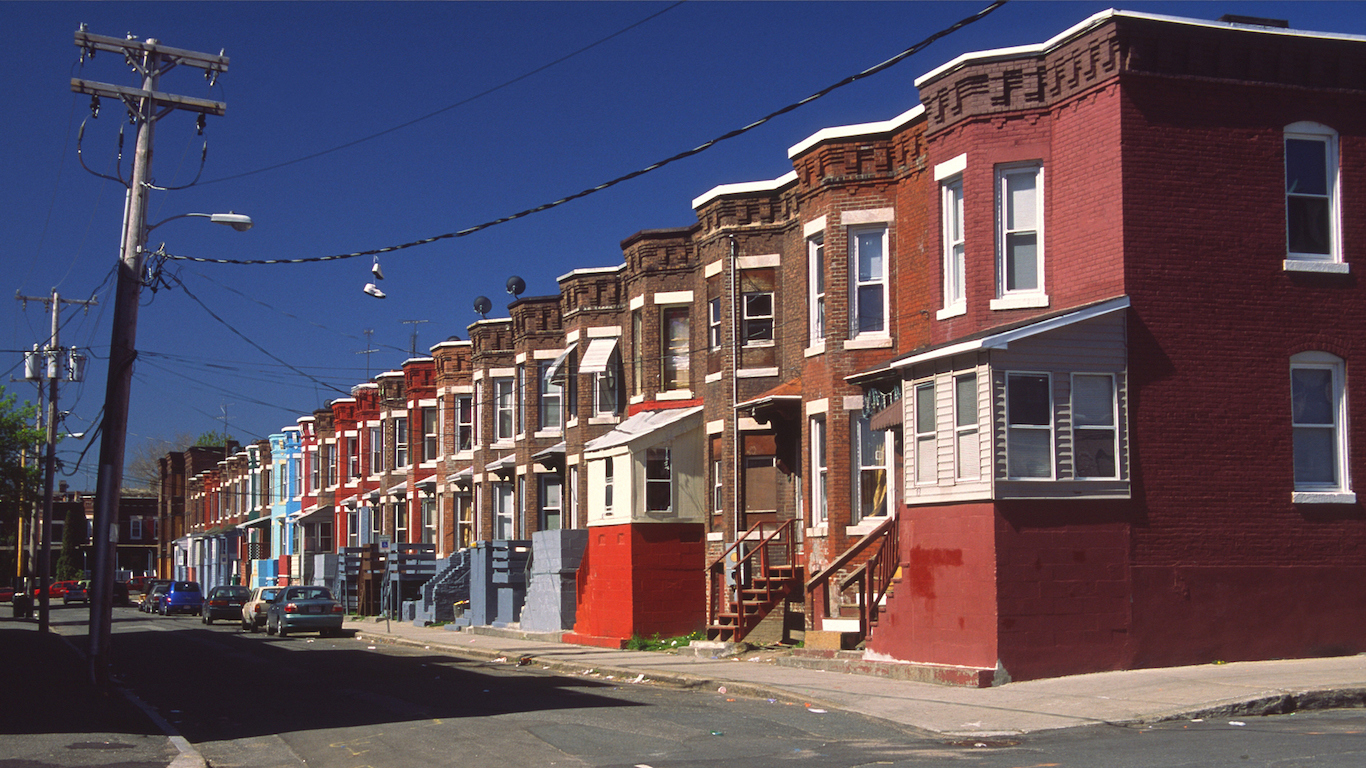
21. Holyoke, Massachusetts
> Property crimes per 100,000 people: 4,941 (total crimes: 2,013 total pop.: 40,738)
> Total larceny-thefts: 1,566
> Total burglaries: 318
> Total vehicle thefts: 129
> Poverty rate: 28.6%
> Statewide property crimes per 100,000 people: 1,561 (4th lowest)
[in-text-ad]
22. Flint Township, Michigan
> Property crimes per 100,000 people: 5,437 (total crimes: 1,656 total pop.: 30,460)
> Total larceny-thefts: 1,179
> Total burglaries: 374
> Total vehicle thefts: 103
> Poverty rate: 0.0%
> Statewide property crimes per 100,000 people: 1,910 (12th lowest)
[recirclink id=440483]

23. Roseville, Minnesota
> Property crimes per 100,000 people: 5,043 (total crimes: 1,813 total pop.: 35,954)
> Total larceny-thefts: 1,559
> Total burglaries: 177
> Total vehicle thefts: 77
> Poverty rate: 11.5%
> Statewide property crimes per 100,000 people: 2,133 (19th lowest)

24. Vicksburg, Mississippi
> Property crimes per 100,000 people: 6,221 (total crimes: 1,430 total pop.: 22,986)
> Total larceny-thefts: 1,126
> Total burglaries: 240
> Total vehicle thefts: 64
> Poverty rate: 35.8%
> Statewide property crimes per 100,000 people: 2,768 (16th highest)
[in-text-ad-2]
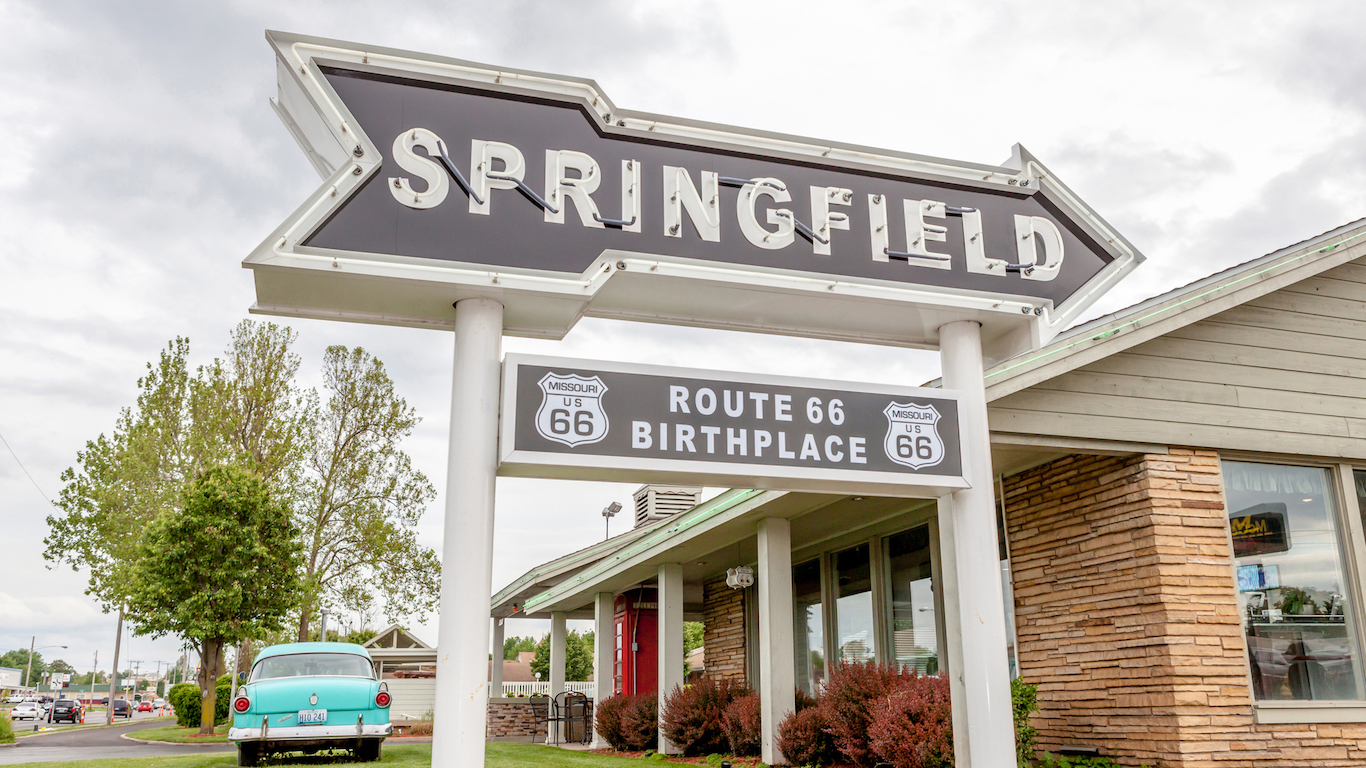
25. Springfield, Missouri
> Property crimes per 100,000 people: 8,467 (total crimes: 14,251 total pop.: 168,307)
> Total larceny-thefts: 10,483
> Total burglaries: 2,120
> Total vehicle thefts: 1,648
> Poverty rate: 25.9%
> Statewide property crimes per 100,000 people: 2,799 (15th highest)
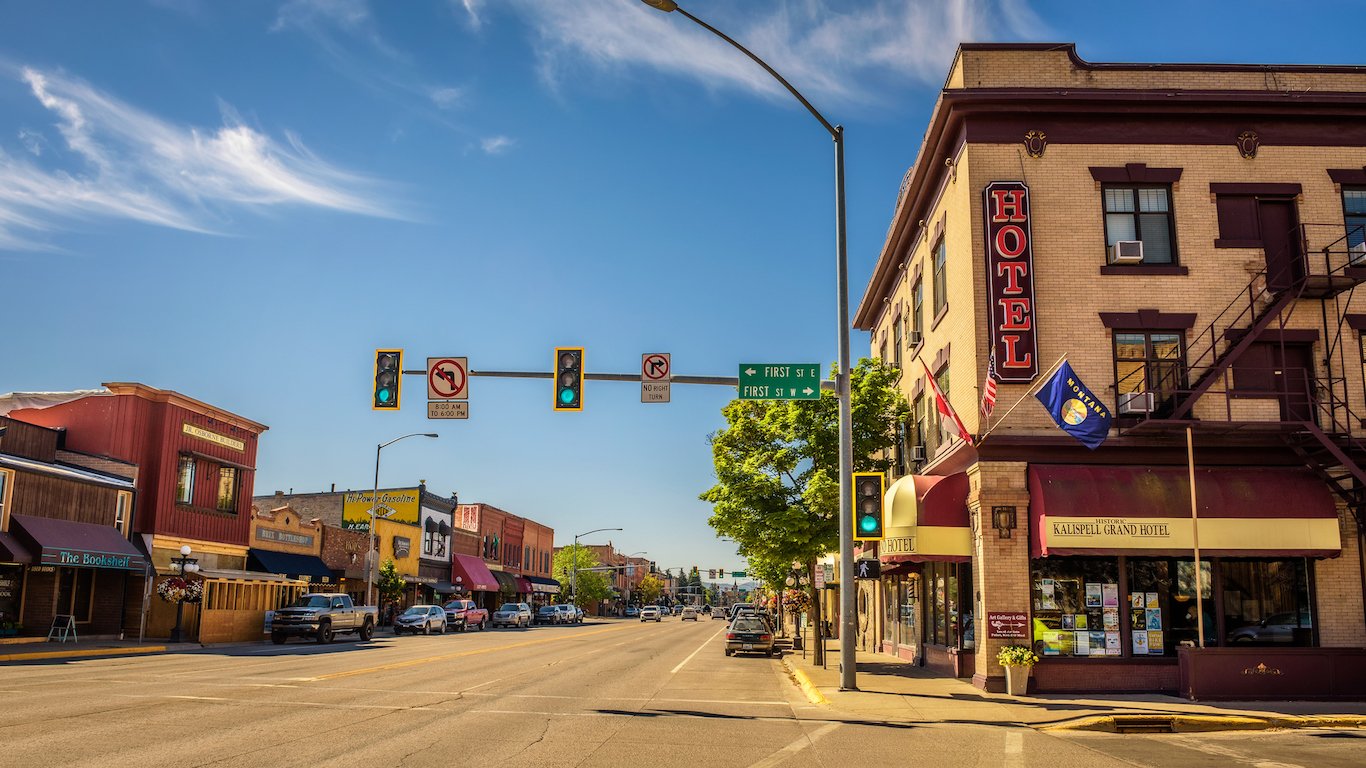
26. Kalispell, Montana
> Property crimes per 100,000 people: 5,732 (total crimes: 1,288 total pop.: 22,470)
> Total larceny-thefts: 1,126
> Total burglaries: 106
> Total vehicle thefts: 56
> Poverty rate: 18.5%
> Statewide property crimes per 100,000 people: 2,683 (23rd highest)
[in-text-ad]
27. Hastings, Nebraska
> Property crimes per 100,000 people: 3,816 (total crimes: 949 total pop.: 24,872)
> Total larceny-thefts: 737
> Total burglaries: 166
> Total vehicle thefts: 46
> Poverty rate: 12.5%
> Statewide property crimes per 100,000 people: 2,263 (21st lowest)
[recirclink id=440394]

28. Reno, Nevada
> Property crimes per 100,000 people: 3,244 (total crimes: 7,933 total pop.: 244,554)
> Total larceny-thefts: 5,381
> Total burglaries: 1,208
> Total vehicle thefts: 1,344
> Poverty rate: 18.4%
> Statewide property crimes per 100,000 people: 2,587 (25th highest)
29. Rochester, New Hampshire
> Property crimes per 100,000 people: 3,333 (total crimes: 1,003 total pop.: 30,096)
> Total larceny-thefts: 832
> Total burglaries: 136
> Total vehicle thefts: 35
> Poverty rate: 11.7%
> Statewide property crimes per 100,000 people: 1,513 (the lowest)
[in-text-ad-2]
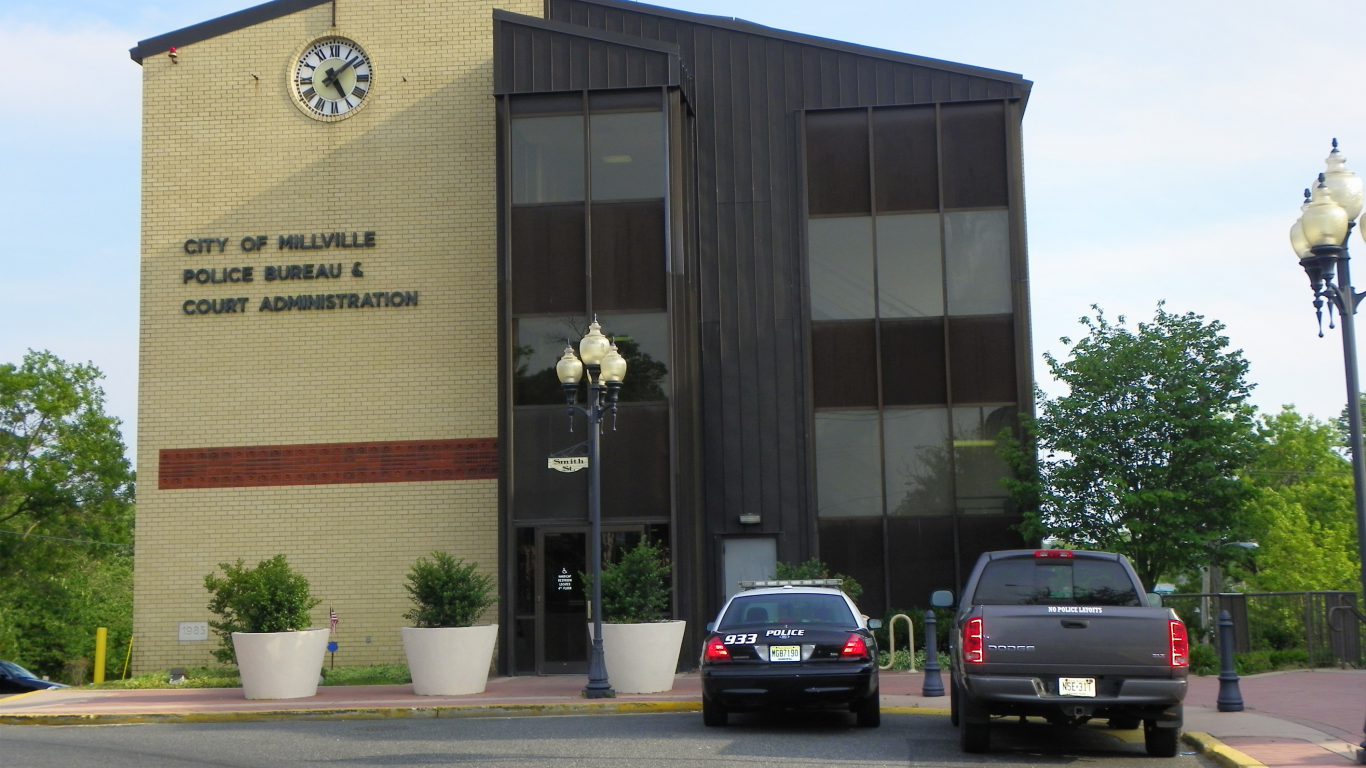
30. Millville, New Jersey
> Property crimes per 100,000 people: 6,083 (total crimes: 1,714 total pop.: 28,177)
> Total larceny-thefts: 1,352
> Total burglaries: 304
> Total vehicle thefts: 58
> Poverty rate: 18.0%
> Statewide property crimes per 100,000 people: 1,545 (2nd lowest)

31. Gallup, New Mexico
> Property crimes per 100,000 people: 7,004 (total crimes: 1,648 total pop.: 23,528)
> Total larceny-thefts: 1,231
> Total burglaries: 282
> Total vehicle thefts: 135
> Poverty rate: 29.1%
> Statewide property crimes per 100,000 people: 3,937 (the highest)
[in-text-ad]

32. Niagara Falls, New York
> Property crimes per 100,000 people: 4,935 (total crimes: 2,402 total pop.: 48,675)
> Total larceny-thefts: 1,665
> Total burglaries: 551
> Total vehicle thefts: 186
> Poverty rate: 27.2%
> Statewide property crimes per 100,000 people: 1,546 (3rd lowest)
[recirclink id=440150]
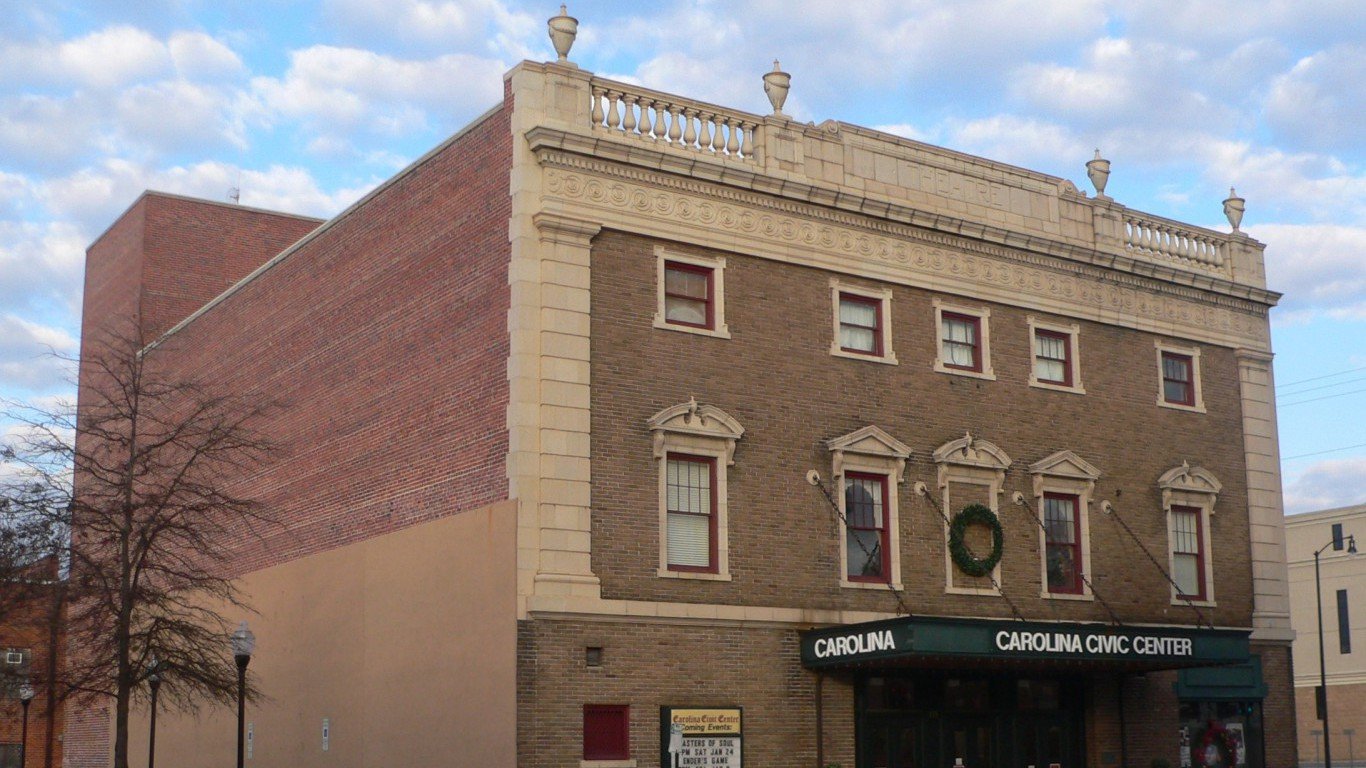
33. Lumberton, North Carolina
> Property crimes per 100,000 people: 13,827 (total crimes: 2,998 total pop.: 21,683)
> Total larceny-thefts: 1,917
> Total burglaries: 920
> Total vehicle thefts: 161
> Poverty rate: 35.1%
> Statewide property crimes per 100,000 people: 2,737 (20th highest)

34. Mandan, North Dakota
> Property crimes per 100,000 people: 3,648 (total crimes: 803 total pop.: 22,011)
> Total larceny-thefts: 589
> Total burglaries: 116
> Total vehicle thefts: 98
> Poverty rate: 10.6%
> Statewide property crimes per 100,000 people: 2,296 (23rd lowest)
[in-text-ad-2]
35. Chillicothe, Ohio
> Property crimes per 100,000 people: 8,054 (total crimes: 1,747 total pop.: 21,692)
> Total larceny-thefts: 1,355
> Total burglaries: 350
> Total vehicle thefts: 42
> Poverty rate: 22.5%
> Statewide property crimes per 100,000 people: 2,577 (25th lowest)

36. Tulsa, Oklahoma
> Property crimes per 100,000 people: 5,904 (total crimes: 23,956 total pop.: 405,748)
> Total larceny-thefts: 14,516
> Total burglaries: 5,780
> Total vehicle thefts: 3,660
> Poverty rate: 20.3%
> Statewide property crimes per 100,000 people: 2,983 (9th highest)
[in-text-ad]

37. Medford, Oregon
> Property crimes per 100,000 people: 7,040 (total crimes: 5,688 total pop.: 80,794)
> Total larceny-thefts: 4,793
> Total burglaries: 486
> Total vehicle thefts: 409
> Poverty rate: 21.4%
> Statewide property crimes per 100,000 people: 2,964 (11th highest)
[recirclink id=440088]

38. Pottstown, Pennsylvania
> Property crimes per 100,000 people: 4,093 (total crimes: 930 total pop.: 22,719)
> Total larceny-thefts: 753
> Total burglaries: 122
> Total vehicle thefts: 55
> Poverty rate: 21.7%
> Statewide property crimes per 100,000 people: 1,743 (7th lowest)

39. Newport, Rhode Island
> Property crimes per 100,000 people: 2,887 (total crimes: 695 total pop.: 24,077)
> Total larceny-thefts: 554
> Total burglaries: 105
> Total vehicle thefts: 36
> Poverty rate: 13.3%
> Statewide property crimes per 100,000 people: 1,899 (11th lowest)
[in-text-ad-2]

40. Myrtle Beach, South Carolina
> Property crimes per 100,000 people: 13,793 (total crimes: 4,395 total pop.: 31,864)
> Total larceny-thefts: 3,555
> Total burglaries: 469
> Total vehicle thefts: 371
> Poverty rate: 22.9%
> Statewide property crimes per 100,000 people: 3,244 (6th highest)

41. Rapid City, South Dakota
> Property crimes per 100,000 people: 3,977 (total crimes: 2,966 total pop.: 74,573)
> Total larceny-thefts: 2,236
> Total burglaries: 480
> Total vehicle thefts: 250
> Poverty rate: 16.4%
> Statewide property crimes per 100,000 people: 1,981 (15th lowest)
[in-text-ad]
42. Cleveland, Tennessee
> Property crimes per 100,000 people: 6,087 (total crimes: 2,704 total pop.: 44,423)
> Total larceny-thefts: 2,044
> Total burglaries: 406
> Total vehicle thefts: 254
> Poverty rate: 23.4%
> Statewide property crimes per 100,000 people: 2,854 (14th highest)
[recirclink id=439690]

43. San Antonio, Texas
> Property crimes per 100,000 people: 5,190 (total crimes: 77,786 total pop.: 1,498,642)
> Total larceny-thefts: 58,318
> Total burglaries: 12,235
> Total vehicle thefts: 7,233
> Poverty rate: 19.5%
> Statewide property crimes per 100,000 people: 2,760 (18th highest)

44. Salt Lake City, Utah
> Property crimes per 100,000 people: 8,535 (total crimes: 16,551 total pop.: 193,918)
> Total larceny-thefts: 12,814
> Total burglaries: 1,807
> Total vehicle thefts: 1,930
> Poverty rate: 19.1%
> Statewide property crimes per 100,000 people: 2,952 (12th highest)
[in-text-ad-2]

45. Essex, Vermont
> Property crimes per 100,000 people: 1,579 (total crimes: 335 total pop.: 21,217)
> Total larceny-thefts: 282
> Total burglaries: 49
> Total vehicle thefts: 04
> Poverty rate: 15.1%
> Statewide property crimes per 100,000 people: 1,697 (6th lowest)
46. Portsmouth, Virginia
> Property crimes per 100,000 people: 5,608 (total crimes: 5,373 total pop.: 95,813)
> Total larceny-thefts: 3,707
> Total burglaries: 1,208
> Total vehicle thefts: 458
> Poverty rate: 18.2%
> Statewide property crimes per 100,000 people: 1,859 (10th lowest)
[in-text-ad]

47. Tukwila, Washington
> Property crimes per 100,000 people: 15,489 (total crimes: 3,128 total pop.: 20,195)
> Total larceny-thefts: 2,391
> Total burglaries: 203
> Total vehicle thefts: 534
> Poverty rate: 21.5%
> Statewide property crimes per 100,000 people: 3,494 (2nd highest)
[recirclink id=439852]

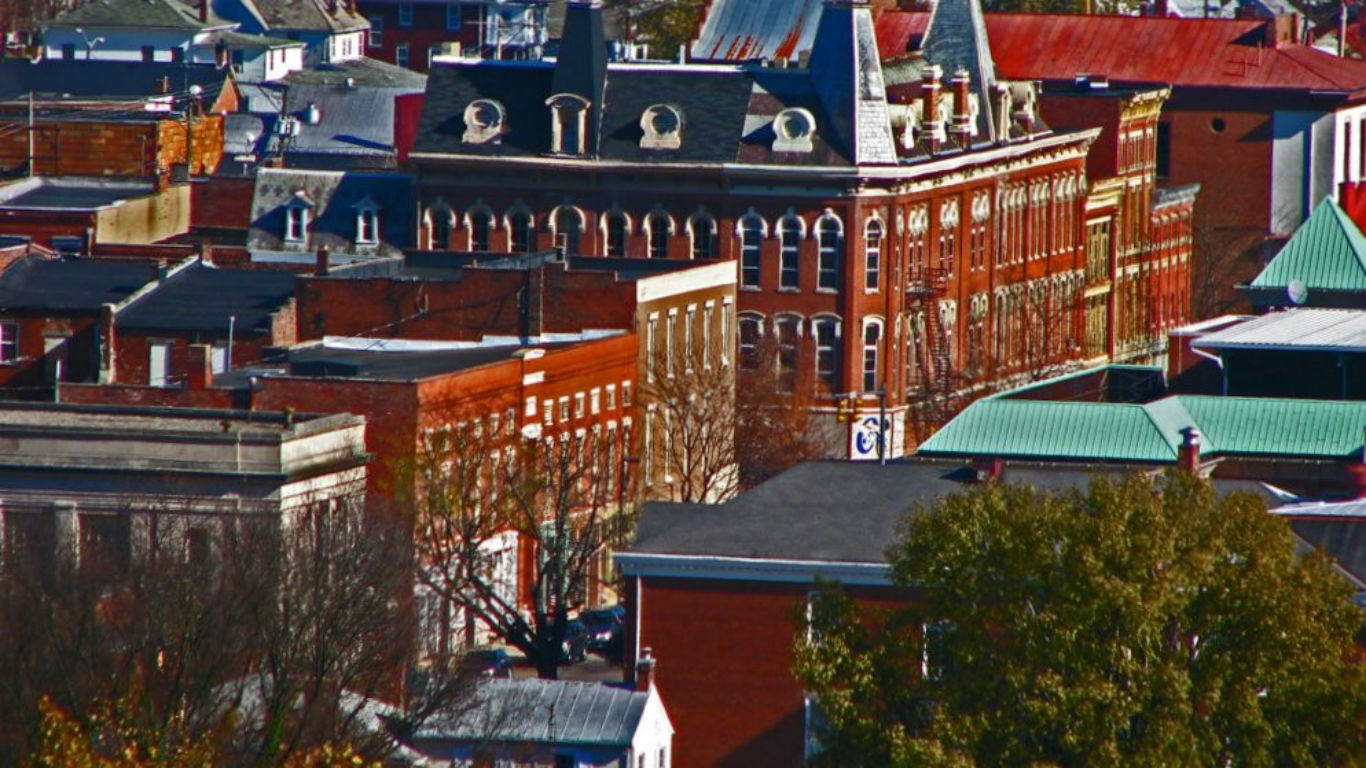
48. Charleston, West Virginia
> Property crimes per 100,000 people: 7,969 (total crimes: 3,939 total pop.: 49,429)
> Total larceny-thefts: 2,694
> Total burglaries: 947
> Total vehicle thefts: 298
> Poverty rate: 20.0%
> Statewide property crimes per 100,000 people: 2,047 (16th lowest)

49. Superior, Wisconsin
> Property crimes per 100,000 people: 4,745 (total crimes: 1,255 total pop.: 26,451)
> Total larceny-thefts: 1,066
> Total burglaries: 131
> Total vehicle thefts: 58
> Poverty rate: 20.3%
> Statewide property crimes per 100,000 people: 1,933 (13th lowest)
[in-text-ad-2]

50. Cheyenne, Wyoming
> Property crimes per 100,000 people: 3,789 (total crimes: 2,427 total pop.: 64,046)
> Total larceny-thefts: 1,873
> Total burglaries: 356
> Total vehicle thefts: 198
> Poverty rate: 11.1%
> Statewide property crimes per 100,000 people: 1,957 (14th lowest)
Detailed Findings & Methodology
Unlike more violent types of crime, the prevalence of property crime could actually indicate economic health, according to Roman. “Property crime goes where the goods are,” he said. So while high incidence of any crime is generally a negative sign, popular shopping centers, malls, and dense clusters of retail outlets can help explain a relatively high property crime rate. In such cases, Roman explained, “property crime goes up just because there are a lot of targets.”
The concentration of retail locations — the number of retail outlets per 100,000 people — exceeds the corresponding state concentration in 18 of the 50 cities on this list. Similarly, despite what high crime levels might suggest about a local economy, the unemployment rate in 18 of the 50 cities with the highest property crime rates in their states was under the national rate in December of 4.1%.
However, high property crime levels are still closely tied to widespread lack of economic opportunity. A run-down mall struggling to maintain its facilities will likely have fewer security measures in place and more would-be property offenders. Such locations are as good or better targets compared to a popular shopping center in an economically vibrant city. The poverty rate in 37 of the 50 cities on this list exceeds the national poverty rate of 15%.
Roman suggested that places hit especially hard by the national opioid epidemic, themselves frequently economically disadvantaged areas, may also see rising property crime rates as a consequence.
A number of the cities with high property crime rates are college towns. Roman gave several possible explanations to the pattern. ”College students tend to have above average wealth, including property worth stealing,” he wrote. “Young people are more likely than average to be victims of crime and to commit crimes in general, and the more of them there are in a place, the more risk there is.”
He added, “College age people are still not fully emotionally mature according to brain research and thus prone to risky behavior, including failure to take simple anti-crime prevention measures, locking doors, looking after their stuff, etc.”
Not unlike the typical college town, the cities where property crime is most prevalent tend to be small to mid-sized cities.
To identify the cities with the most property crime in every state, 24/7 Wall St. reviewed the number of property crimes reported per 100,000 people in cities with populations of 20,000 or more from the FBI’s 2016 Uniform Crime Report. Property crime includes burglaries, larceny-thefts, and motor vehicle theft. Population figures and state crime data also came from the FBI.
Poverty rates and Gini coefficients, which measure income inequality, came from the U.S. Census Bureau’s American Community Survey. Total retail outlets are tallies of sporting goods, hobby, musical instrument, book stores, general merchandise stores, miscellaneous store retailers, and nonstore retailers as of 2015 from County Business Patterns, published by the U.S. Census Bureau.
Contact [email protected] for any questions or corrections.