[cnxvideo id=”655235″ placement=”ros”]Few public services in the United States contain such stark differences in quality as the public education system. While there are several school districts that spend more than $50,000 per student on education each year, in other districts education expenditures amount to less than $2,000 per student.
That difference in spending contributes to major disparities in student outcomes throughout the country. The majority of a school’s budget is spent on staff and teacher salaries. A school that lacks the resources to attract the best teachers can put students at a greater disadvantage.
Those disadvantages are often the greatest in the poorest parts of the country. Approximately 44% of all school funding in the United States comes from local sources such as property tax. As a result, many of the worst school districts are in poor counties where a majority of households make less than half of that of the typical American household.
To determine the worst school district in every state, 24/7 Wall St. developed an index based on various measures of child poverty, per-pupil expenditure, graduation rate, teachers per student, the percentage of adults with a bachelor’s degree, preschool enrollment, and AP enrollment.
Click here to see the worst school districts in every state.
Click here to see our detailed findings and methodology.
Correction: Because of possible reporting inaccuracies due to migration, district boundary changes, school attendance area changes, and other technical factors causing distortions in high school graduation rates published by the National Center for Education Statistics, a previous version of this article listed different school districts for the states of Arizona, California, Colorado, New Mexico, and Wisconsin. These errors have been corrected.
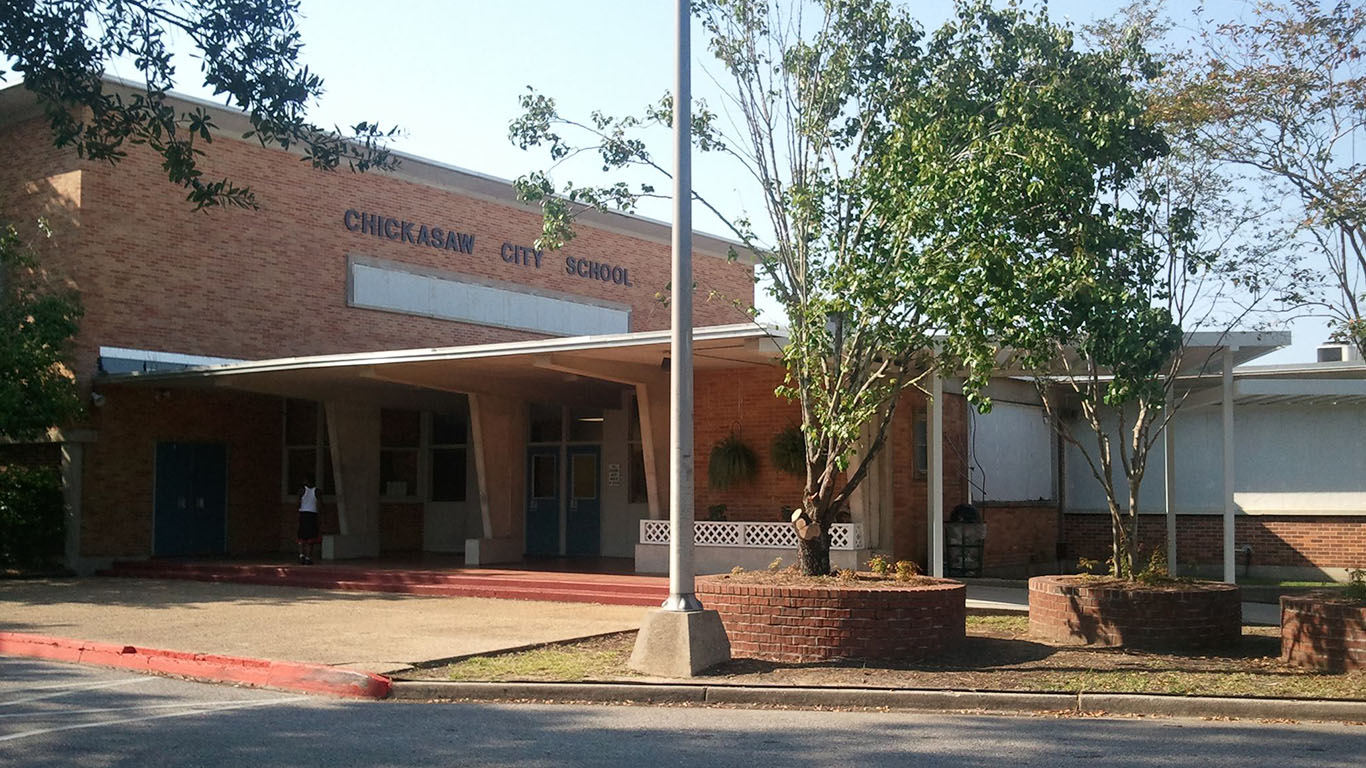
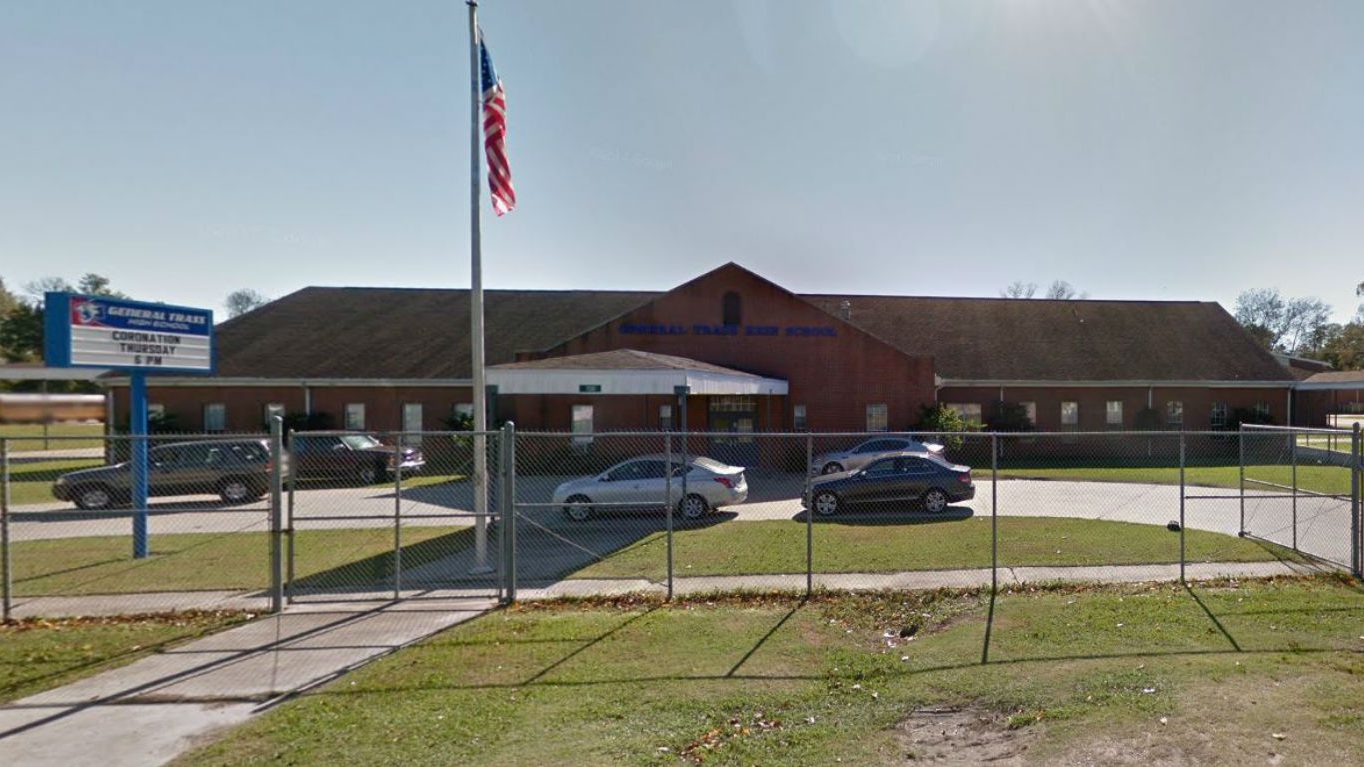
1. Alabama
> Worst school district: Chickasaw City School District
> Location: Mobile County
> Per student spending: $8,347 (total enrollment: 950)
> High school graduation rate: N/A
> Adults with a bachelor’s degree: 12.4%
[in-text-ad]

2. Alaska
> Worst school district: Hydaburg City School District
> Location: Prince of Wales-Hyder Cen
> Per student spending: $33,825 (total enrollment: 80)
> High school graduation rate: N/A
> Adults with a bachelor’s degree: 4.5%
[recirclink id=444468]

3. Arizona
> Worst school district: Duncan Unified District
> Location: Greenlee County
> Per student spending: $10,770 (total enrollment: 322)
> High school graduation rate: N/A
> Adults with a bachelor’s degree: 13.1%
Editor’s Note: Based on an examination of the National Center for Education Statistics database from the U.S. Department of Education used as part of the research for this article, 24/7 Wall St. believes that due to a reporting error with regards to the Arizona Department of Education the high school graduation rate for St. Johns Unified School District is incorrect. We have taken St. Johns Unified District off the list and replaced it with the Duncan Unified School District in Arizona.
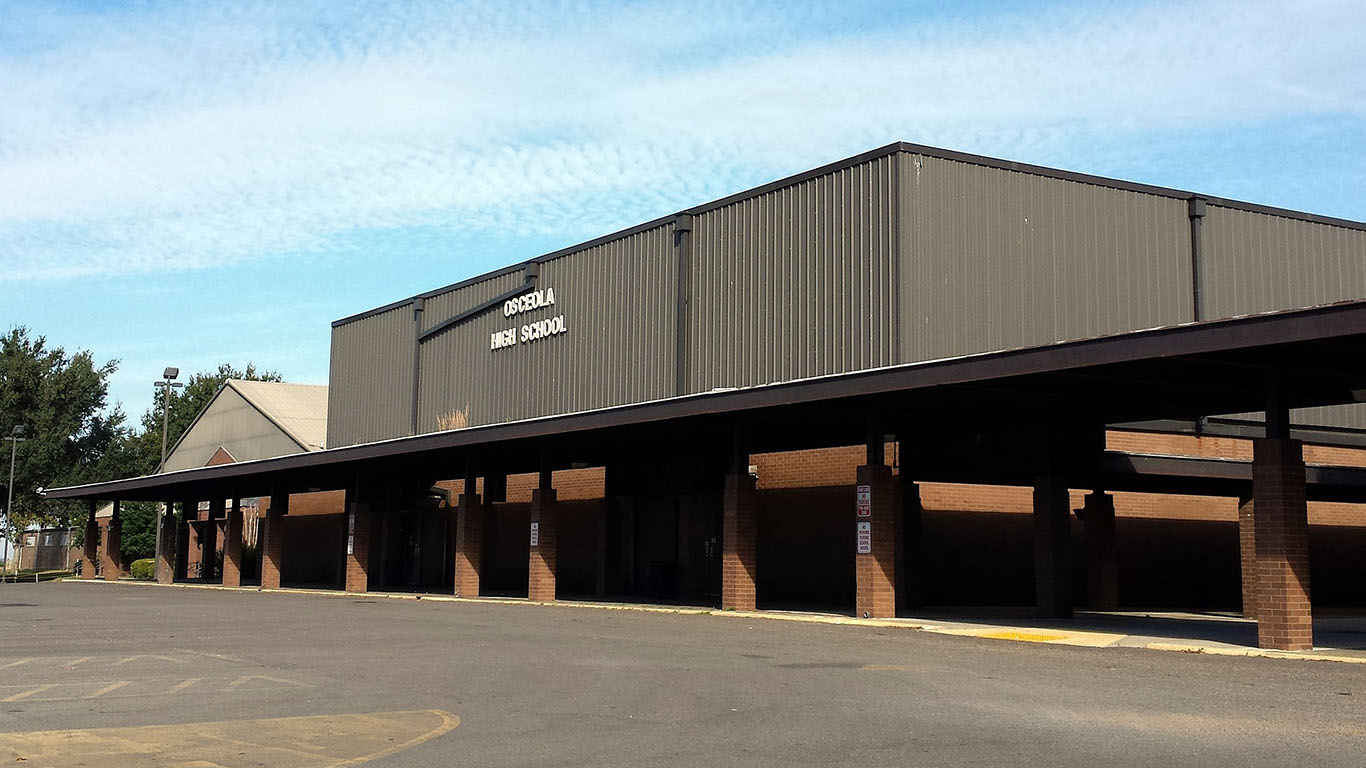
4. Arkansas
> Worst school district: Osceola School District
> Location: Mississippi County
> Per student spending: $10,307 (total enrollment: 1,369)
> High school graduation rate: 44.9%
> Adults with a bachelor’s degree: 8.2%
[in-text-ad-2]
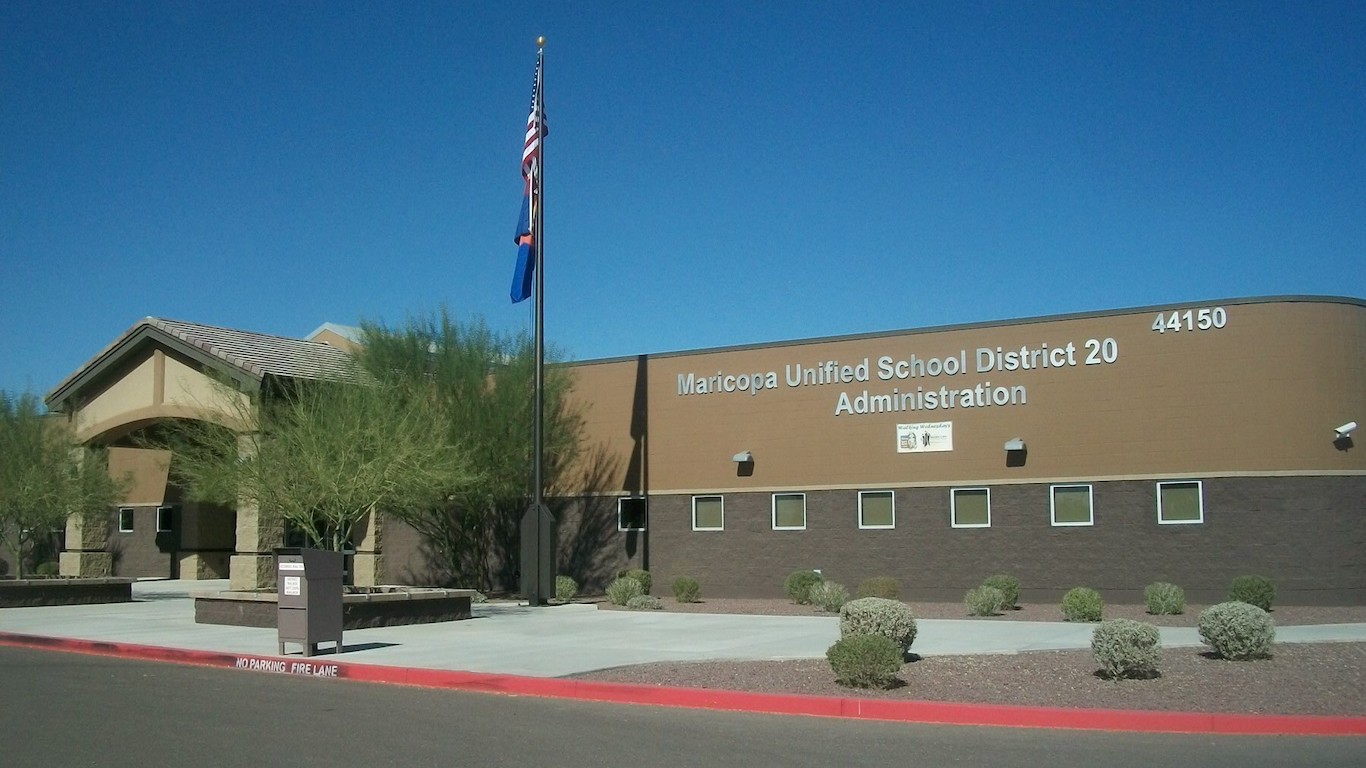
5. California
> Worst school district: Maricopa Unified School District
> Location: Kern County
> Per student spending: $1,988 (total enrollment: 2,438)
> High school graduation rate: 28.4%
> Adults with a bachelor’s degree: 10.3%
Editor’s Note: Because of inaccuracies possibly due to migration, district boundary changes, school attendance area changes, or other technical factors, a previous version of this article incorrectly identified Mendota Unified School District as the worst school district in California. The error has been corrected.

6. Colorado
> Worst school district: Huerfano School District RE-1
> Location: Huerfano County
> Per student spending: $9,473 (total enrollment: 537)
> High school graduation rate: 57.4%
> Adults with a bachelor’s degree: 21.7%
Editor’s Note: Because of inaccuracies possibly due to migration, district boundary changes, school attendance area changes, or other technical factors, a previous version of this article incorrectly identified Vilas School District RE-5 as the worst school district in Colorado. The error has been corrected.
[in-text-ad]

7. Connecticut
> Worst school district: Ansonia School District
> Location: New Haven County
> Per student spending: $14,932 (total enrollment: 2,399)
> High school graduation rate: N/A
> Adults with a bachelor’s degree: 16.4%
[recirclink id=444391]

8. Delaware
> Worst school district: Laurel School District
> Location: Sussex County
> Per student spending: $11,232 (total enrollment: 2,168)
> High school graduation rate: 65.3%
> Adults with a bachelor’s degree: 13.0%
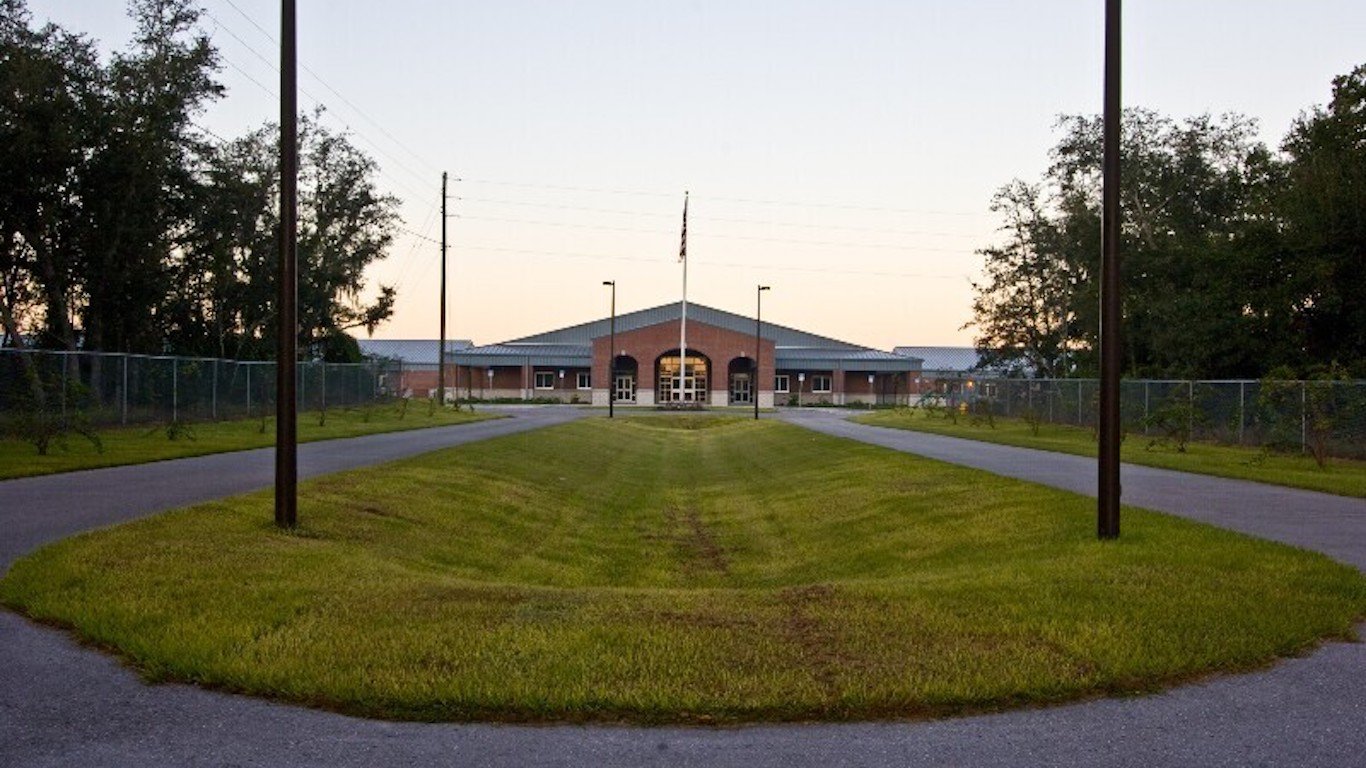
9. Florida
> Worst school district: Hardee County School District
> Location: Hardee County
> Per student spending: $9,282 (total enrollment: 5,226)
> High school graduation rate: 58.4%
> Adults with a bachelor’s degree: 9.6%
[in-text-ad-2]
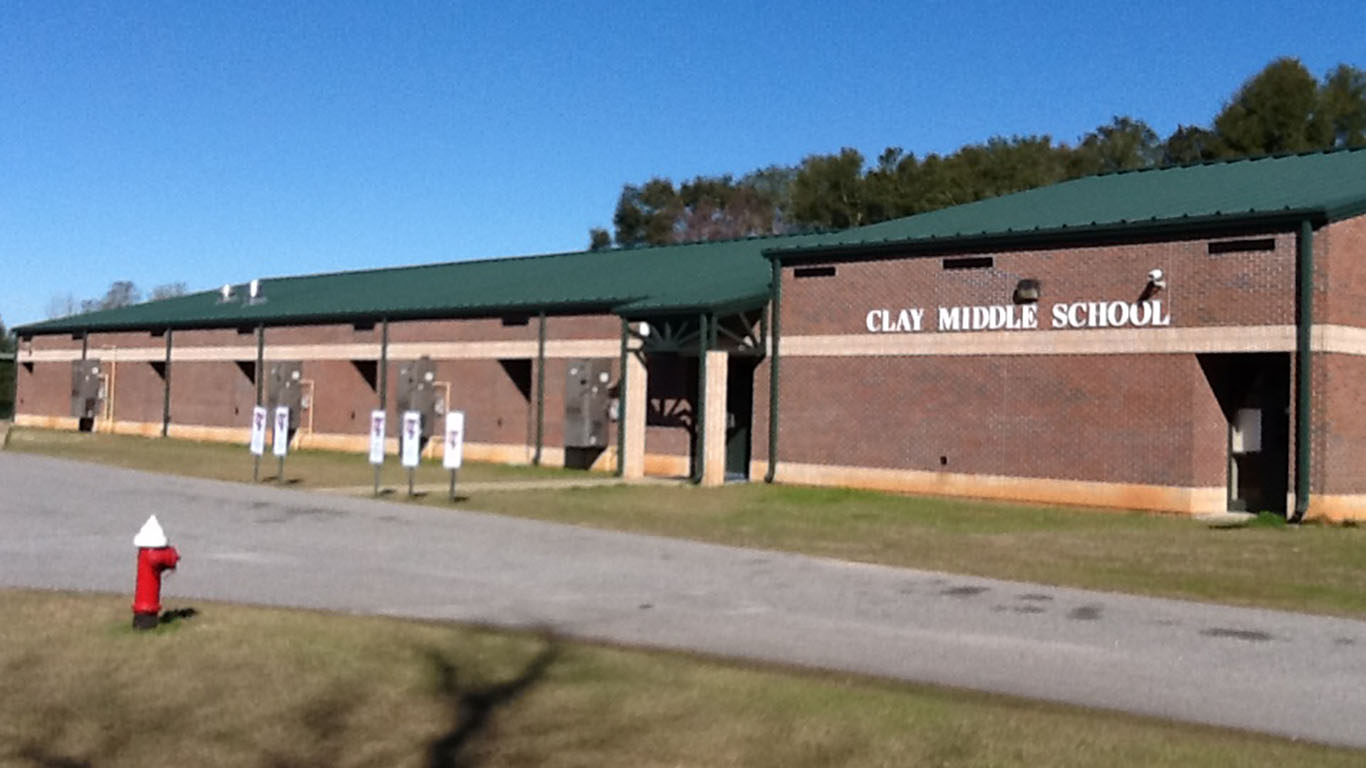
10. Georgia
> Worst school district: Clay County School District
> Location: Clay County
> Per student spending: $13,091 (total enrollment: 308)
> High school graduation rate: N/A
> Adults with a bachelor’s degree: 7.4%
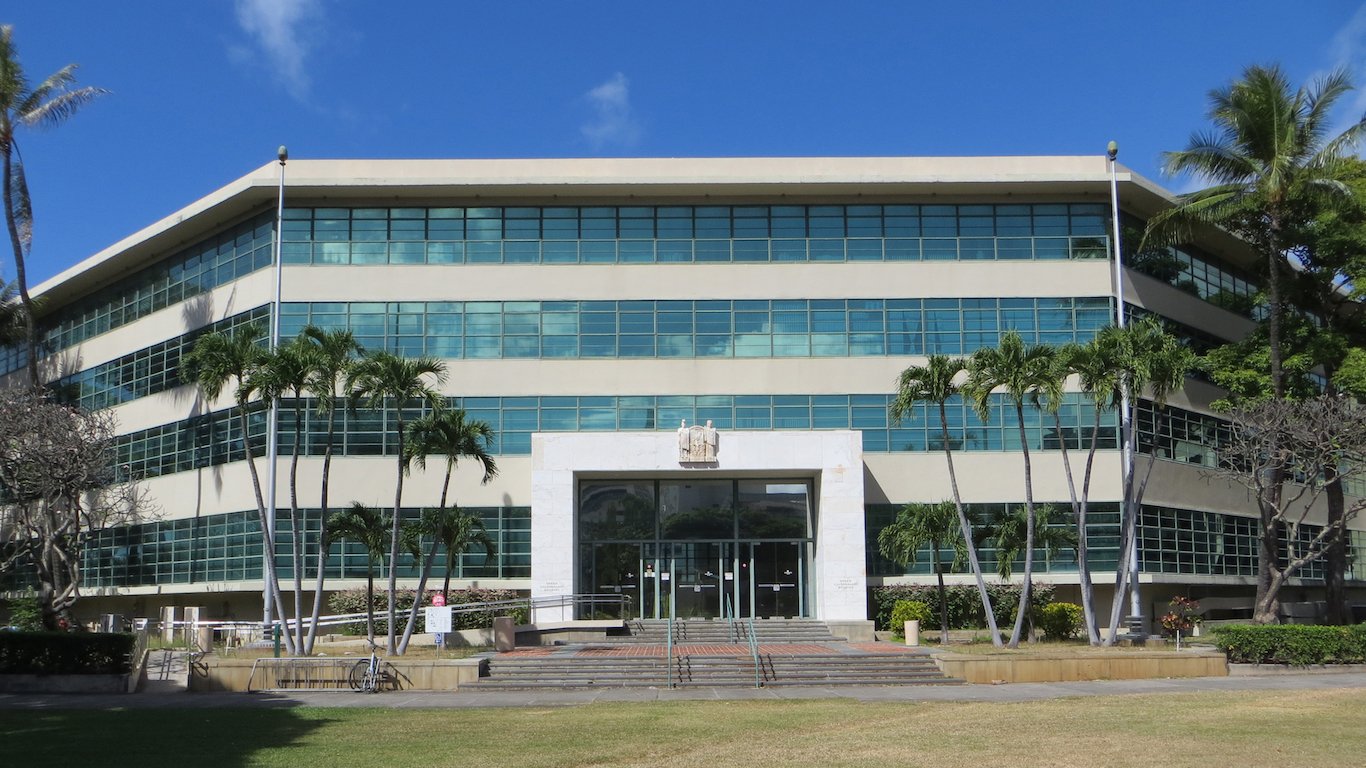
11. Hawaii
> Worst school district: Hawaii Department of Education
> Location: Hawaii, Honolulu, Kalawao, Kauai, and Maui Counties
> Per student spending: $12,855 (total enrollment: 182,384)
> High school graduation rate: 75.4%
> Adults with a bachelor’s degree: 31.4%
[in-text-ad]
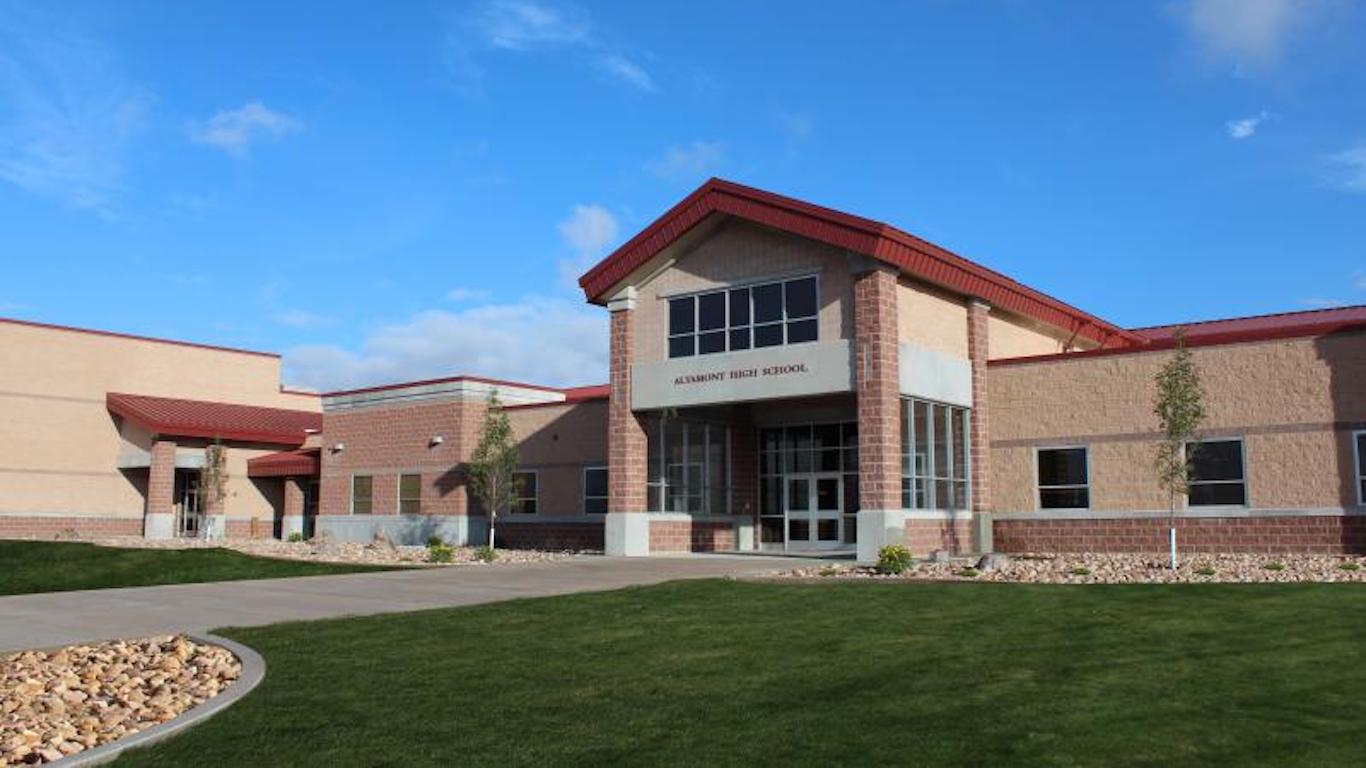
12. Idaho
> Worst school district: Wilder School District 133
> Location: Canyon County
> Per student spending: $7,993 (total enrollment: 447)
> High school graduation rate: 43.3%
> Adults with a bachelor’s degree: 11.4%
[recirclink id=444326]
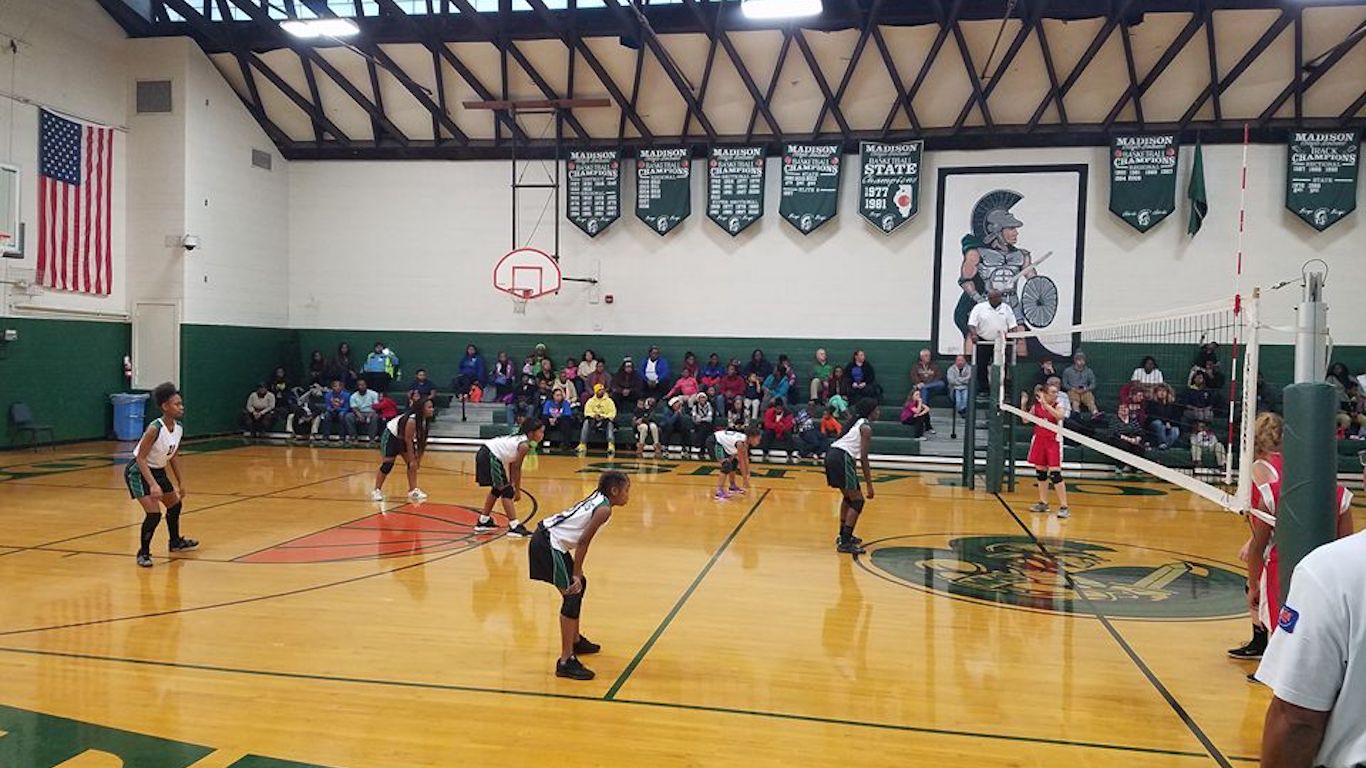
13. Illinois
> Worst school district: Madison Community Unit School District 12
> Location: Madison County
> Per student spending: $12,983 (total enrollment: 775)
> High school graduation rate: 66.7%
> Adults with a bachelor’s degree: 5.4%
14. Indiana
> Worst school district: City of East Chicago School District
> Location: Lake County
> Per student spending: $12,769 (total enrollment: 5,067)
> High school graduation rate: 40.9%
> Adults with a bachelor’s degree: 8.2%
[in-text-ad-2]

15. Iowa
> Worst school district: Seymour Community School District
> Location: Appanoose and Wayne County
> Per student spending: $8,400 (total enrollment: 285)
> High school graduation rate: 80.8%
> Adults with a bachelor’s degree: 11.0%
16. Kansas
> Worst school district: Montezuma Unified School District 371
> Location: Gray and Meade County
> Per student spending: $11,879 (total enrollment: 265)
> High school graduation rate: N/A
> Adults with a bachelor’s degree: 13.0%
[in-text-ad]

17. Kentucky
> Worst school district: Breathitt County School District
> Location: Breathitt County
> Per student spending: $10,437 (total enrollment: 2,030)
> High school graduation rate: 77.2%
> Adults with a bachelor’s degree: 11.8%
[recirclink id=444046]
18. Louisiana
> Worst school district: East Carroll Parish School District
> Location: East Carroll Parish
> Per student spending: $12,133 (total enrollment: 1,094)
> High school graduation rate: 68.3%
> Adults with a bachelor’s degree: 11.3%
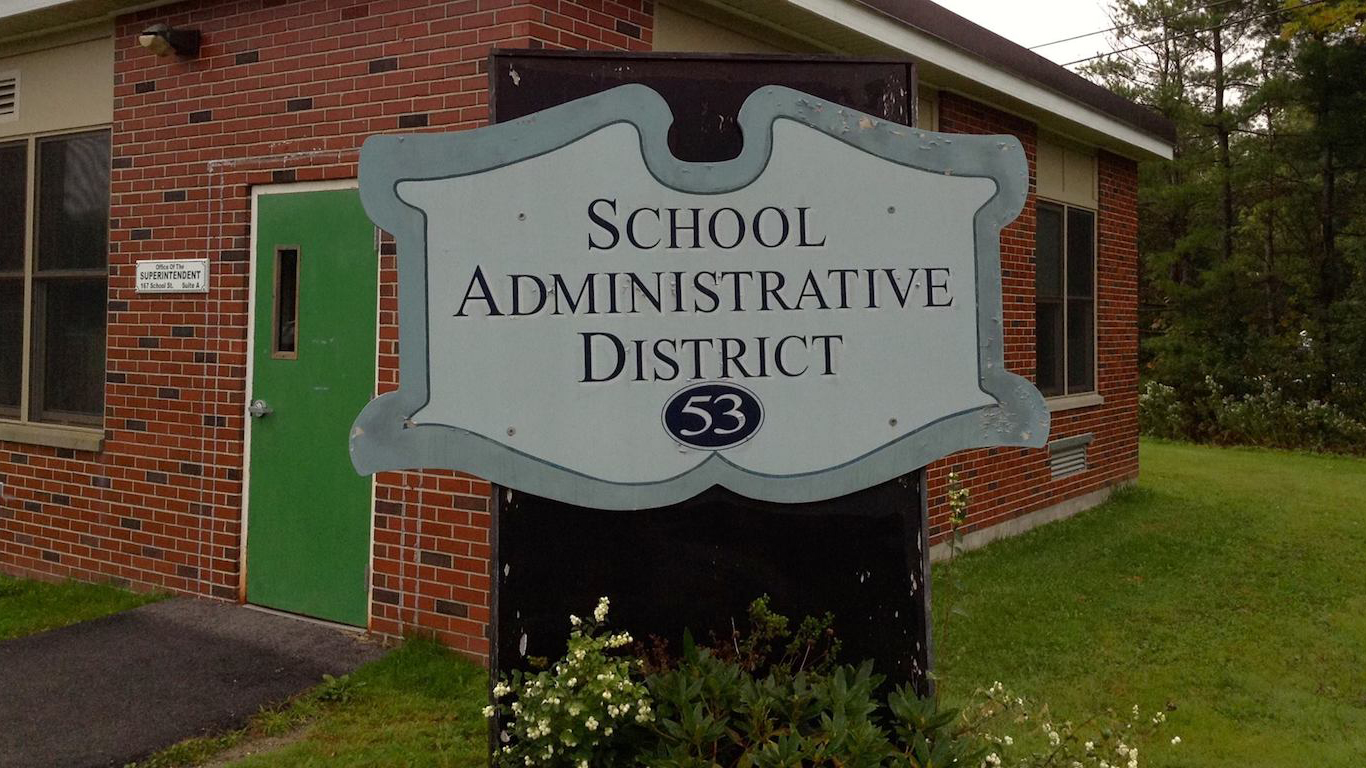
19. Maine
> Worst school district: School Administrative District 53
> Location: Somerset and Waldo County
> Per student spending: $5,211 (total enrollment: 1,055)
> High school graduation rate: N/A
> Adults with a bachelor’s degree: 17.8%
[in-text-ad-2]
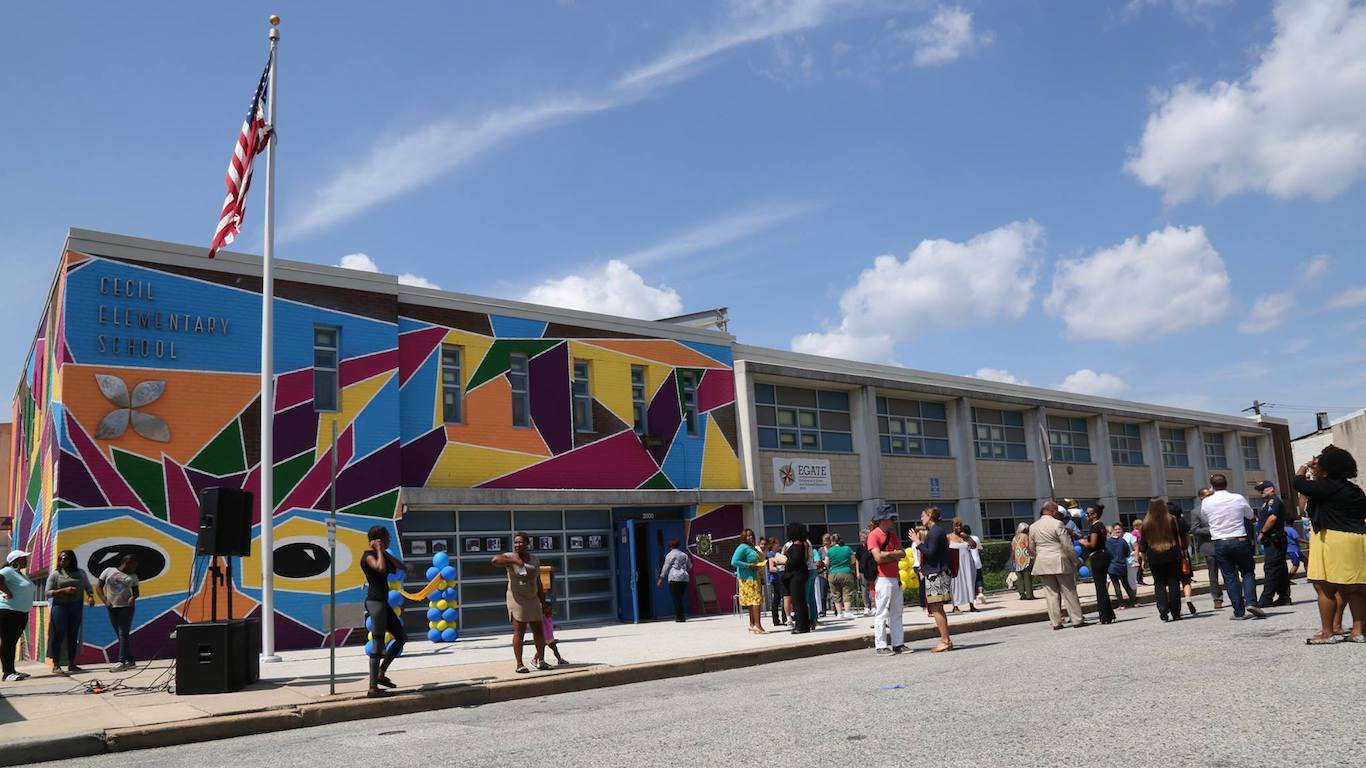
20. Maryland
> Worst school district: Baltimore City Public Schools
> Location: Baltimore city
> Per student spending: $15,818 (total enrollment: 84,976)
> High school graduation rate: 61.2%
> Adults with a bachelor’s degree: 29.7%
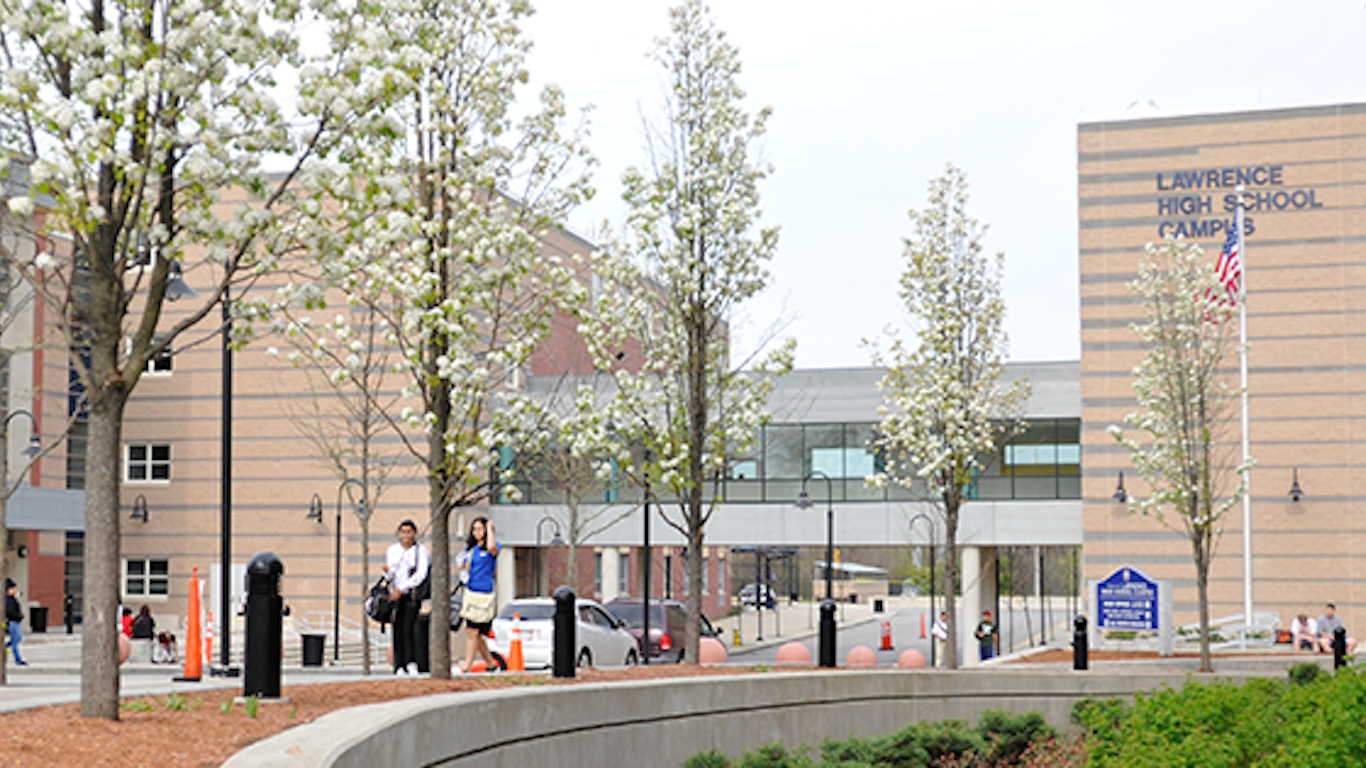
21. Massachusetts
> Worst school district: Lawrence School District
> Location: Essex County
> Per student spending: $15,184 (total enrollment: 13,889)
> High school graduation rate: 50.1%
> Adults with a bachelor’s degree: 11.2%
[in-text-ad]

22. Michigan
> Worst school district: Van Dyke Public Schools
> Location: Macomb County
> Per student spending: $10,952 (total enrollment: 2,719)
> High school graduation rate: 46.2%
> Adults with a bachelor’s degree: 7.6%
[recirclink id=443940]

23. Minnesota
> Worst school district: Red Lake Public School District
> Location: Beltrami and Clearwater County
> Per student spending: $18,752 (total enrollment: 1,515)
> High school graduation rate: 29.3%
> Adults with a bachelor’s degree: 6.6%
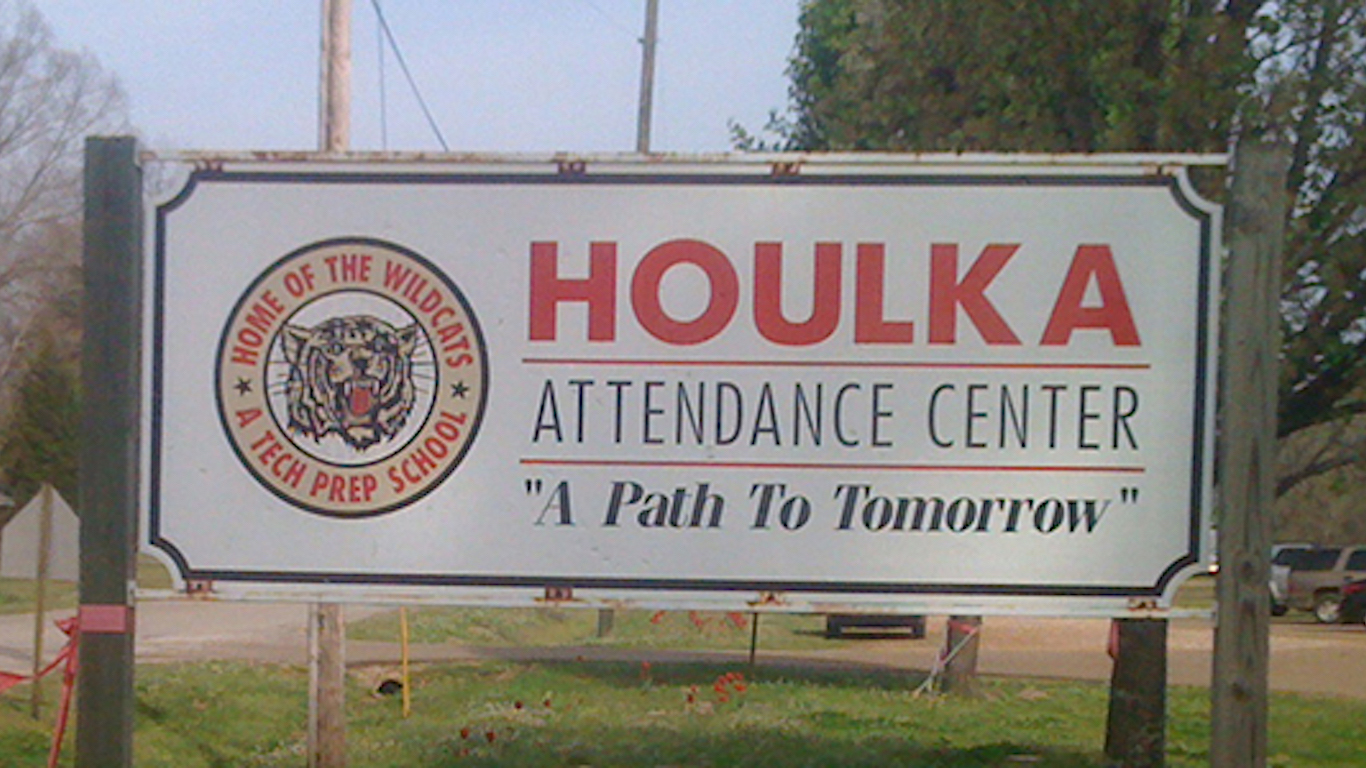
24. Mississippi
> Worst school district: Chickasaw County School District
> Location: Chickasaw County
> Per student spending: $8,218 (total enrollment: 505)
> High school graduation rate: 61.8%
> Adults with a bachelor’s degree: 9.2%
[in-text-ad-2]

25. Missouri
> Worst school district: Bunker R-III School District
> Location: Dent, Reynolds, and Shannon Counties
> Per student spending: $12,101 (total enrollment: 276)
> High school graduation rate: 60.0%
> Adults with a bachelor’s degree: 10.2%

26. Montana
> Worst school district: Hot Springs K-12 Schools
> Location: Lake and Sanders County
> Per student spending: $14,097 (total enrollment: 195)
> High school graduation rate: N/A
> Adults with a bachelor’s degree: 18.1%
[in-text-ad]
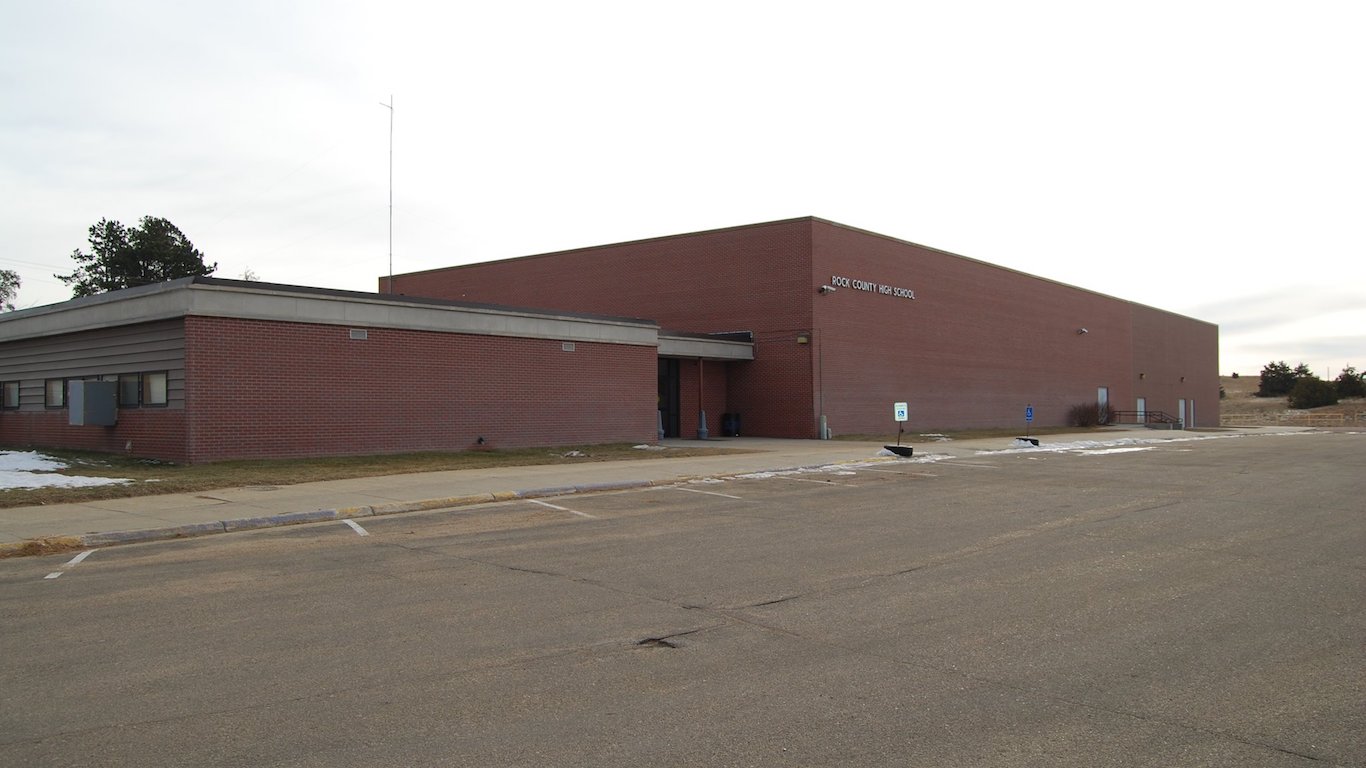
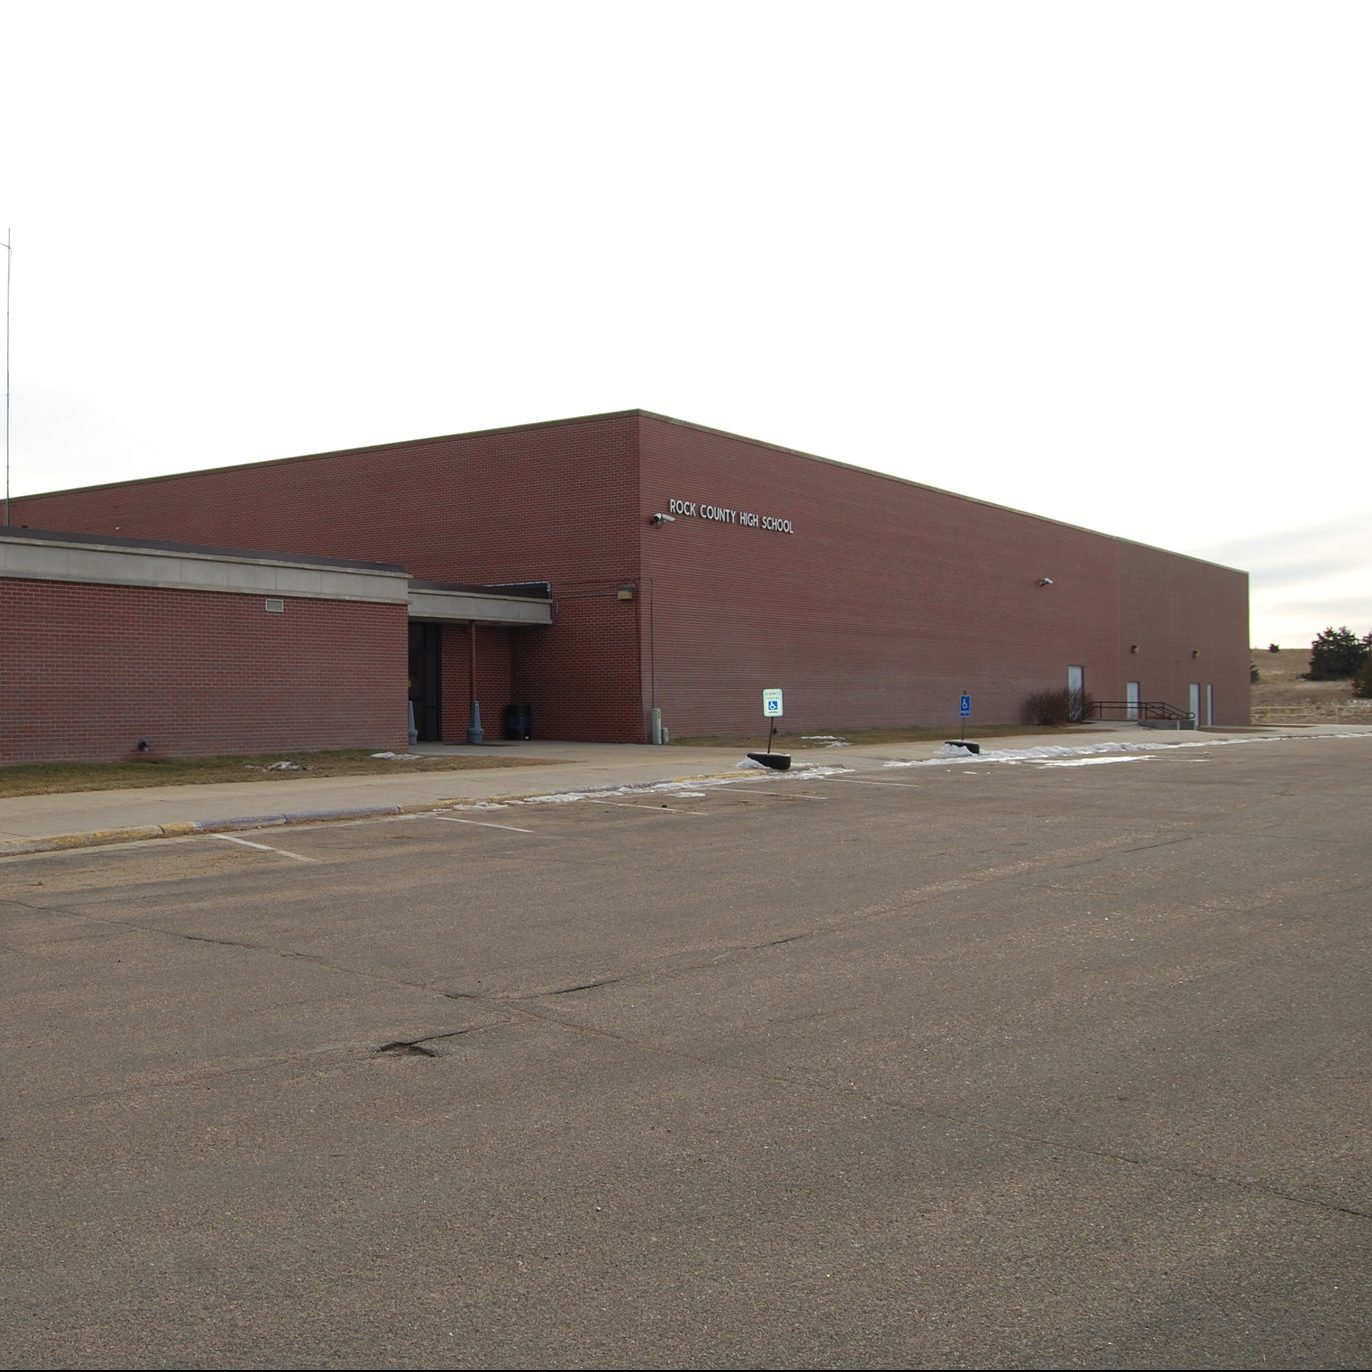
27. Nebraska
> Worst school district: Rock County Public Schools
> Location: Brown and Rock County
> Per student spending: $15,802 (total enrollment: 207)
> High school graduation rate: N/A
> Adults with a bachelor’s degree: 17.5%
[recirclink id=443564]
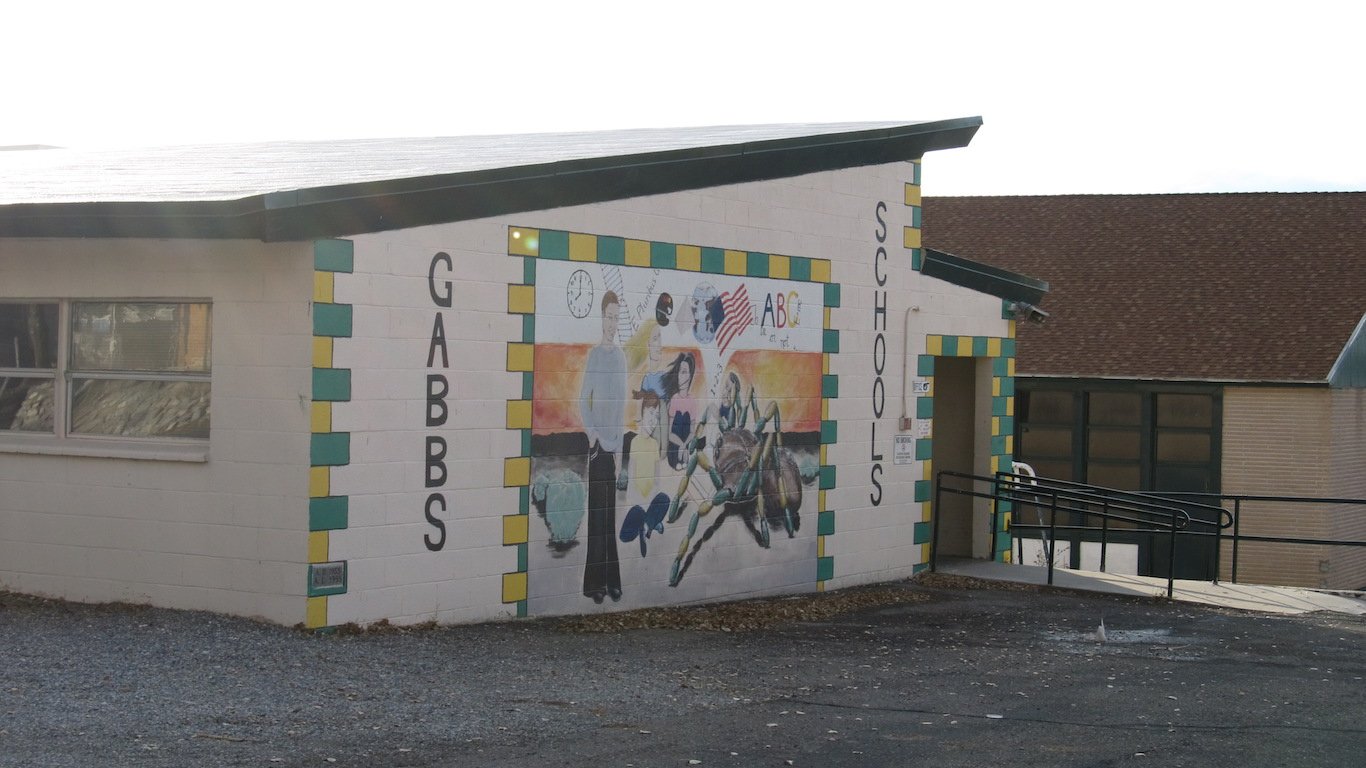
28. Nevada
> Worst school district: Nye County School District
> Location: Nye County
> Per student spending: $10,960 (total enrollment: 5,168)
> High school graduation rate: 40.0%
> Adults with a bachelor’s degree: 12.1%

29. New Hampshire
> Worst school district: Pittsfield School District
> Location: Merrimack County
> Per student spending: $17,500 (total enrollment: 594)
> High school graduation rate: 72.9%
> Adults with a bachelor’s degree: 20.8%
[in-text-ad-2]

30. New Jersey
> Worst school district: Camden City School District
> Location: Camden County
> Per student spending: $23,255 (total enrollment: 11,320)
> High school graduation rate: 47.7%
> Adults with a bachelor’s degree: 8.2%
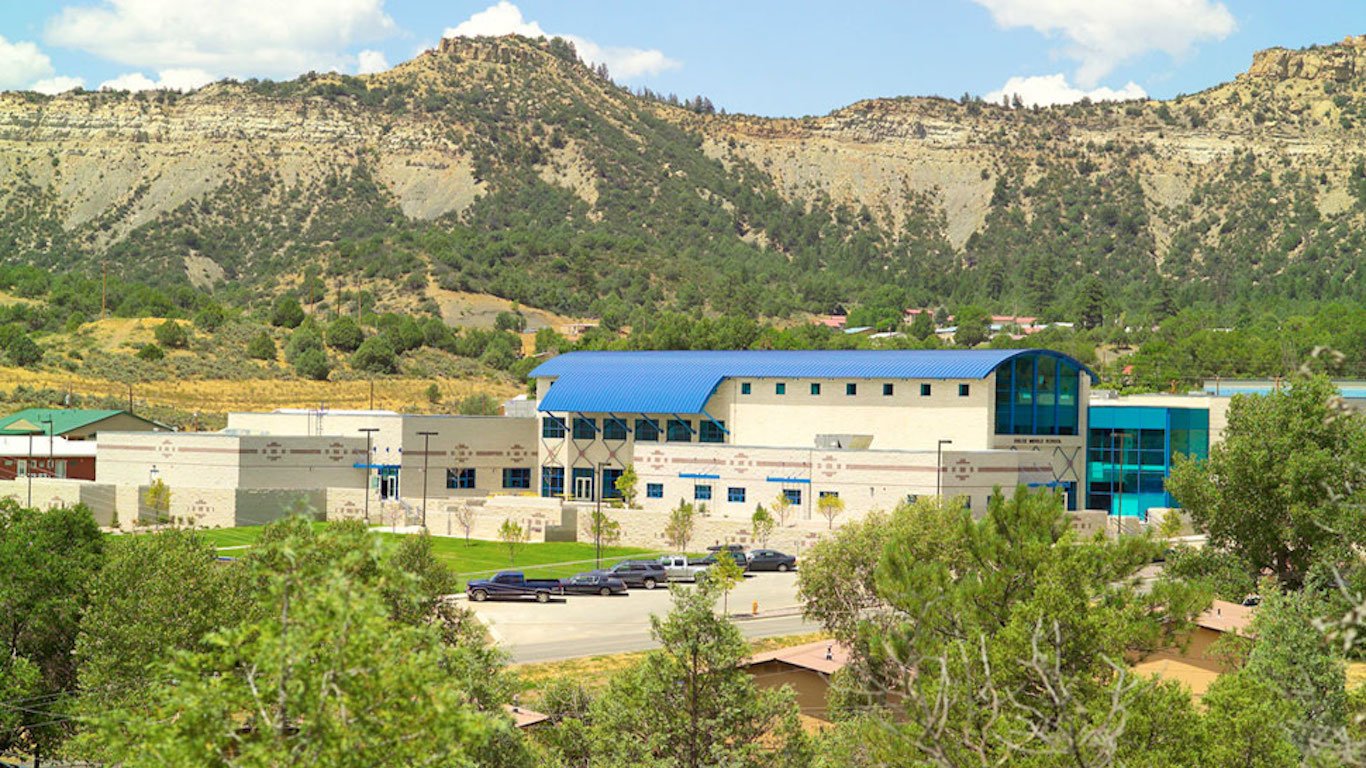
31. New Mexico
> Worst school district: Dulce Independent Schools
> Location: Rio Arriba County
> Per student spending: $14,269 (total enrollment: 696)
> High school graduation rate: 27.9%
> Adults with a bachelor’s degree: 9.2%
Editor’s Note: Because of inaccuracies possibly due to migration, district boundary changes, school attendance area changes, or other technical factors, a previous version of this article incorrectly identified Lake Arthur Municipal Schools as the worst school district in New Mexico. The error has been corrected.
[in-text-ad]

32. New York
> Worst school district: Fort Edward Union Free School District
> Location: Washington County
> Per student spending: $16,152 (total enrollment: 571)
> High school graduation rate: 62.2%
> Adults with a bachelor’s degree: 11.7%
[recirclink id=443882]
33. North Carolina
> Worst school district: Tyrrell County Schools
> Location: Tyrrell County
> Per student spending: $14,581 (total enrollment: 594)
> High school graduation rate: 83.6%
> Adults with a bachelor’s degree: 8.2%
34. North Dakota
> Worst school district: Warwick Public School District 29
> Location: Benson, Eddy, and Ramsey Counties
> Per student spending: $17,278 (total enrollment: 248)
> High school graduation rate: 50.0%
> Adults with a bachelor’s degree: 15.5%
[in-text-ad-2]
35. Ohio
> Worst school district: Youngstown City School District
> Location: Mahoning and Trumbull County
> Per student spending: $12,878 (total enrollment: 5,281)
> High school graduation rate: 45.1%
> Adults with a bachelor’s degree: 12.1%
36. Oklahoma
> Worst school district: Graham-Dustin Public Schools
> Location: Hughes, McIntosh, Okfuskee, and Okmulgee Counties
> Per student spending: $13,482 (total enrollment: 168)
> High school graduation rate: N/A
> Adults with a bachelor’s degree: 8.9%
[in-text-ad]

37. Oregon
> Worst school district: Huntington School District 16J
> Location: Baker and Malheur County
> Per student spending: $20,734 (total enrollment: 64)
> High school graduation rate: N/A
> Adults with a bachelor’s degree: 7.4%
[recirclink id=443620]

38. Pennsylvania
> Worst school district: Reading School District
> Location: Berks County
> Per student spending: $10,151 (total enrollment: 17,303)
> High school graduation rate: 61.7%
> Adults with a bachelor’s degree: 9.2%
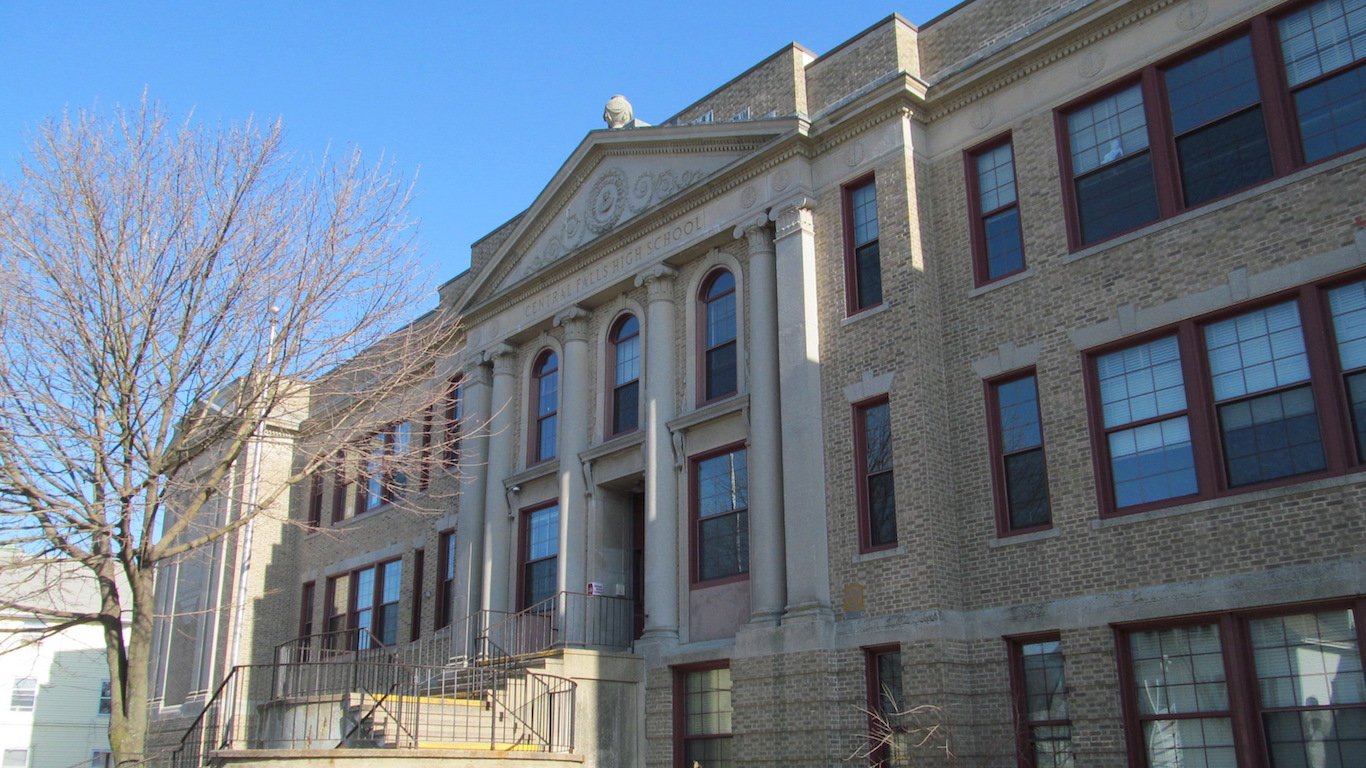
39. Rhode Island
> Worst school district: Central Falls School District
> Location: Providence County
> Per student spending: $16,076 (total enrollment: 2,683)
> High school graduation rate: 56.5%
> Adults with a bachelor’s degree: 8.7%
[in-text-ad-2]
40. South Carolina
> Worst school district: Hampton School District 2
> Location: Hampton County
> Per student spending: $13,656 (total enrollment: 815)
> High school graduation rate: 56.0%
> Adults with a bachelor’s degree: 8.2%

41. South Dakota
> Worst school district: Todd County School District 66-1
> Location: Todd County
> Per student spending: $12,062 (total enrollment: 2,044)
> High school graduation rate: 36.5%
> Adults with a bachelor’s degree: 15.7%
[in-text-ad]
42. Tennessee
> Worst school district: Hollow Rock-Bruceton Special School District
> Location: Carroll County
> Per student spending: $7,567 (total enrollment: 651)
> High school graduation rate: 81.1%
> Adults with a bachelor’s degree: 7.6%
[recirclink id=443575]
43. Texas
> Worst school district: Gholson Independent School District
> Location: McLennan County
> Per student spending: $8,141 (total enrollment: 248)
> High school graduation rate: N/A
> Adults with a bachelor’s degree: 10.6%
44. Utah
> Worst school district: Duchesne School District
> Location: Duchesne County
> Per student spending: $6,939 (total enrollment: 5,284)
> High school graduation rate: 65.7%
> Adults with a bachelor’s degree: 14.1%
[in-text-ad-2]

45. Vermont
> Worst school district: Blue Mountain Union School District 21
> Location: Caledonia and Orange County
> Per student spending: $19,060 (total enrollment: 399)
> High school graduation rate: 87.2%
> Adults with a bachelor’s degree: 22.6%
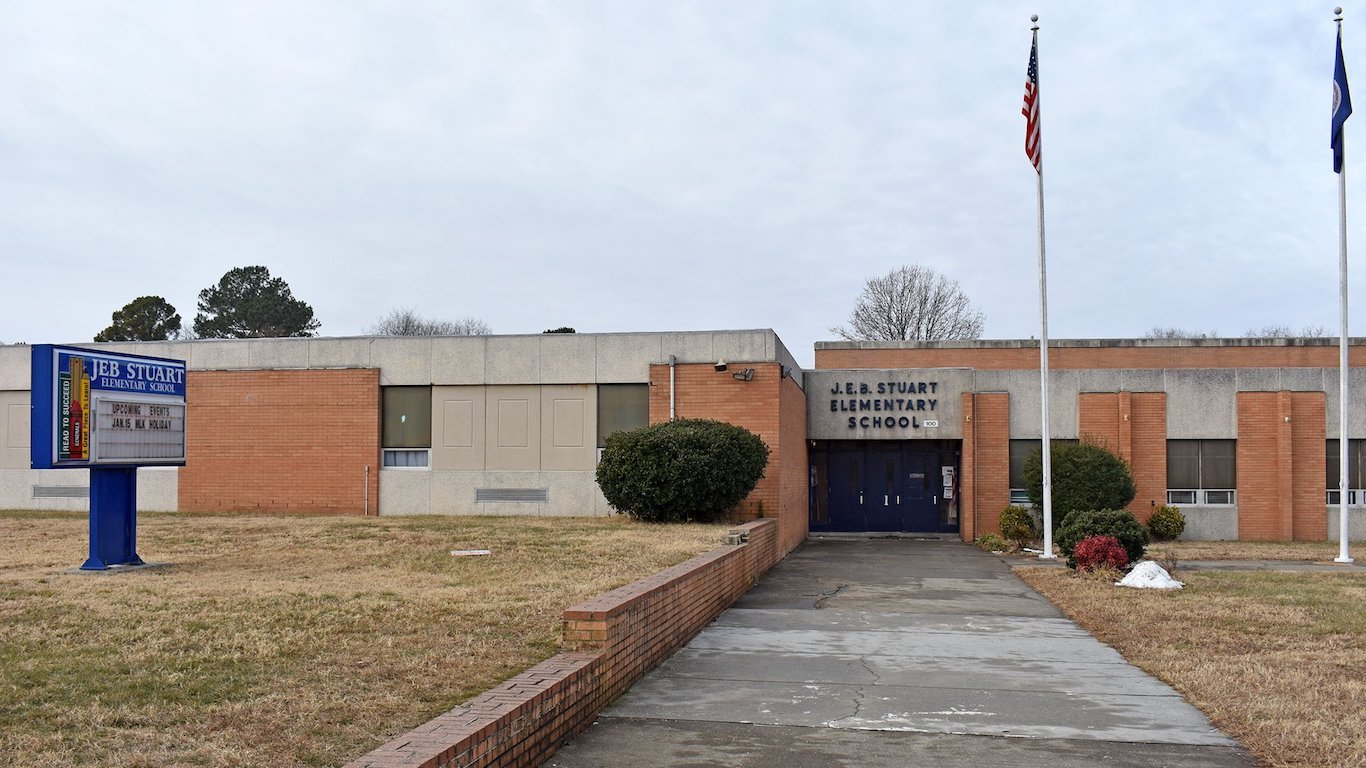
46. Virginia
> Worst school district: Petersburg City Public Schools
> Location: Petersburg city
> Per student spending: $11,205 (total enrollment: 4,318)
> High school graduation rate: 61.8%
> Adults with a bachelor’s degree: 16.6%
[in-text-ad]
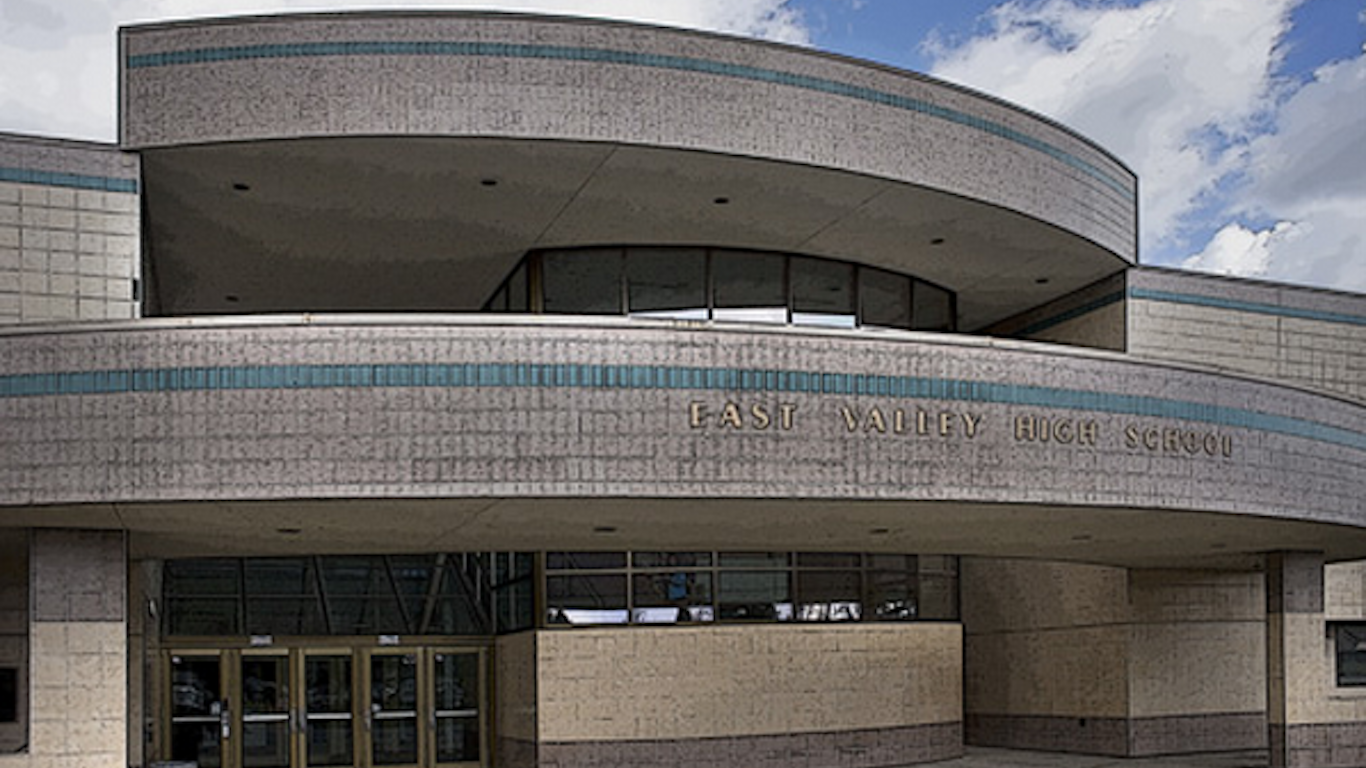
47. Washington
> Worst school district: Valley School District
> Location: Stevens County
> Per student spending: $12,394 (total enrollment: 688)
> High school graduation rate: N/A
> Adults with a bachelor’s degree: 14.1%
[recirclink id=443188]
48. West Virginia
> Worst school district: McDowell County School District
> Location: McDowell County
> Per student spending: $13,247 (total enrollment: 3,417)
> High school graduation rate: 75.3%
> Adults with a bachelor’s degree: 5.2%

49. Wisconsin
> Worst school district: Granton Area School District
> Location: Clark County
> Per student spending: $13,122 (total enrollment: 238)
> High school graduation rate: 83.9%
> Adults with a bachelor’s degree: 9.3%
Editor’s Note: Because of inaccuracies possibly due to migration, district boundary changes, school attendance area changes, or other technical factors, a previous version of this article incorrectly identified Goodman-Armstrong School District as the worst school district in Wisconsin. The error has been corrected.
[in-text-ad-2]
50. Wyoming
> Worst school district: Laramie County School District 2
> Location: Laramie County
> Per student spending: $18,778 (total enrollment: 987)
> High school graduation rate: 76.9%
> Adults with a bachelor’s degree: 17.7%
Detailed Findings & Methodology
Approximately 43% of school funding comes from state governments. Just as the quality of school districts vary heavily within a state, the quality of state education systems vary heavily across the country. In a report provided by Education Week ranking statewide education systems, states such as Massachusetts, New Jersey, and New York rank as some of the states with the best schools. Meanwhile, states such as Texas, California, Arizona, and Alabama rank towards the bottom.
Of the top 100 ranked school districts in the country, 29 are in New York, 18 are in New Jersey, 14 are in Ohio, and 11 are in Massachusetts. Of the 100 worst ranked school districts, 11 are in Texas, eight are in California, and Maine, Arizona, and Alabama are each home to six.
School spending contributes to better student outcomes, and is one of the largest contributors to the disparity in academic success across the country. With greater funding, schools can afford better teachers, state-of-the-art educational technology, and other resources that help students succeed. In 34 of the 50 school districts with the highest per-pupil spending, the graduation rate is above the 78.2% national figure. In 12 of the 50 districts with lowest spending, the graduation rate is below the national value.
While school spending, the availability of AP classes, and preschool enrollment can all contribute to student success and determine the level of quality of a school district, certain socioeconomic factors also play a major role. Two factors included in the index — child poverty rate and adult college attainment rate — have a major impact on the likelihood of a student’s success in school.
Educated parents are more likely to read to their children, and enhance their children’s development by exposing them to more complex speech patterns and a broader vocabulary. Of the 50 districts with the largest shares of adults with a bachelor’s degree, 49 have graduation rates above the national rate.
Family income may have the largest direct impact on a student’s academic outcomes. Parents with greater financial resources have the ability to move to more expensive communities with better schools. They can also afford resources to better their child’s education such as tutoring and other extracurricular activities.
Of the 50 districts with the highest child poverty rate — the share of children aged 5 to 17 living with their family who are in poverty — 37 have lower graduation rates than the nation as a whole. All of the 50 districts with the smallest shares of children living in poverty have graduation rates above the national rate, and 17 have graduations rates of 100%.
To determine the worst school district in every state, 24/7 Wall St. developed an index based on various socioeconomic measures, school finance, student success, and environmental factors. The share of children aged 5 to 17 living with their family who are in poverty as of 2016 came from the U.S. Census Bureau’s Small Area Income and Poverty Estimates program and was included in the index. Per-pupil expenditure for 2015 came from the Census Bureau’s Annual Survey of School System Finances and was included in the index. The percentage of high school students who graduated on time in the 2009-10 school year came from the National Center for Education Statistics and was included in the index. The number of teachers per student in the 2015-16 school year also came from the NCES and was included in the index. The share of adults aged 25 and over with at least a bachelor’s degree and the share of 3 and 4 year-olds enrolled in school came from the Census Bureau’s 2016 American Community Survey and were included in the index. Additionally, the share of high school students enrolled in AP classes in 2013 came from the U.S. Department of Education’s Civil Rights Data Collection and was included in the index. All data are for the most recent period available.
Contact [email protected] for any questions or corrections.