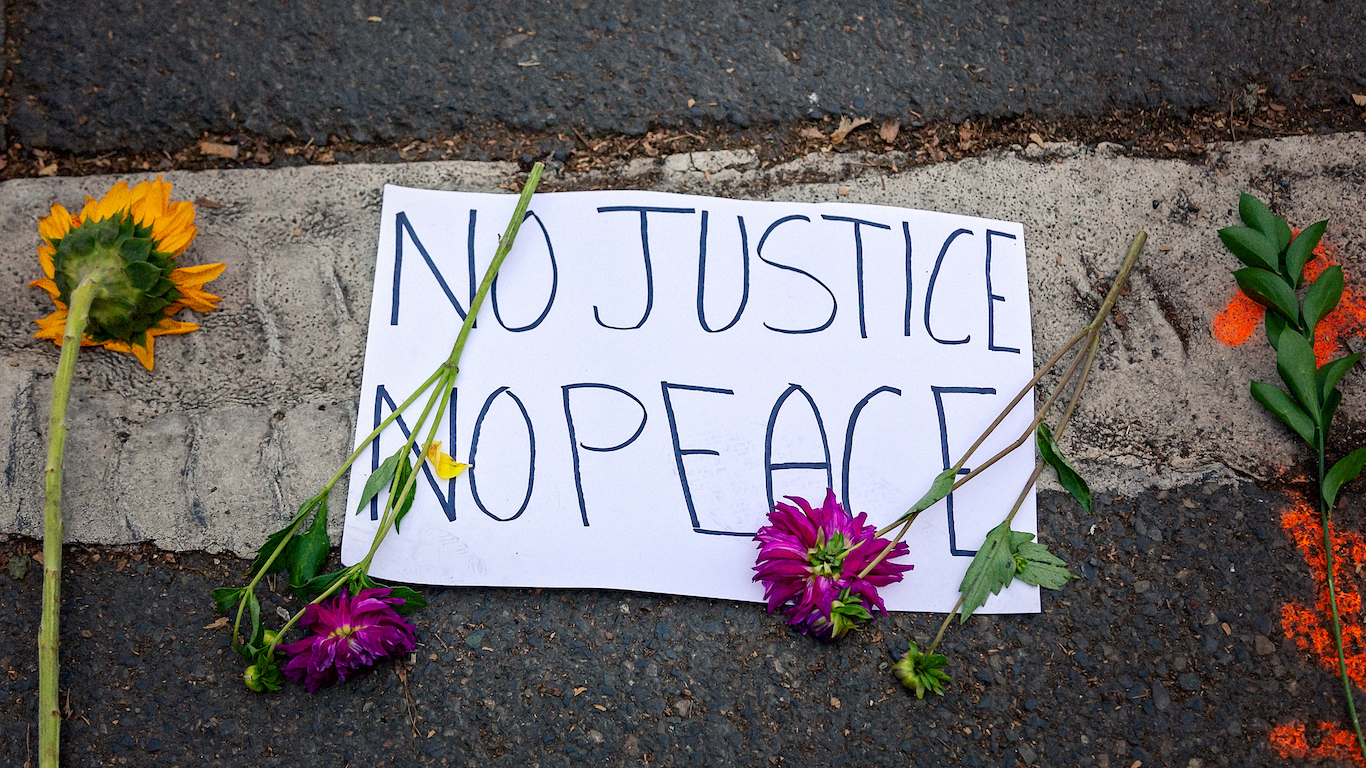
Nationwide, the typical black household earns just 61 cents for every dollar the typical white household earns. Despite the achievements of the Civil Rights Movement more than five decades ago, there exist substantial inequalities along racial lines in America.
Lower incomes, educational attainment, and homeownership among black Americans, as well as higher poverty, unemployment, incarceration, and mortality all contribute to racial inequality in the United States. In some of America’s largest metro areas, discriminatory policy, racial bias, and a history of oppression have deepened such inequalities and widened the gap among black and white residents in a variety of socioeconomic measures.
To determine the worst cities for black Americans, 24/7 Wall St. created an index based on disparities in each city between black and white residents in various socioeconomic measures. Many of the cities with the worst racial inequalities are in the Midwest and Northeast.
Click here to see the full list of the worst cities for black Americans.
Click here to see our detailed findings and methodology.
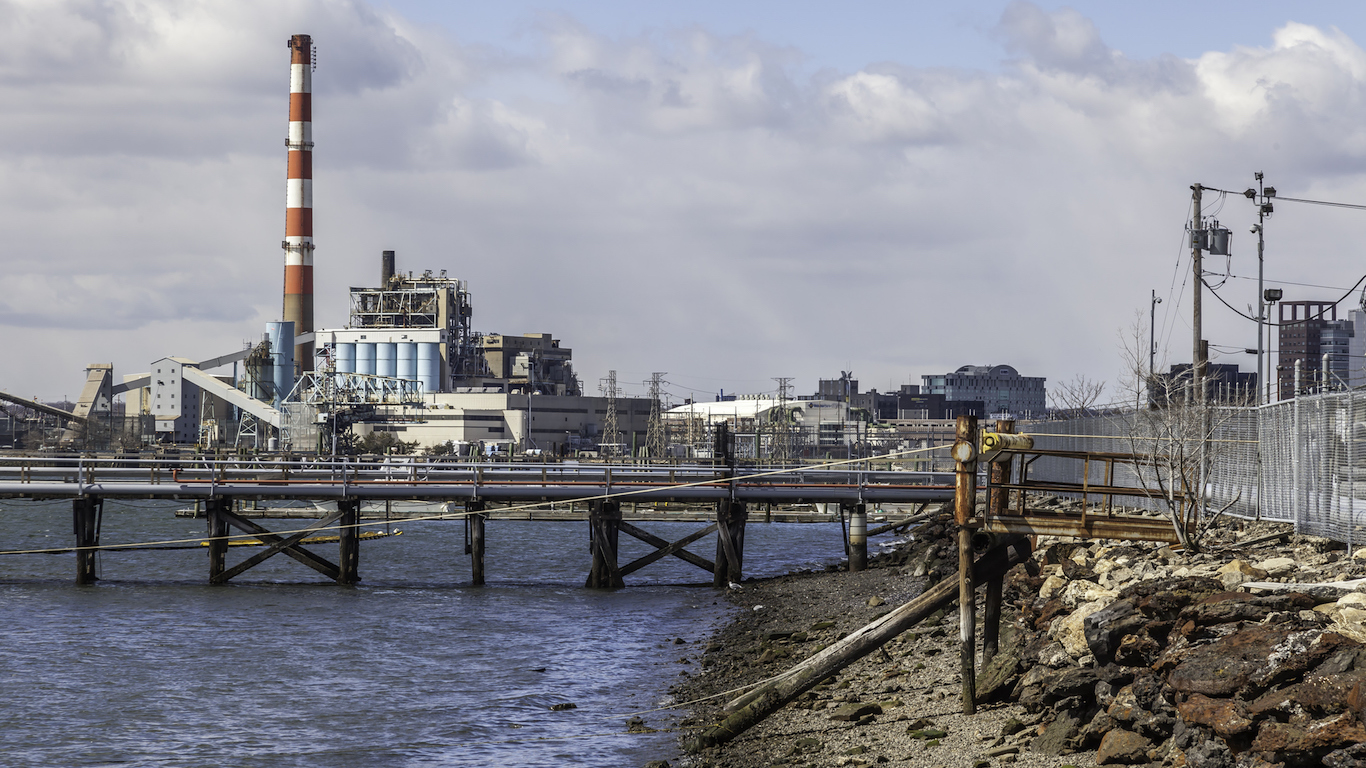
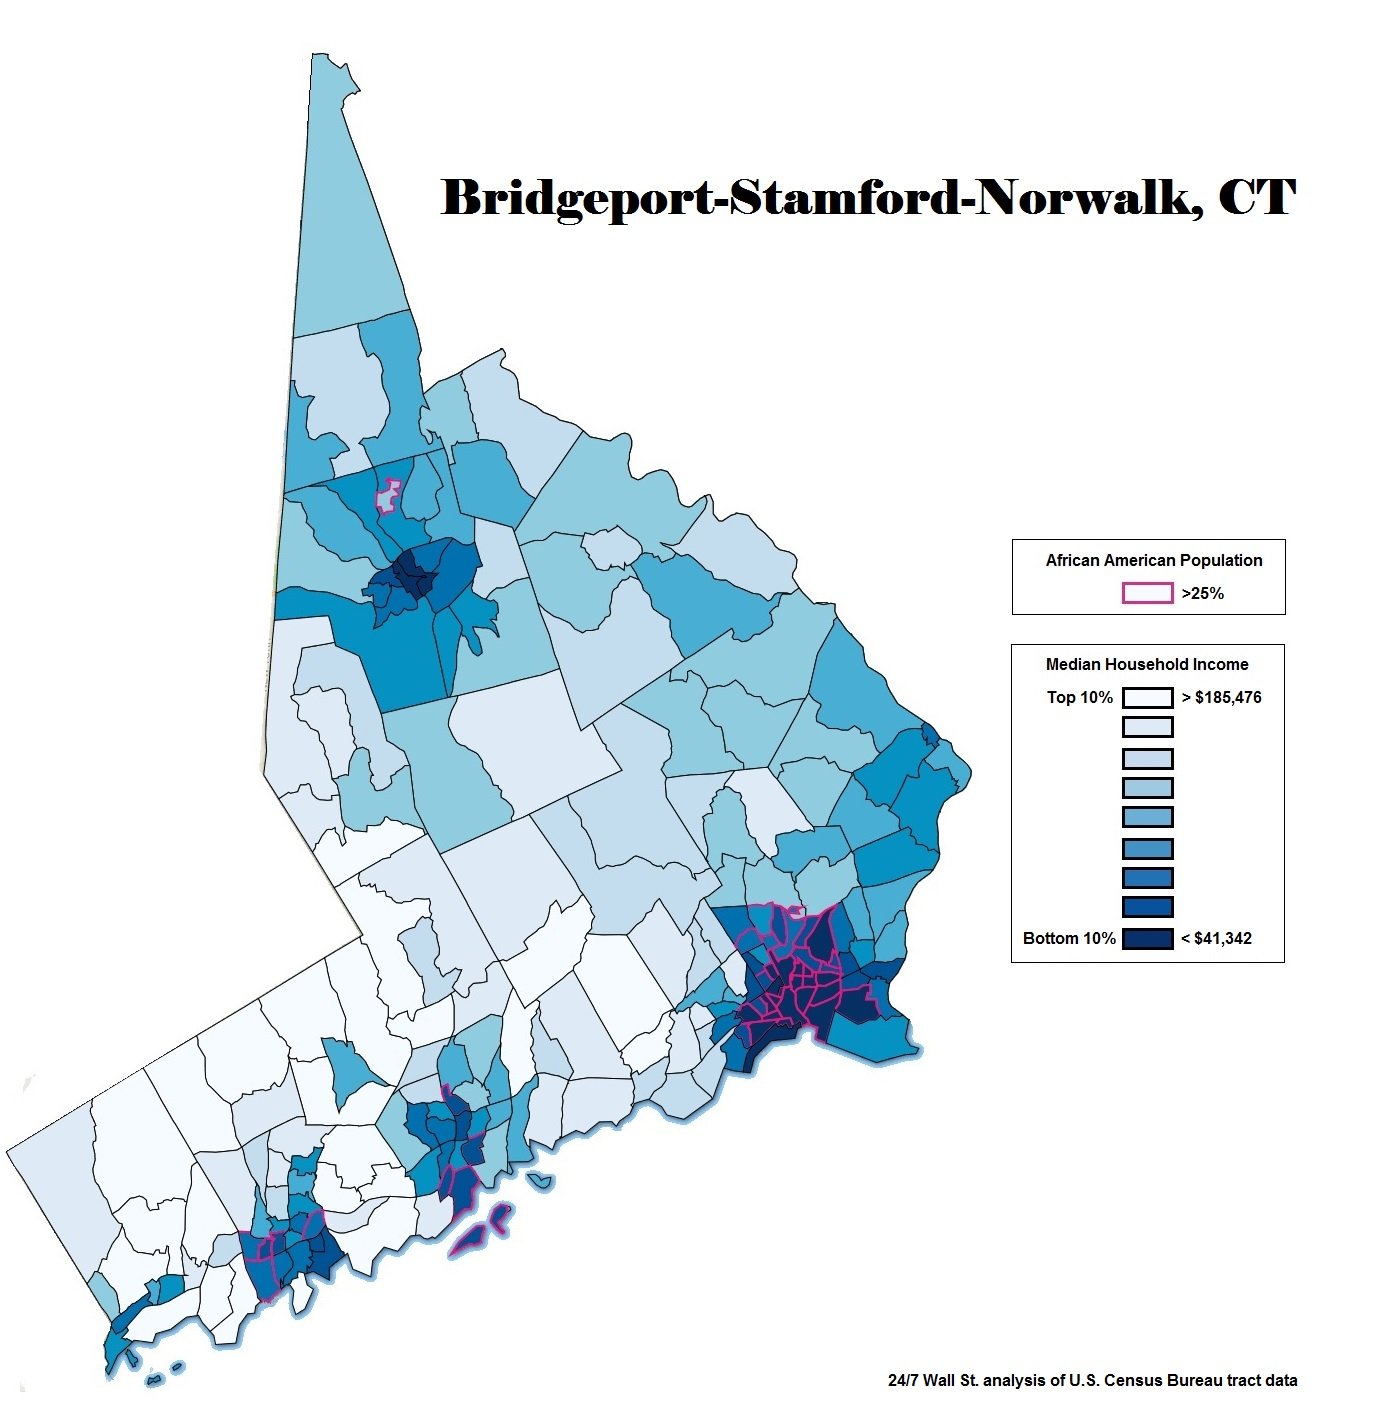
10. Bridgeport-Stamford-Norwalk, CT
> Black population: 11.2%
> Black median income: 40.1% of white income
> White unemployment: 4.2%
> Black unemployment: 14.4%
The typical black household in the Bridgeport metro area earns just 40 cents for every dollar a typical white household earns, one of the greatest earnings gaps of any city. The typical Black household in Bridgeport earns $43,336 a year, more than the median for black households nationwide of $38,555 but just a fraction of the median for white households in the city of $108,067.
[in-text-ad]
Click image to enlarge
The racial income gap in Bridgeport is likely reinforced by the discrepancy in educational attainment among black and white residents in the city. An estimated 19.5% of black adults in the metro area currently hold a bachelor’s degree, far less than the 56.3% of white adults in the city who do. The difference of nearly 37 percentage points is the largest disparity in college education between blacks and whites of any U.S. metro area.
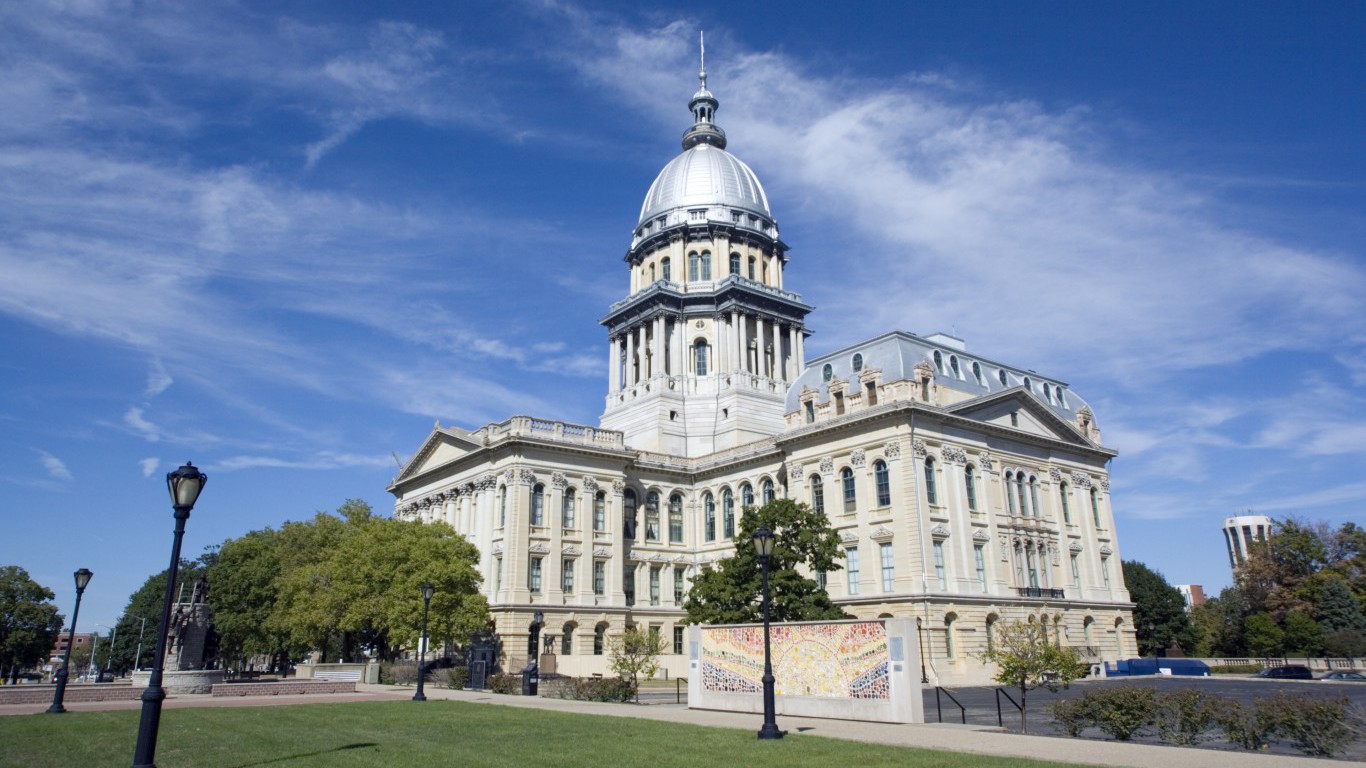
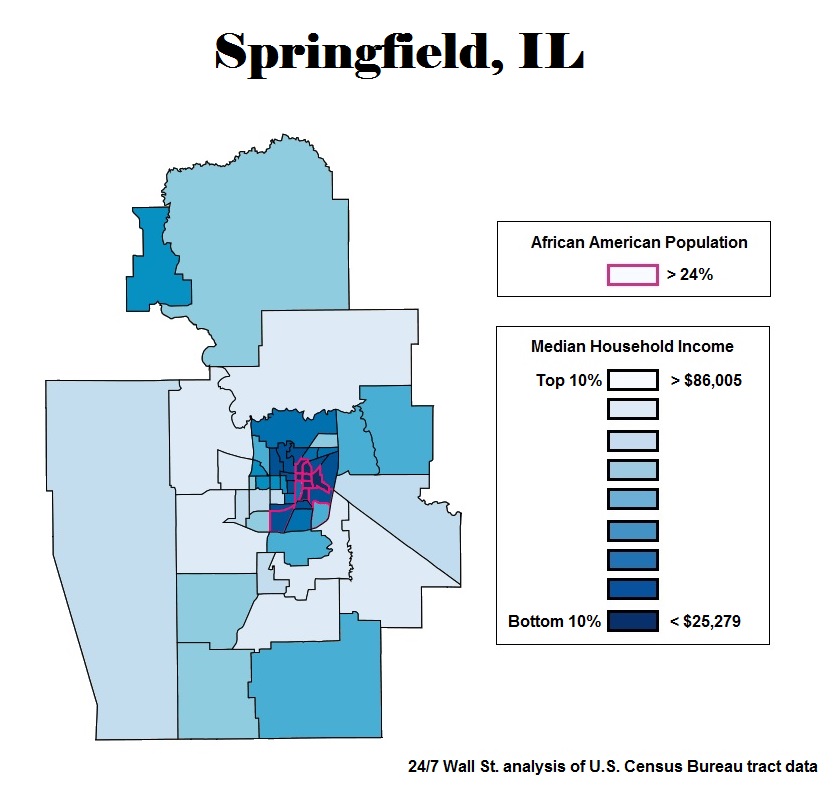
9. Springfield, IL
> Black population: 11.8%
> Black median income: 44.7% of white income
> White unemployment: 5.0%
> Black unemployment: 16.8%
Springfield has one of the largest gaps in white and black poverty of any metro area. While less than 1 in 10 white residents in the city live below the poverty line, more than 4 in 10 black residents do. One factor contributing to the poverty gap is likely the relative difficulty in finding a job as a minority in Springfield. An estimated 16.8% of the black labor force is unemployed, more than three times the white unemployment rate of 5.0%.
Click image to enlarge
Income is closely tied to health outcomes, and unsurprisingly, in an area with such high income inequality along racial lines, there are also very uneven health outcomes. The difference in age-adjusted premature mortality rate among black Springfield residents compared to their white neighbors is nearly the highest of any metropolitan area.
[recirclink id=420229]
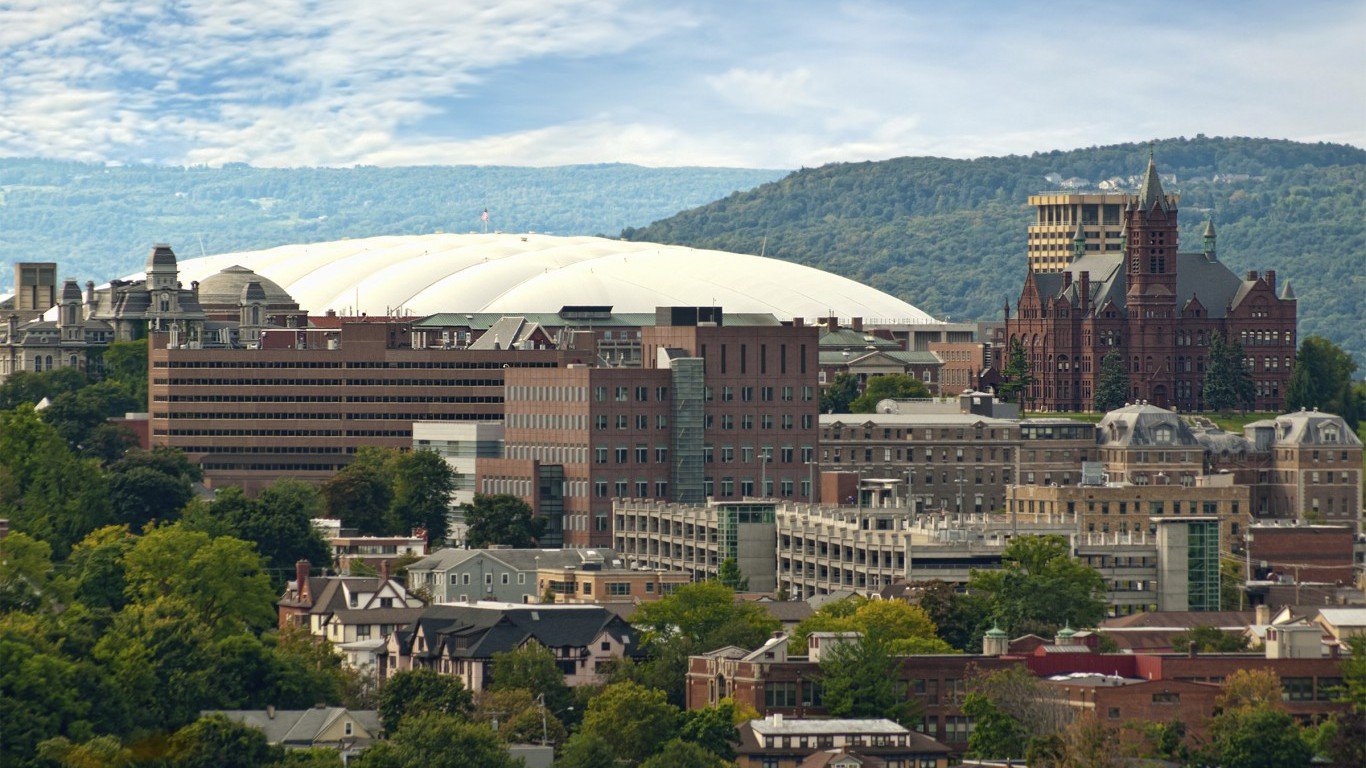
8. Syracuse, NY
> Black population: 8.3%
> Black median income: 44.2% of white income
> White unemployment: 4.4%
> Black unemployment: 15.0%
Syracuse has one of the largest racial poverty gaps of any metro area. An estimated 39.9% of black residents live below the poverty line, far more than the 11.0% of white residents who do. The difference of nearly 29 percentage points is more than twice as large as the comparable gap nationwide. Similar disparities in education and unemployment exist in the city.

Click image to enlarge
Poverty and its consequences are often exacerbated by a high concentration of poor residents in impoverished neighborhoods, where access to education and employment opportunities are limited. In Syracuse, the poorest and wealthiest parts of the city are physically separated by I-81, an elevated highway running through the center of the city that was completed in the mid-1960s.
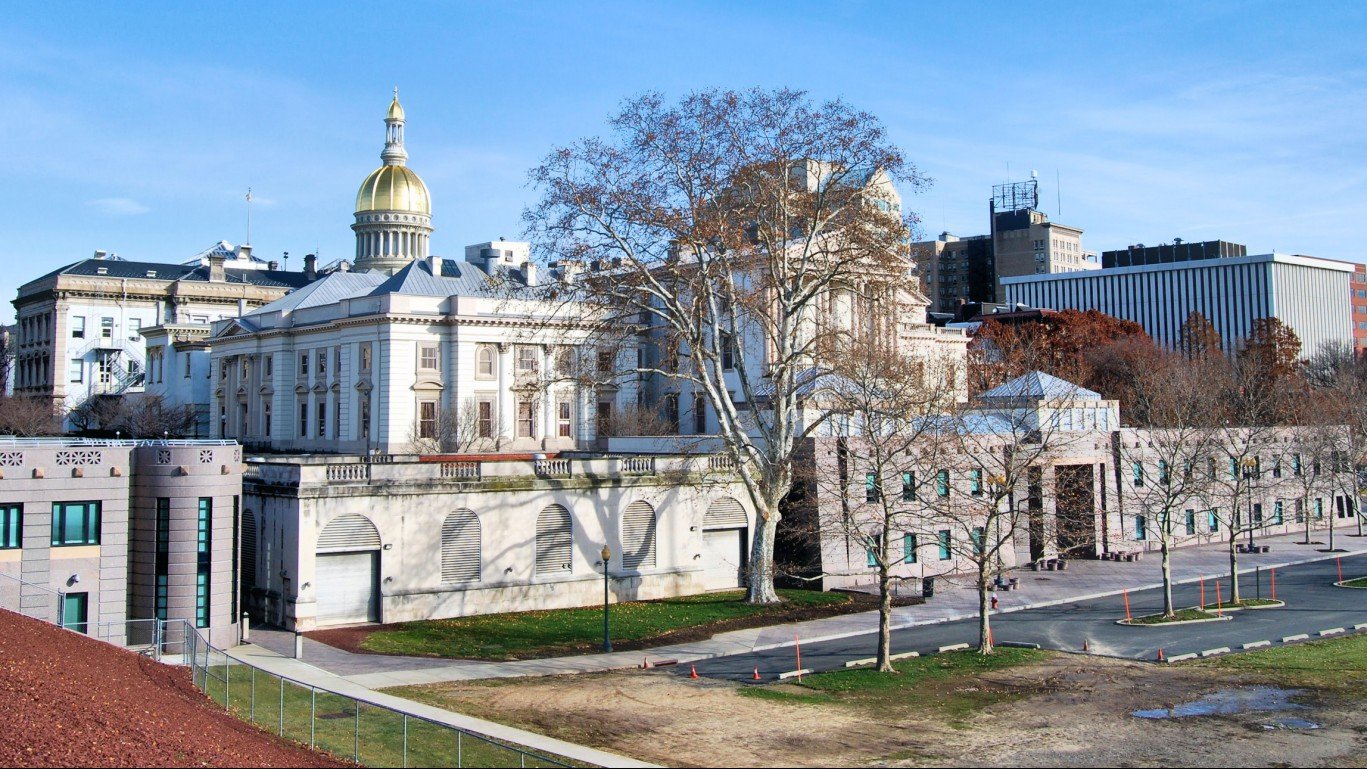
7. Trenton, NJ
> Black population: 20.1%
> Black median income: 44.2% of white income
> White unemployment: 4.5%
> Black unemployment: 13.8%
New Jersey has the largest gap between blacks and whites in incarceration of any state. While less than 100 in 100,000 white state residents are incarcerated, more than 1,000 in 100,000 black residents are. Similar disparities in education and unemployment also exist in the city. Just 20.2% of black adults in Trenton have a bachelor’s degree, far less than the 49.9% of white adults who do. Similarly, 13.8% of black workers are unemployed, nearly three times the white unemployment rate of 4.5%.
[in-text-ad-2]
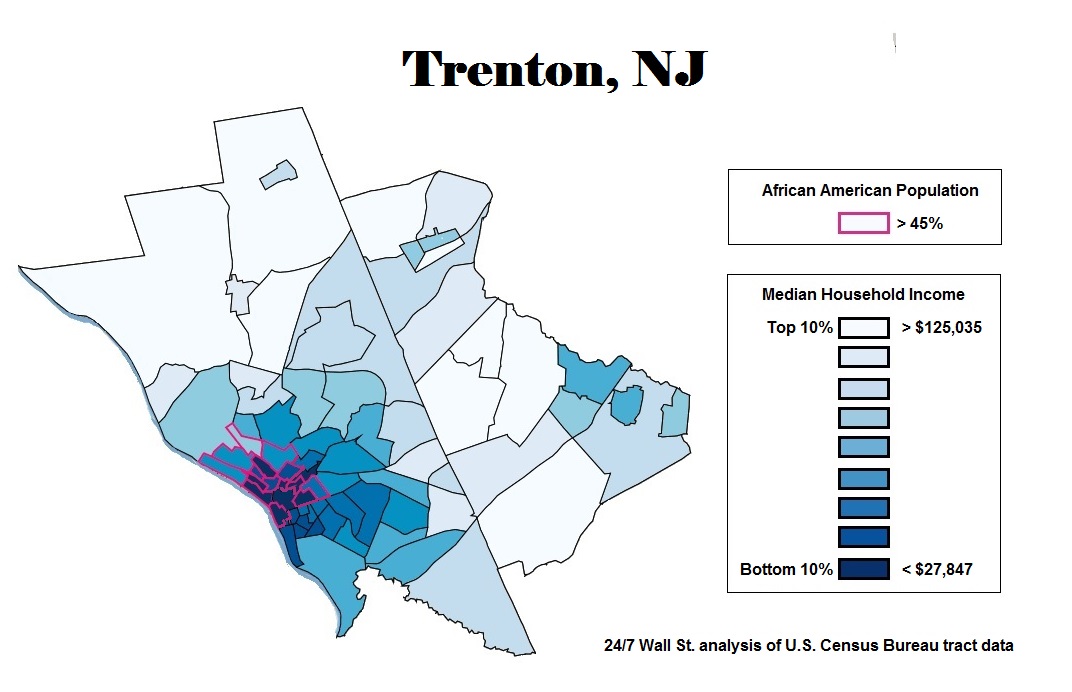
Click image to enlarge
Disparities in education, unemployment, and incarceration likely contribute to a divide in earnings along racial lines in Trenton. The typical black household earns just 44 cents for every dollar a typical white household earns, one of the largest income gaps in the country.

6. Minneapolis-St. Paul-Bloomington, MN-WI
> Black population: 7.4%
> Black median income: 44.0% of white income
> White unemployment: 2.8%
> Black unemployment: 9.5%
Black residents in Minneapolis are not particularly impoverished compared to black residents in other metropolitan areas. The typical black household earns $34,720 a year, compared to the national median black household income of $38,555. However, while they typically do not face the same level of poverty compared to black residents elsewhere, they live in one of the most unequal places. The typical white household earns more than double the income at $78,864 a year.
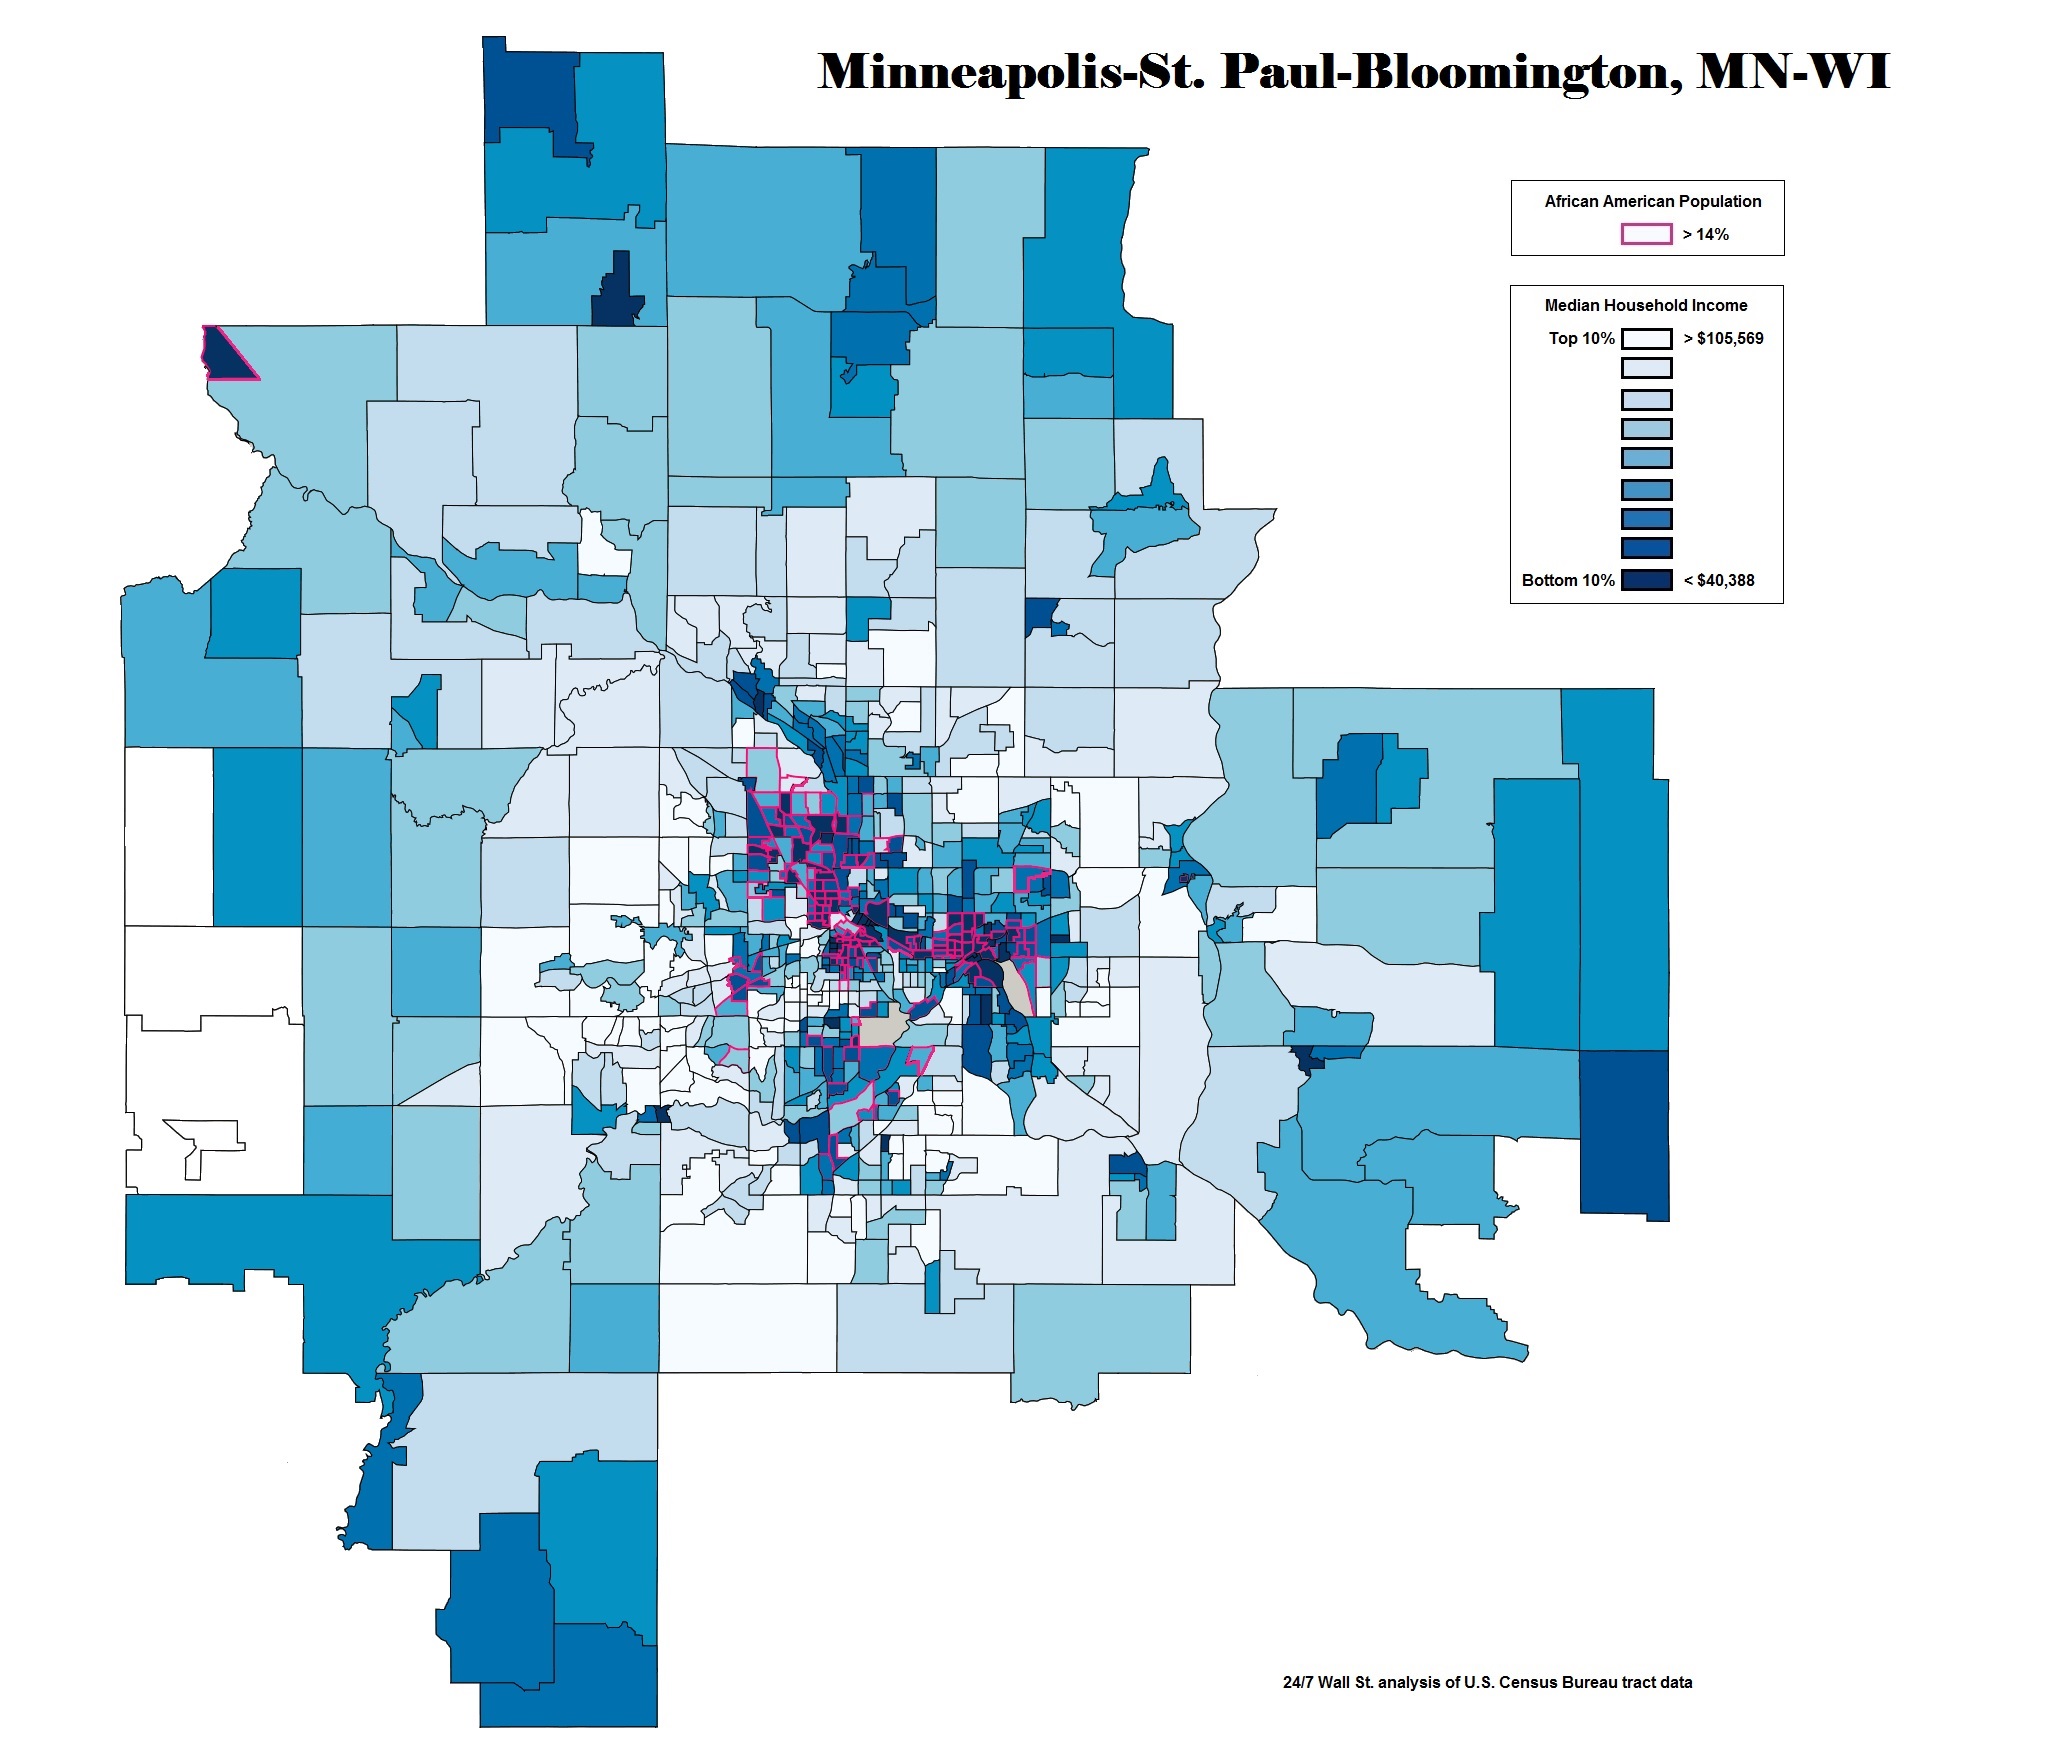
Click image to enlarge
Owning property is often a sign of wealth and economic stability, and the city’s income inequality is reflected in the differences in homeownership. The homeownership among white residents is 46%, compared to a less than 14% black homeownership rate.
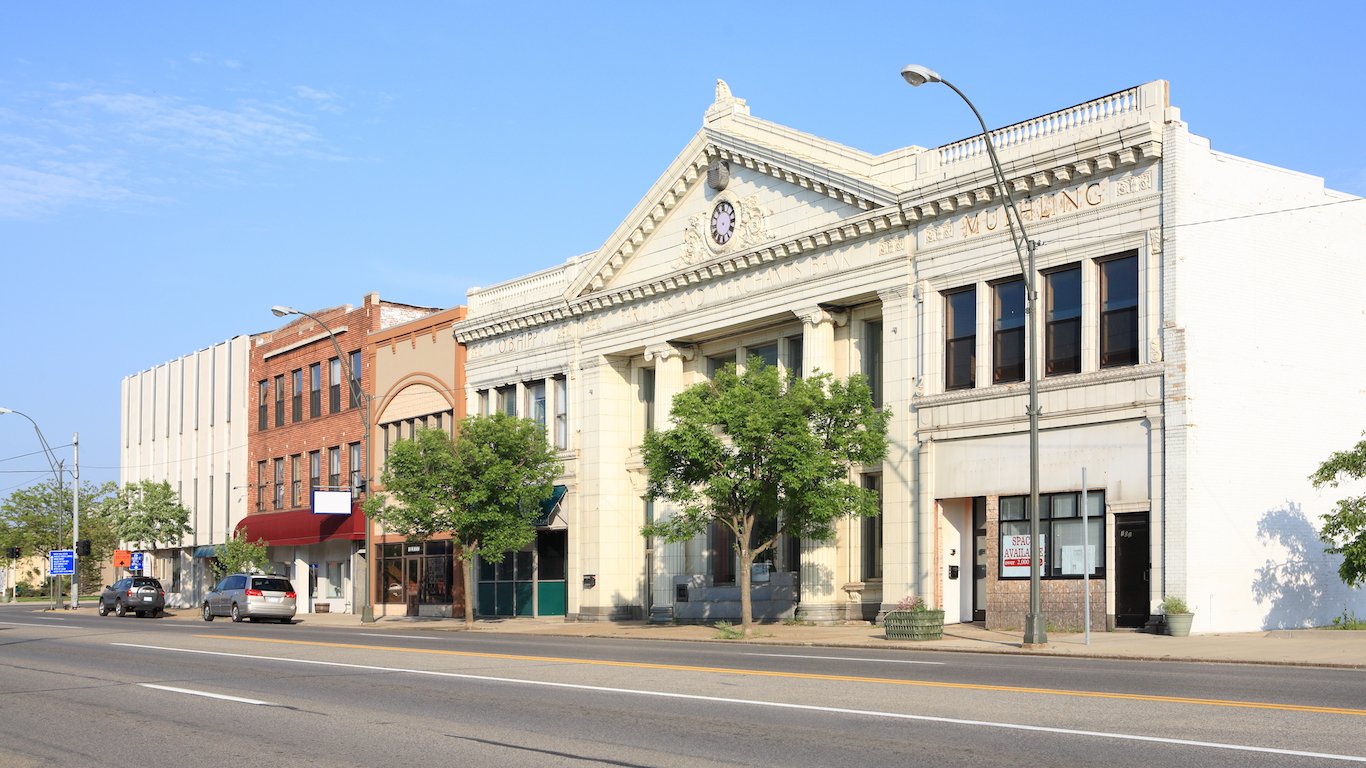
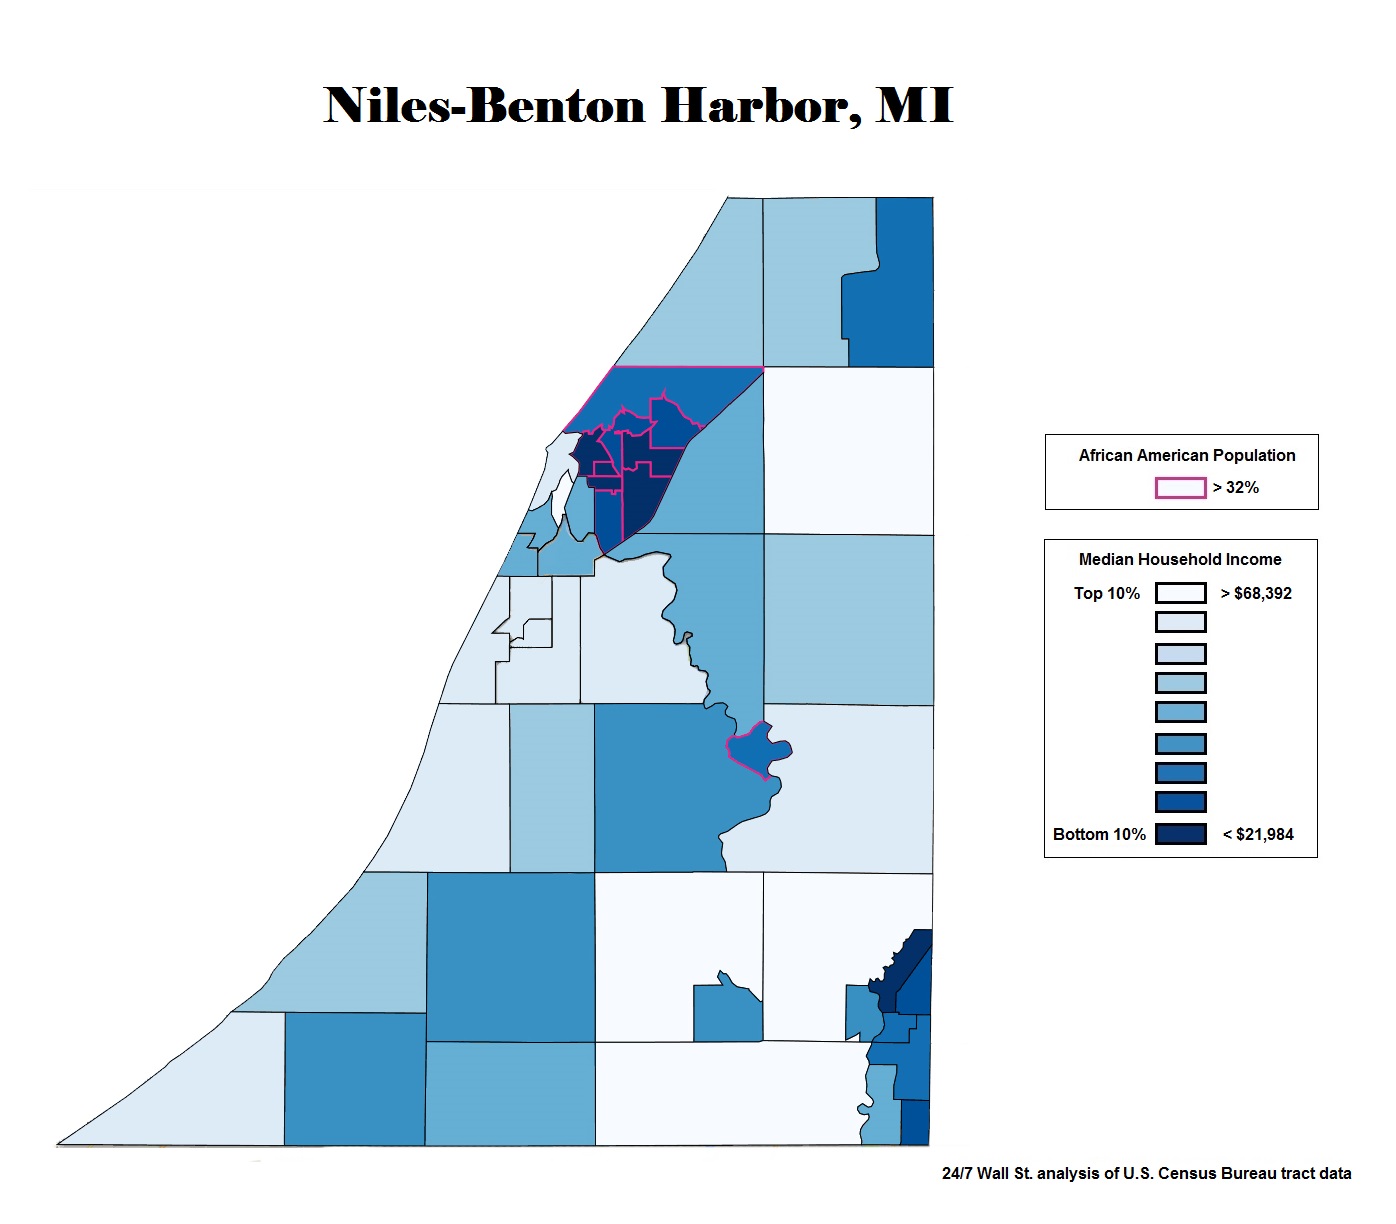
5. Niles-Benton Harbor, MI
> Black population: 15.2%
> Black median income: 46.1% of white income
> White unemployment: 3.6%
> Black unemployment: 17.3%
Niles-Benton Harbor metropolitan area residents tend to have lower incomes compared to Americans overall, but the severity of poverty still takes a greater toll on the city’s black residents. White households in the metro area typically earn roughly $52,000 annually, while the median among black households is barely $24,000. More than 40% of Niles-Benton Harbor black residents live at or below the poverty line, while just 10.7% of the area’s white residents do.
[in-text-ad]
Click image to enlarge
In addition to earning less, black residents are also far more likely to be unemployed, which helps explain the major income differences. Just 3.6% of the area’s white labor force are unemployed, while 17.3% of the area’s black labor force are.
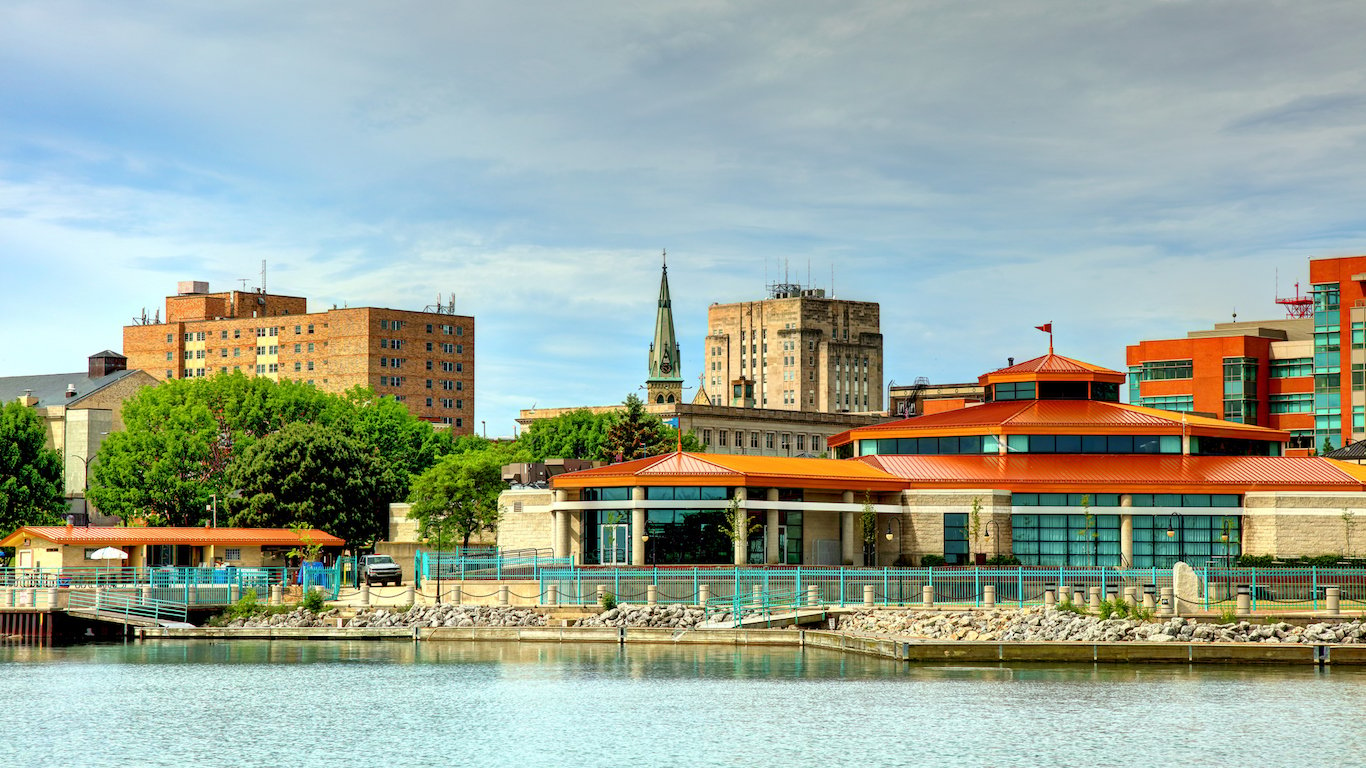
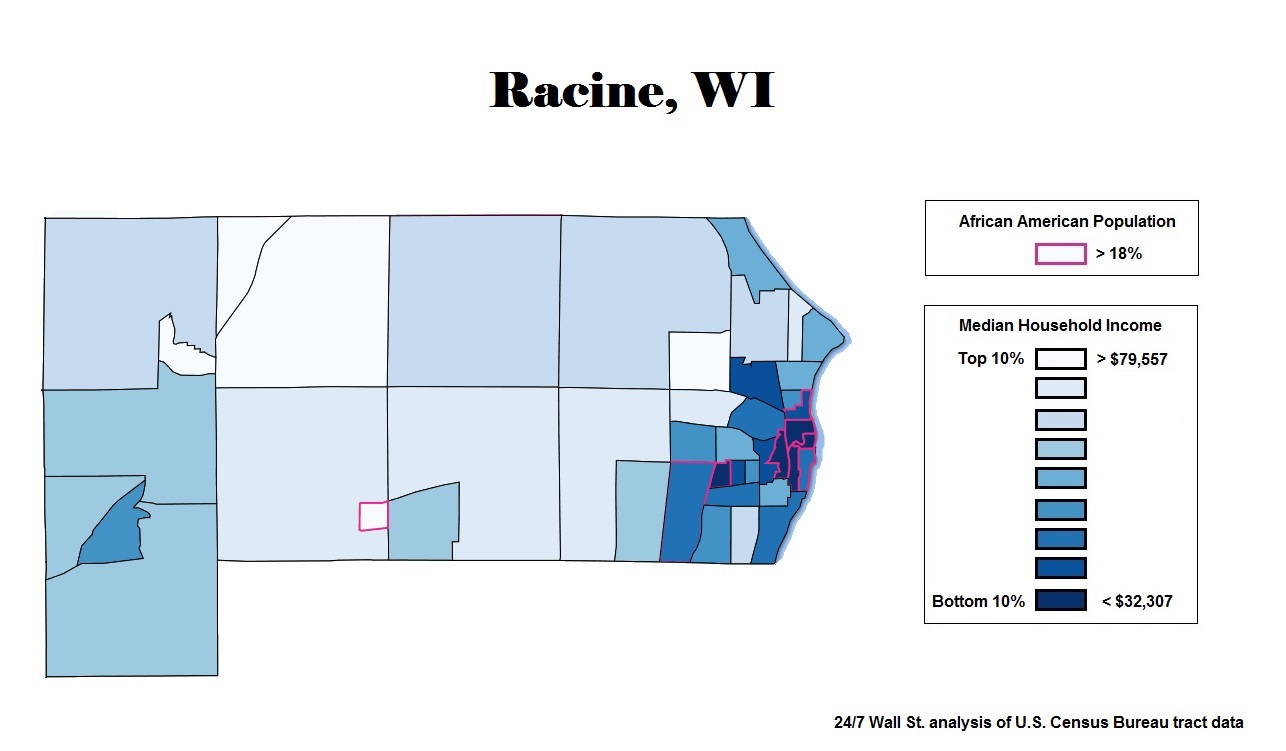
4. Racine, WI
> Black population: 11.1%
> Black median income: 34.6% of white income
> White unemployment: 4.8%
> Black unemployment: 10.7%
While the median annual income for white households in Racine of $62,368 is similar to the median income for white household nationwide of $63,155, the typical black household in the city earns just $21,573 a year, nearly half the median income of black households nationwide of $38,155. The typical black household in the Racine metro area earns just 35 cents for every dollar the typical white household earns, the second largest black-white earnings gap of any city.
Click image to enlarge
Divisions in income along racial lines are often perpetuated by disparities in educational attainment. In Racine, just 6.8% of black adults have at least a bachelor’s degree — less than half the 20.9% national black college attainment rate and among the smallest shares of any city. Meanwhile, 28.4% of white adults in Racine have a bachelor’s degree.
[recirclink id=419340]

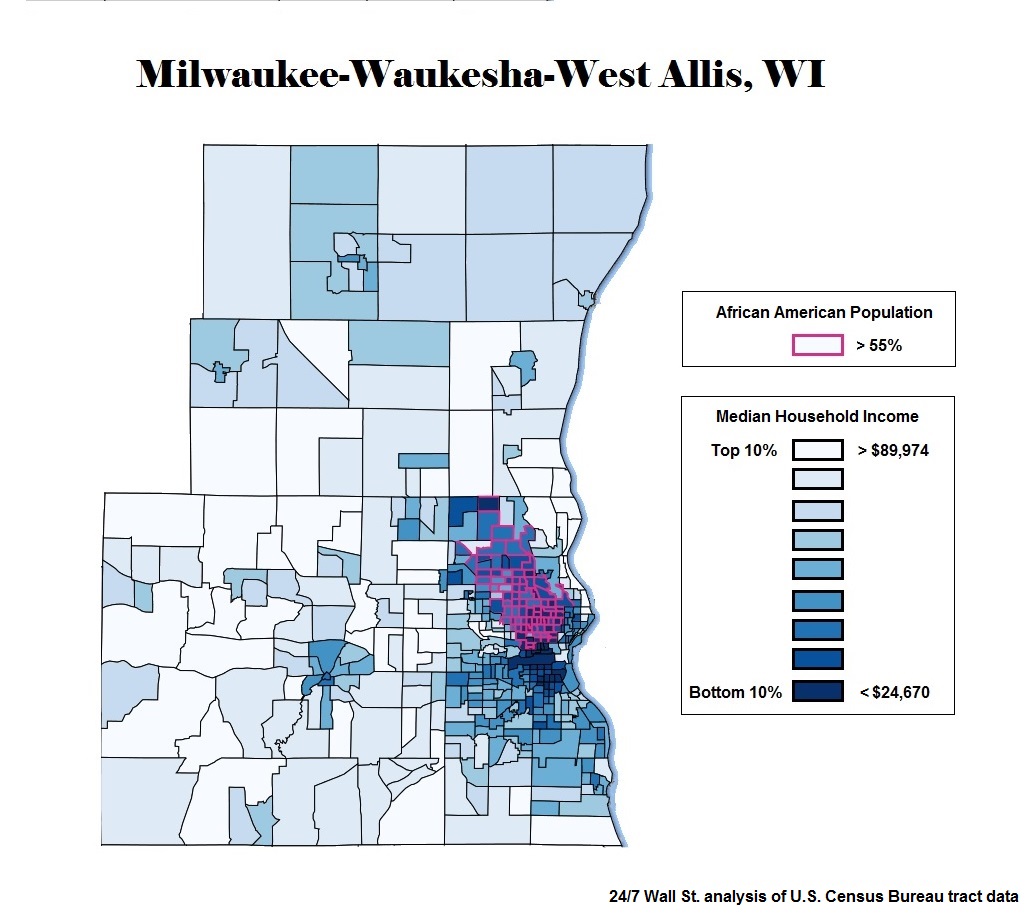
3. Milwaukee-Waukesha-West Allis, WI
> Black population: 16.6%
> Black median income: 42.2% of white income
> White unemployment: 3.3%
> Black unemployment: 12.4%
One of the biggest problems facing African Americans today is the extremely high and unequal rate at which they are incarcerated. At some point in their lifetimes, 1 in every 3 black males born today can expect to go to prison in their lifetimes. Rejoining society after obtaining a felony record can be extremely difficult, and in Milwaukee — where the typical black household earns just 42% of the white median household income — inequality might be explained in part by racial incarceration disparity.
Click image to enlarge
In Wisconsin, whites are incarcerated at a rate of 221 for every 100,000 residents each year, slightly below the national white incarceration rate. The black incarceration rate, meanwhile, is 2,542 for every 100,000 black residents, the fifth highest rate of any state.
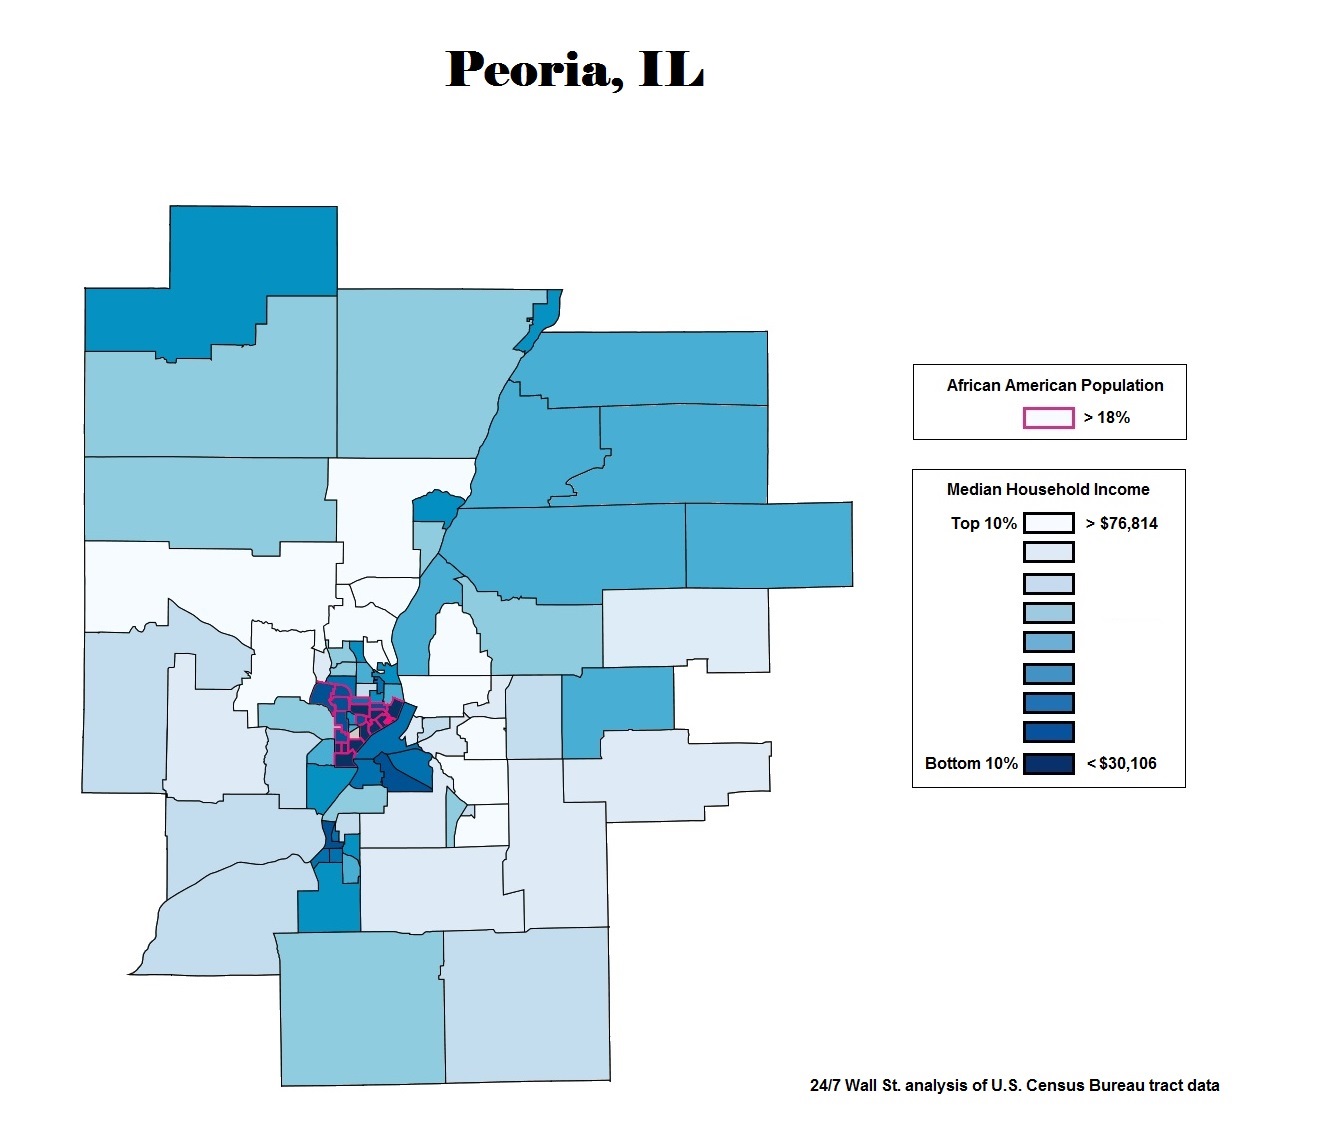
2. Peoria, IL
> Black population: 9.3%
> Black median income: 42.7% of white income
> White unemployment: 5.4%
> Black unemployment: 19.3%
The typical black household in the Peoria metro area earns just 43 cents for every dollar a typical white household earns, one of the largest black-white earnings gaps of any city. Differences in income are partially responsible for the large poverty gap in Peoria. While just 8.6% of white residents live below the poverty line, 35.2% of black residents in the city do.
[in-text-ad-2]
Click image to enlarge
Systemic income inequality between black and white Americans can contribute to further disparities in education, employment, and health outcomes. The difference in age-adjusted mortality rates of black and white residents in Peoria is one of the largest in the country.
1. Erie, PA
> Black population: 7.2%
> Black median income: 43.2% of white income
> White unemployment: 4.0%
> Black unemployment: 24.6%
No major metropolitan area has greater racial inequalities across major social and economic outcome measures than Erie, Pennsylvania. An astounding 47% of the black population lives at or below the national poverty line, twice the the already alarming national poverty rate for black Americans of 23.9%, and more than four times the white poverty rate in Erie of 11.9%.
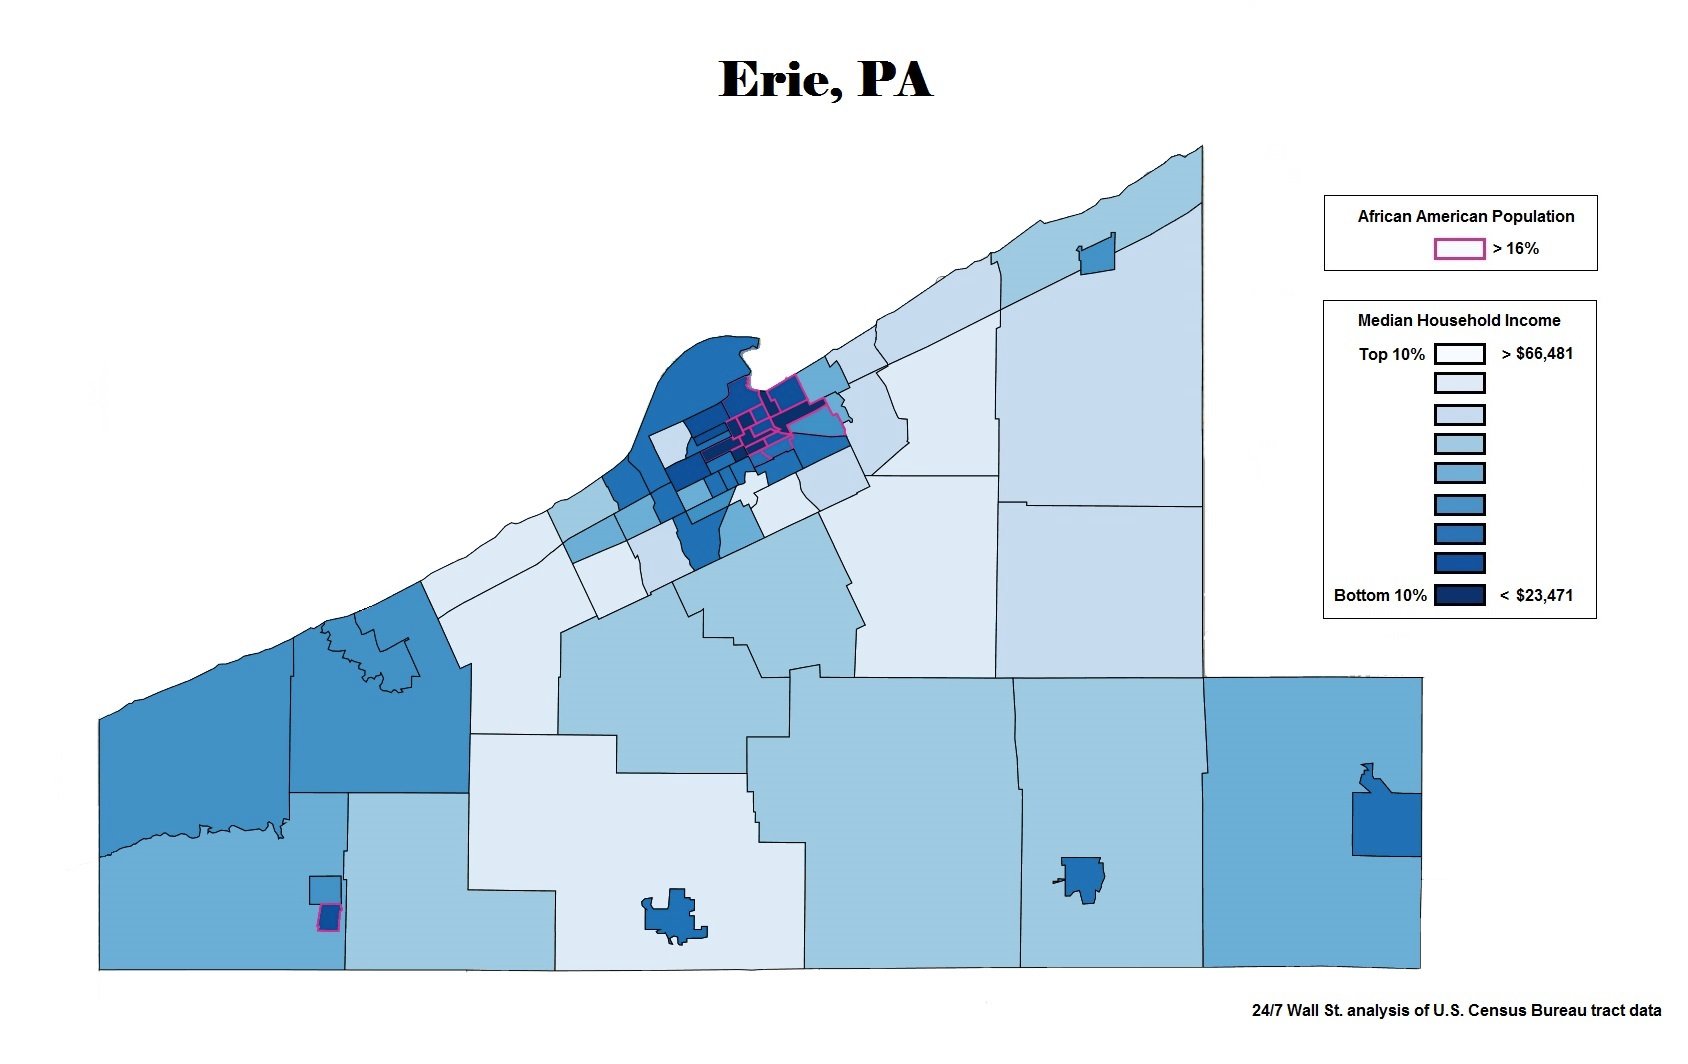
Click image to enlarge
The stark differences along racial lines in the city are also well reflected by the deep gap in job prospects between white and black residents. Erie’s overall unemployment rate of 5.8% is identical to the national rate. However, just 4.0% of the white labor force is unemployed, while 25% of the black labor force is.
Detailed Findings & Methodology
One factor contributing to racial inequality is residential segregation. Discriminatory lending practices and housing policies have historically separated black and white residents along geographic lines. In many of the cities with the worst racial inequality, poor black neighborhoods and wealthier white neighborhoods are physically separated by a highway or other infrastructure.
Such residential segregation hurts educational outcomes for African Americans. Most public school funding comes from property taxes, with less than 10% of school budgets coming from federal sources. This means that schools in poor, black neighborhoods tend to be drastically underfunded. Despite the outcomes of the Brown v. Board of Education supreme court case banning segregation in public schools more than 50 years ago, many school systems remain divided along racial lines.
Recent economic trends have worsened racial inequality in some parts of the country. While the manufacturing industry was once an engine of achieving greater economic equality, providing well-paying jobs to low-skilled workers, the decline of the U.S. manufacturing industry has reversed much of the progress it once helped to achieve. Many of the metro areas with the worst racial inequality are industrial cities in the Midwest, where manufacturing jobs are in steep decline.
One of the largest contributors to racial inequality in the United States is the disparity in arrest and incarceration between white and black Americans. Today, 1,408 in every 100,000 black Americans are incarcerated in state prisons, an increase of nearly 200% since 1960. Meanwhile, the white incarceration rate is 275 per every 100,000 white Americans.
Numerous policies have contributed to the racial disparity in incarceration. A broad set of policies related to the war on drugs have disproportionately targeted African Americans, and they are largely responsible for the increase in black arrests and longer sentences for black Americans. For example, sentences related to crack cocaine, an illegal substance more common among black drug users, are far harsher than sentences related to powdered cocaine, a substance more common among white drug users.
Perhaps nowhere is inequality clearer than in the disparities in poverty — as well as the social and economic difficulties that accompany it — between white and black Americans. Disparities in income, as well as in education, unemployment, health, and incarceration can exacerbate each other and deepen the overall divide between black and white prosperity in the United States. Cities with large racial disparities in one socioeconomic measure often have disparities of similar degree in most other measures.
To determine the 10 worst cities for black Americans, 24/7 Wall St. created an index of eight measures to assess race-based gaps in access to resources and opportunities in each of the nation’s metropolitan areas. Creating the index in this way ensured that cities were ranked on the differences between black and white residents and not on absolute levels of socioeconomic development. For each measure, we constructed an index from the gaps between black and white Americans. The index was standardized using interdecile normalization so outliers in the data did not skew results. We excluded metro areas where black residents comprised less than 5% of the population or where data limitations made comparisons between racial groups impossible.
Within the index, we considered 2016 data from the U.S. Census Bureau’s American Community Survey on median household income, poverty, adult high school and bachelor’s degree attainment, homeownership, and unemployment rates. Data on incarceration rates came from The Sentencing Project, a nonprofit dedicated to criminal justice reform, and is for the most recent available year. Because states, rather than metro areas, are responsible for the prison population, incarceration rates are for the state where the metro area is located. If a metro area spans more than one state, we used the state in which the metro area’s principal city is located. From the Centers for Disease Control and Prevention, we used age-adjusted mortality rates by race for each U.S. county from 2011-2015 to calculate mortality rates at the metro level using a variation on the indirect standardization method. Incarceration and mortality rates are per 100,000 residents. Data on median household income used in maps are for all census tracts in a metropolitan statistical area, and are estimates for 2011-2015 from the ACS. Shading is dependent on household income, with the darkest census tracts in the bottom 10th percentile of income, and the lightest tracts in the top 10th percentile for income in the city. Census tracts where the number of black residents as a share of the population is in the top 20th percentile for all census tracts in the metropolitan area have pink borders.
Contact [email protected] for any questions or corrections.