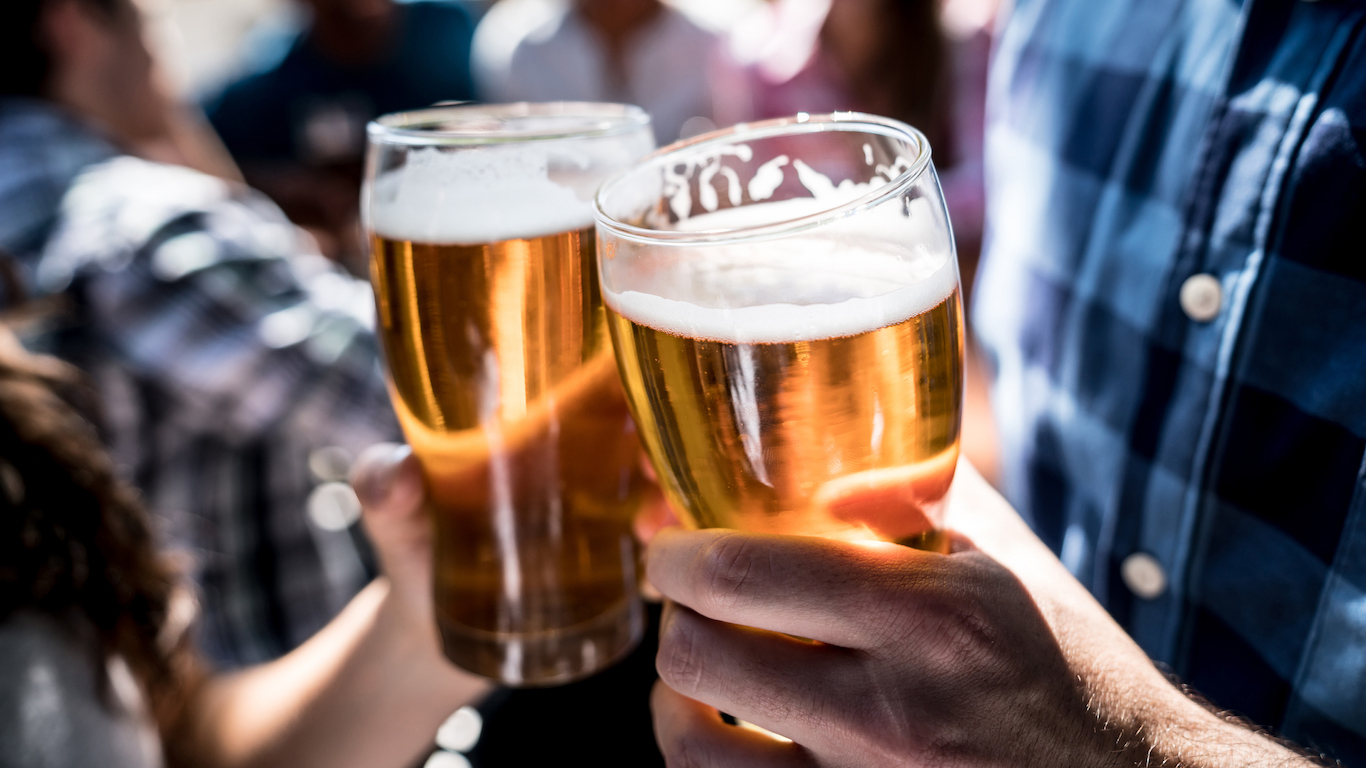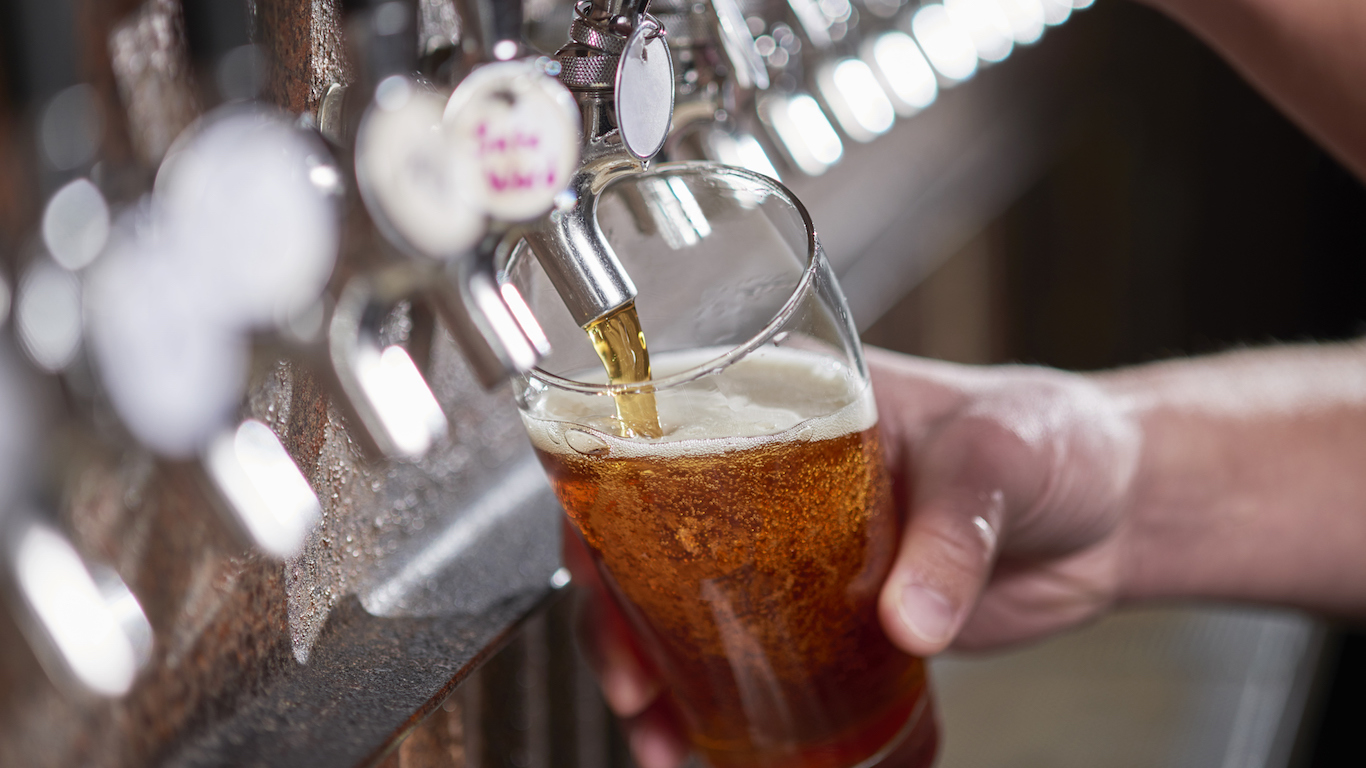
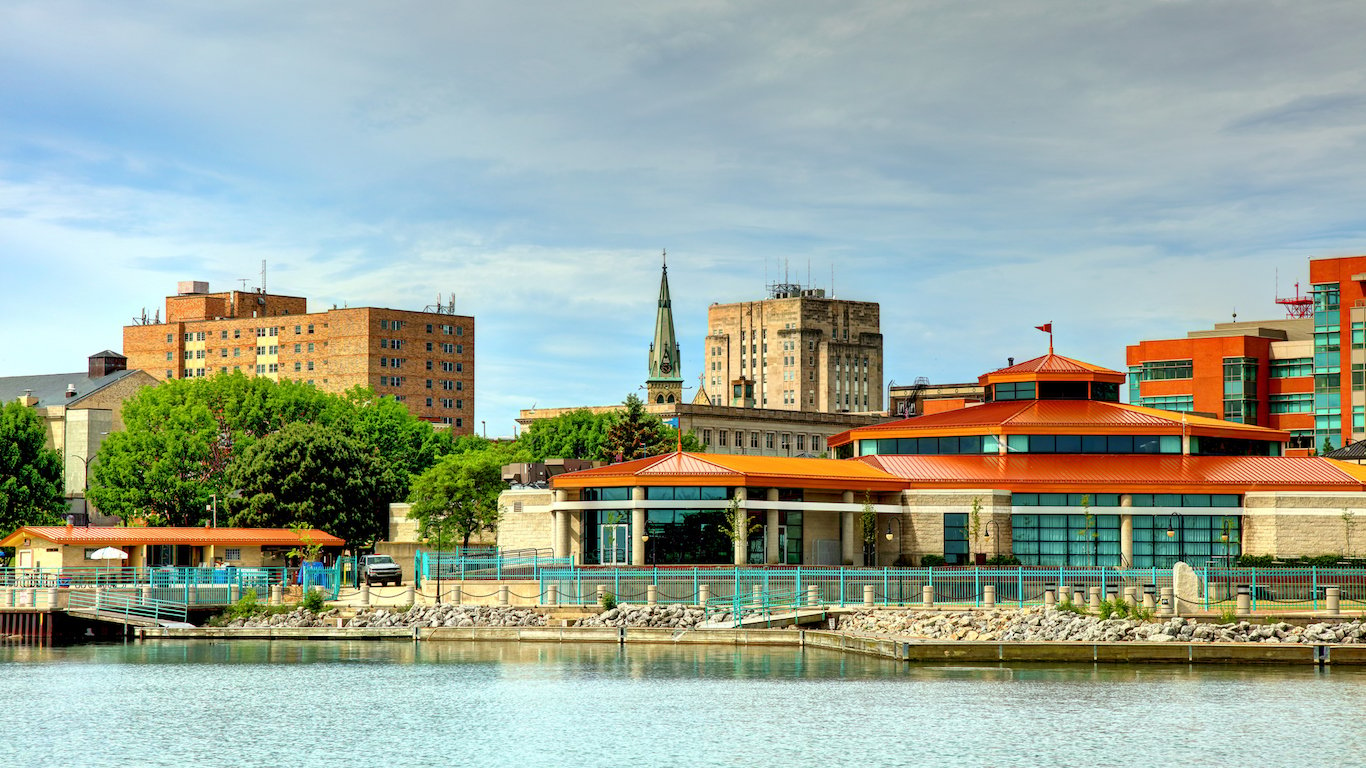
Despite shifting tastes among millennials, beer remains the most popular alcoholic beverage in the United States. It is the drink of choice for 43% of Americans who drink, beating out wine at 32% and liquor at 20%. Beer makers shipped 26.4 gallons of beer per American adult in 2017.
Beer is, to many, an important part of America’s cultural legacy. The beverage is tied to some of the oldest businesses and brands in the nation. Some parts of the country take pride in the brews that come from their region, and those areas often happen to consume the drink with greater zest than those in other parts of the country.
In fact, beer consumption tends to vary considerably across the country. According to Beer Marketer’s Insights, a brewing industry trade publisher, shipments of beer per capita range from over 40 gallons in one state to less than 20 in another. Generally, residents of states in the Midwest tend to be the biggest beer drinkers, while residents of states in the Northeast and New England consume the least with a few notable exceptions. A few New England states are actually some of the biggest beer drinkers in the country.
Beer consumption differs from state to state not just because of cultural reasons, but also because of differences in purchasing laws and taxes.
Click here to see beer consumption in each state.
Click here to see our detailed findings and methodology.

50. Utah
> Annual per capita consumption: 18.7 gallons of beer
> Total beer consumption: 38.1 million gallons
> 5 yr. consumption change: +2.8%
> Bars and restaurants per 100,000 people: 154.8 (6th lowest)
> Beer tax rate: $0.41 per gallon (13th highest)
[recirclink id=444468]

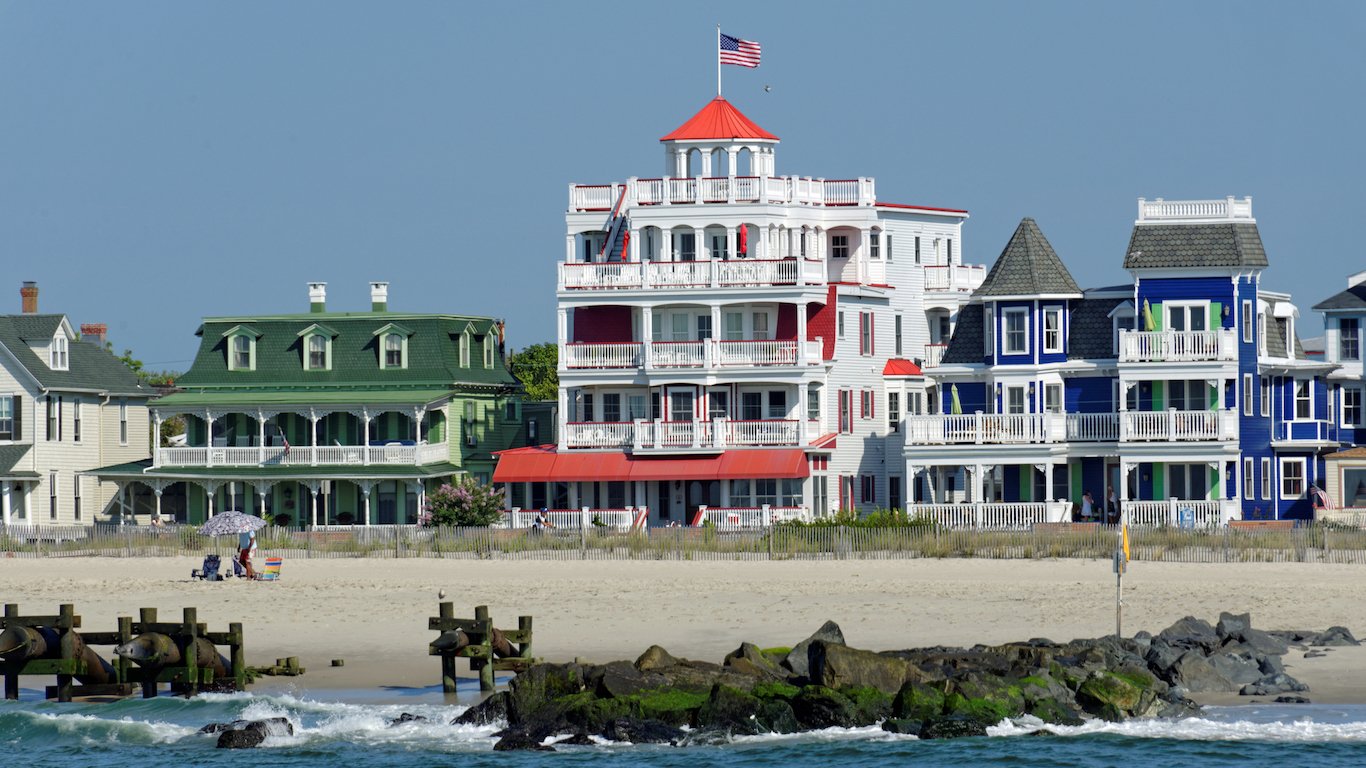
49. Connecticut (tied)
> Annual per capita consumption: 20.2 gallons of beer
> Total beer consumption: 54.2 million gallons
> 5 yr. consumption change: -8.1%
> Bars and restaurants per 100,000 people: 204.5 (13th highest)
> Beer tax rate: $0.23 per gallon (24th lowest)
[in-text-ad]

48. Maryland (tied)
> Annual per capita consumption: 20.2 gallons of beer
> Total beer consumption: 90.1 million gallons
> 5 yr. consumption change: -9.6%
> Bars and restaurants per 100,000 people: 169.5 (14th lowest)
> Beer tax rate: $0.53 per gallon (9th highest)
47. New Jersey
> Annual per capita consumption: 20.6 gallons of beer
> Total beer consumption: 138.0 million gallons
> 5 yr. consumption change: -3.5%
> Bars and restaurants per 100,000 people: 200.5 (17th highest)
> Beer tax rate: $0.12 per gallon (9th lowest)
[nativounit]

46. New York
> Annual per capita consumption: 21.9 gallons of beer
> Total beer consumption: 327.5 million gallons
> 5 yr. consumption change: -2.9%
> Bars and restaurants per 100,000 people: 235.7 (4th highest)
> Beer tax rate: $0.14 per gallon (12th lowest)
45. Rhode Island
> Annual per capita consumption: 23.0 gallons of beer
> Total beer consumption: 18.4 million gallons
> 5 yr. consumption change: -10.0%
> Bars and restaurants per 100,000 people: 250.9 (2nd highest)
> Beer tax rate: $0.12 per gallon (10th lowest)
[recirclink id=444391]
44. Indiana
> Annual per capita consumption: 23.4 gallons of beer
> Total beer consumption: 112.7 million gallons
> 5 yr. consumption change: -6.0%
> Bars and restaurants per 100,000 people: 172.4 (19th lowest)
> Beer tax rate: $0.12 per gallon (8th lowest)
[in-text-ad]
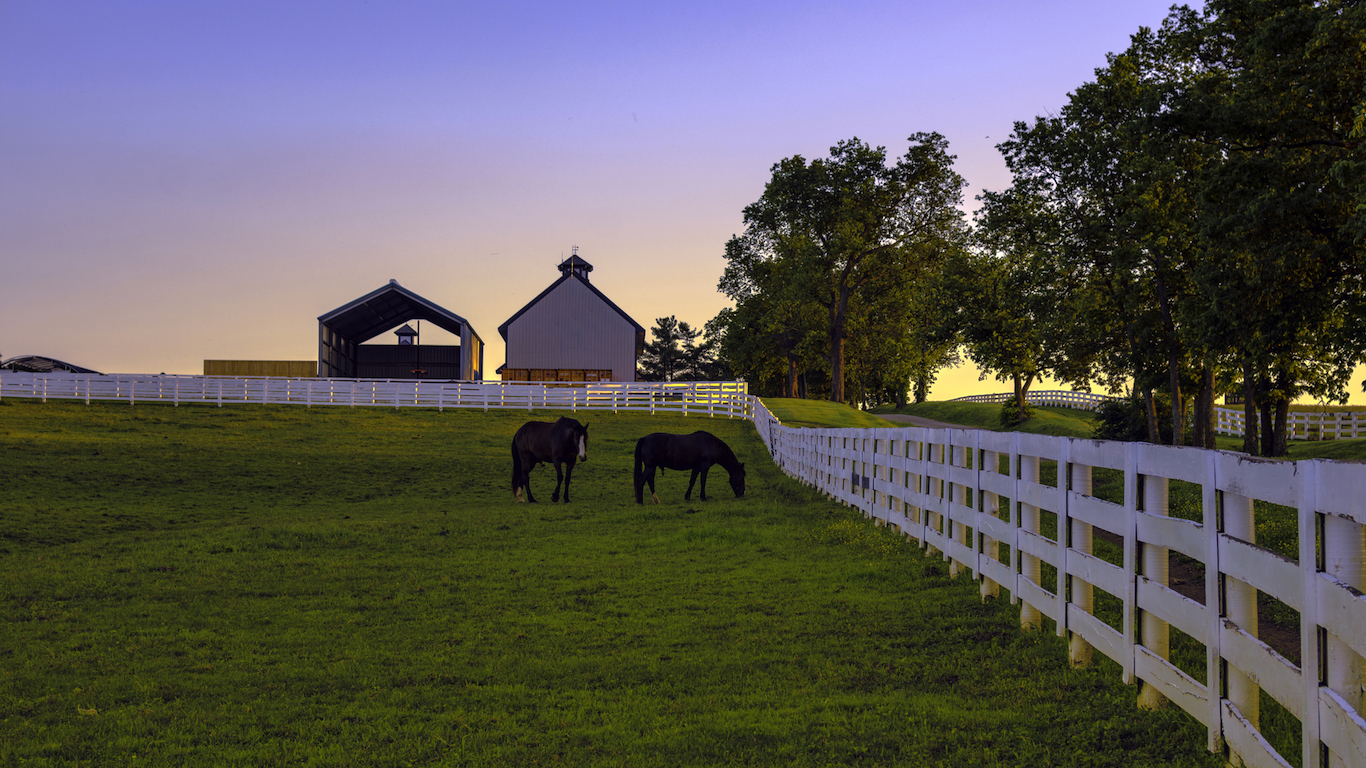
43. Kentucky (tied)
> Annual per capita consumption: 23.6 gallons of beer
> Total beer consumption: 77.1 million gallons
> 5 yr. consumption change: -0.8%
> Bars and restaurants per 100,000 people: 153.3 (2nd lowest)
> Beer tax rate: $0.85 per gallon (6th highest)
42. Massachusetts (tied)
> Annual per capita consumption: 23.6 gallons of beer
> Total beer consumption: 121.9 million gallons
> 5 yr. consumption change: -5.7%
> Bars and restaurants per 100,000 people: 217.7 (7th highest)
> Beer tax rate: $0.11 per gallon (7th lowest)
[nativounit]
41. Arkansas
> Annual per capita consumption: 23.7 gallons of beer
> Total beer consumption: 52.0 million gallons
> 5 yr. consumption change: -6.8%
> Bars and restaurants per 100,000 people: 153.8 (4th lowest)
> Beer tax rate: $0.34 per gallon (19th highest)

40. Georgia
> Annual per capita consumption: 24.0 gallons of beer
> Total beer consumption: 179.6 million gallons
> 5 yr. consumption change: +0.1%
> Bars and restaurants per 100,000 people: 167.9 (12th lowest)
> Beer tax rate: $1.01 per gallon (4th highest)
[recirclink id=444326]
39. Tennessee (tied)
> Annual per capita consumption: 24.4 gallons of beer
> Total beer consumption: 120.8 million gallons
> 5 yr. consumption change: -1.6%
> Bars and restaurants per 100,000 people: 162.4 (8th lowest)
> Beer tax rate: $1.29 per gallon (the highest)
[in-text-ad]

38. Virginia (tied)
> Annual per capita consumption: 24.4 gallons of beer
> Total beer consumption: 152.7 million gallons
> 5 yr. consumption change: -3.6%
> Bars and restaurants per 100,000 people: 176.3 (22nd lowest)
> Beer tax rate: $0.26 per gallon (25th lowest)

37. Washington
> Annual per capita consumption: 24.7 gallons of beer
> Total beer consumption: 135.6 million gallons
> 5 yr. consumption change: +9.1%
> Bars and restaurants per 100,000 people: 202.2 (16th highest)
> Beer tax rate: $0.26 per gallon (25th highest)
[nativounit]

36. North Carolina
> Annual per capita consumption: 25.0 gallons of beer
> Total beer consumption: 188.0 million gallons
> 5 yr. consumption change: -1.1%
> Bars and restaurants per 100,000 people: 174.7 (21st lowest)
> Beer tax rate: $0.62 per gallon (8th highest)
35. California (tied)
> Annual per capita consumption: 25.1 gallons of beer
> Total beer consumption: 724.9 million gallons
> 5 yr. consumption change: +3.4%
> Bars and restaurants per 100,000 people: 192.2 (21st highest)
> Beer tax rate: $0.20 per gallon (21st lowest)
[recirclink id=444046]

34. Oklahoma (tied)
> Annual per capita consumption: 25.1 gallons of beer
> Total beer consumption: 70.7 million gallons
> 5 yr. consumption change: -8.1%
> Bars and restaurants per 100,000 people: 167.1 (11th lowest)
> Beer tax rate: $0.40 per gallon (15th highest)
[in-text-ad]
33. Michigan
> Annual per capita consumption: 25.3 gallons of beer
> Total beer consumption: 186.7 million gallons
> 5 yr. consumption change: -3.8%
> Bars and restaurants per 100,000 people: 171.2 (18th lowest)
> Beer tax rate: $0.20 per gallon (22nd lowest)

32. Kansas
> Annual per capita consumption: 25.7 gallons of beer
> Total beer consumption: 53.2 million gallons
> 5 yr. consumption change: -7.9%
> Bars and restaurants per 100,000 people: 173.5 (20th lowest)
> Beer tax rate: $0.18 per gallon (18th lowest)
[nativounit]
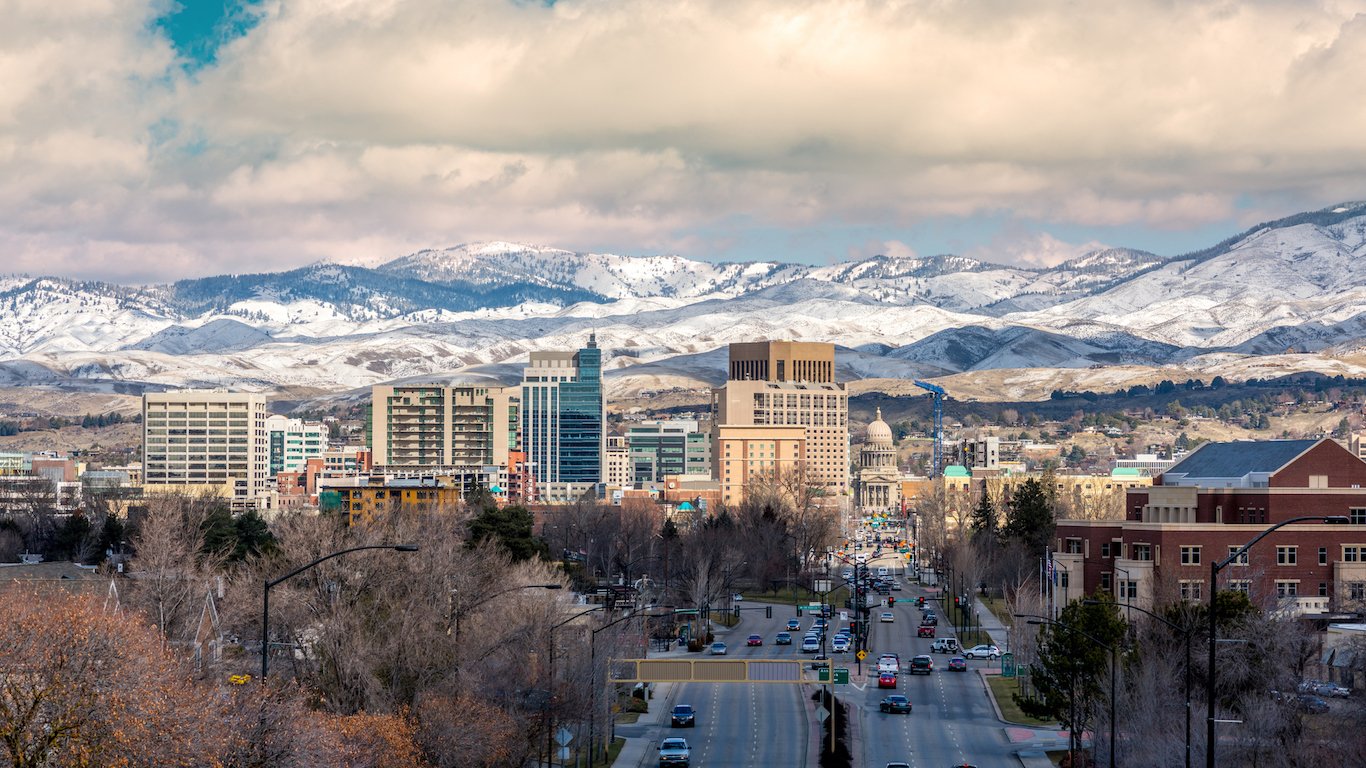
31. Idaho
> Annual per capita consumption: 25.9 gallons of beer
> Total beer consumption: 31.5 million gallons
> 5 yr. consumption change: +2.8%
> Bars and restaurants per 100,000 people: 183.3 (25th lowest)
> Beer tax rate: $0.15 per gallon (13th lowest)
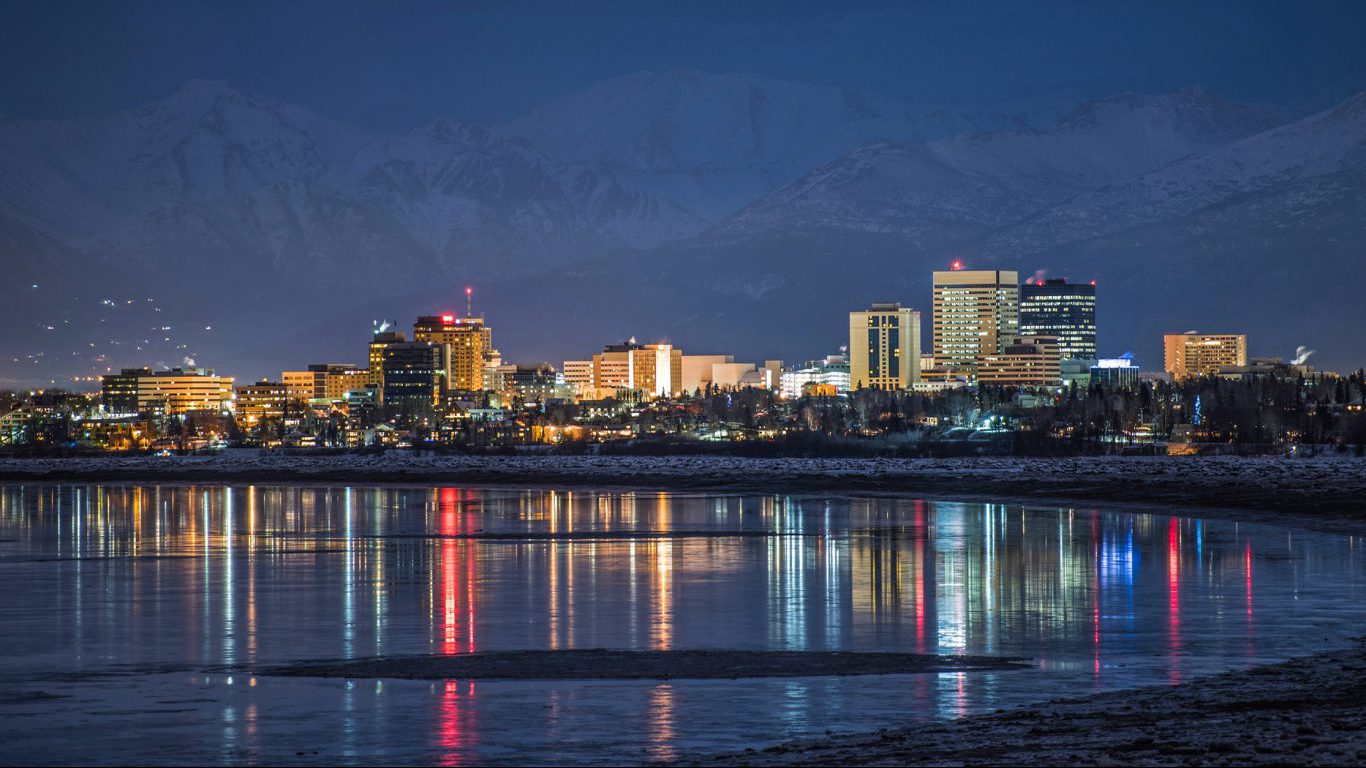
30. Alaska
> Annual per capita consumption: 26.0 gallons of beer
> Total beer consumption: 14.0 million gallons
> 5 yr. consumption change: -5.1%
> Bars and restaurants per 100,000 people: 196.4 (20th highest)
> Beer tax rate: $1.07 per gallon (2nd highest)
[recirclink id=443940]
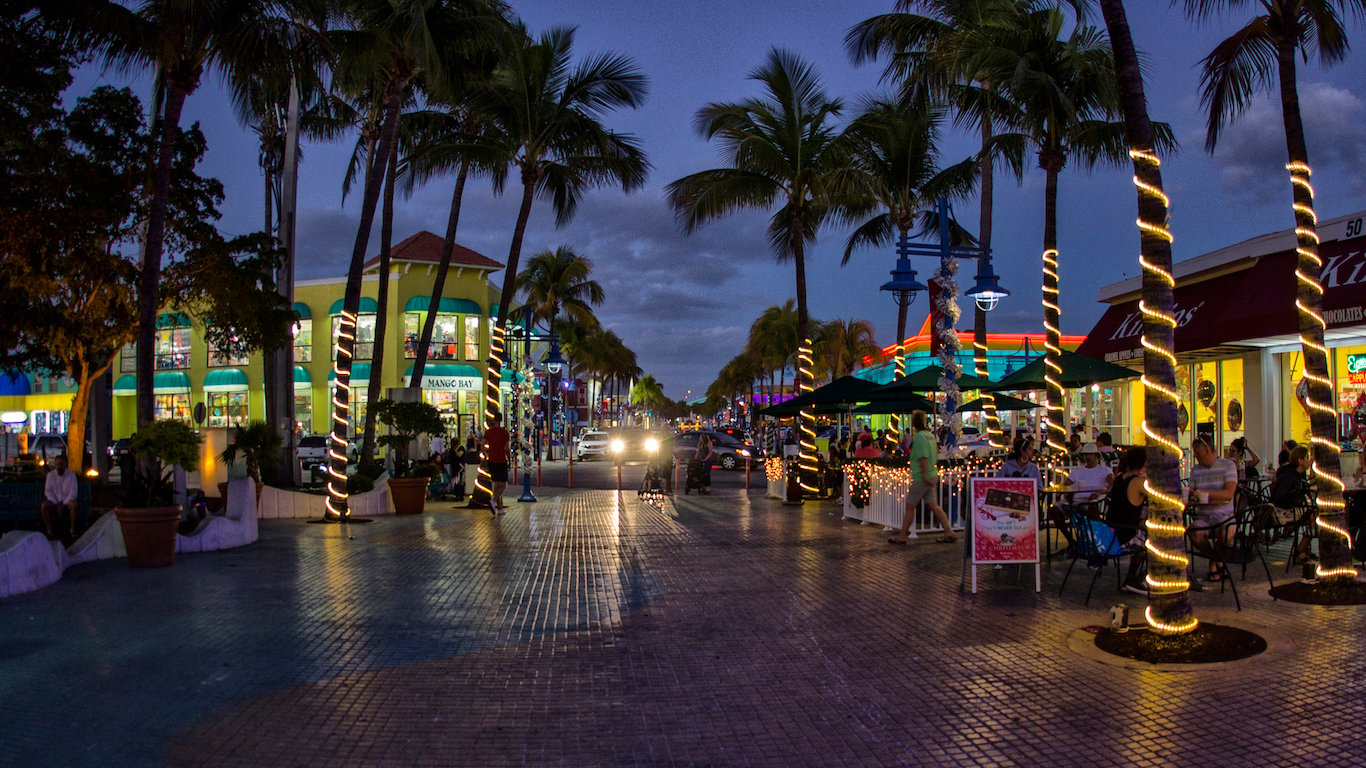
29. Florida
> Annual per capita consumption: 26.3 gallons of beer
> Total beer consumption: 423.1 million gallons
> 5 yr. consumption change: +4.5%
> Bars and restaurants per 100,000 people: 169.5 (15th lowest)
> Beer tax rate: $0.48 per gallon (11th highest)
[in-text-ad]
28. Pennsylvania
> Annual per capita consumption: 26.4 gallons of beer
> Total beer consumption: 254.1 million gallons
> 5 yr. consumption change: -6.5%
> Bars and restaurants per 100,000 people: 186.7 (24th highest)
> Beer tax rate: $0.08 per gallon (5th lowest)
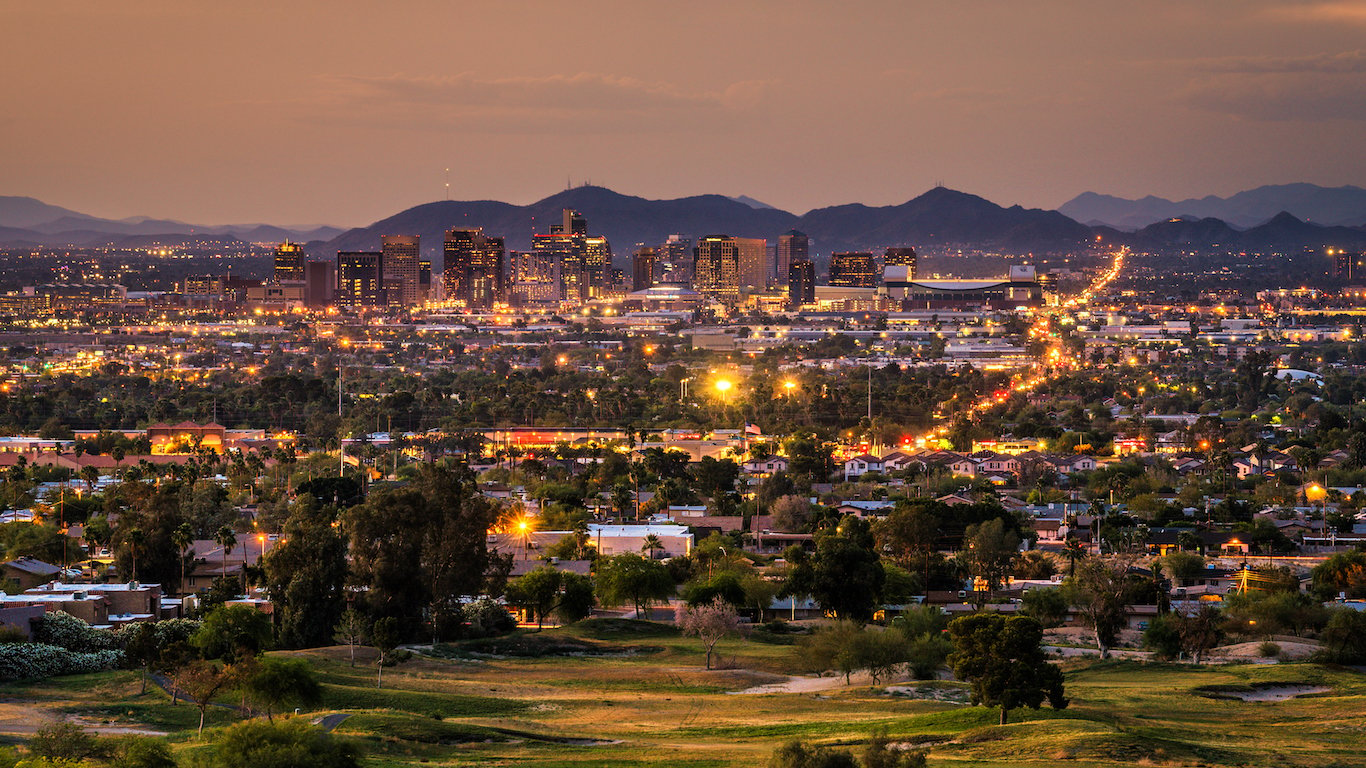
27. Arizona
> Annual per capita consumption: 26.6 gallons of beer
> Total beer consumption: 135.6 million gallons
> 5 yr. consumption change: -1.4%
> Bars and restaurants per 100,000 people: 154.3 (5th lowest)
> Beer tax rate: $0.16 per gallon (15th lowest)
[nativounit]
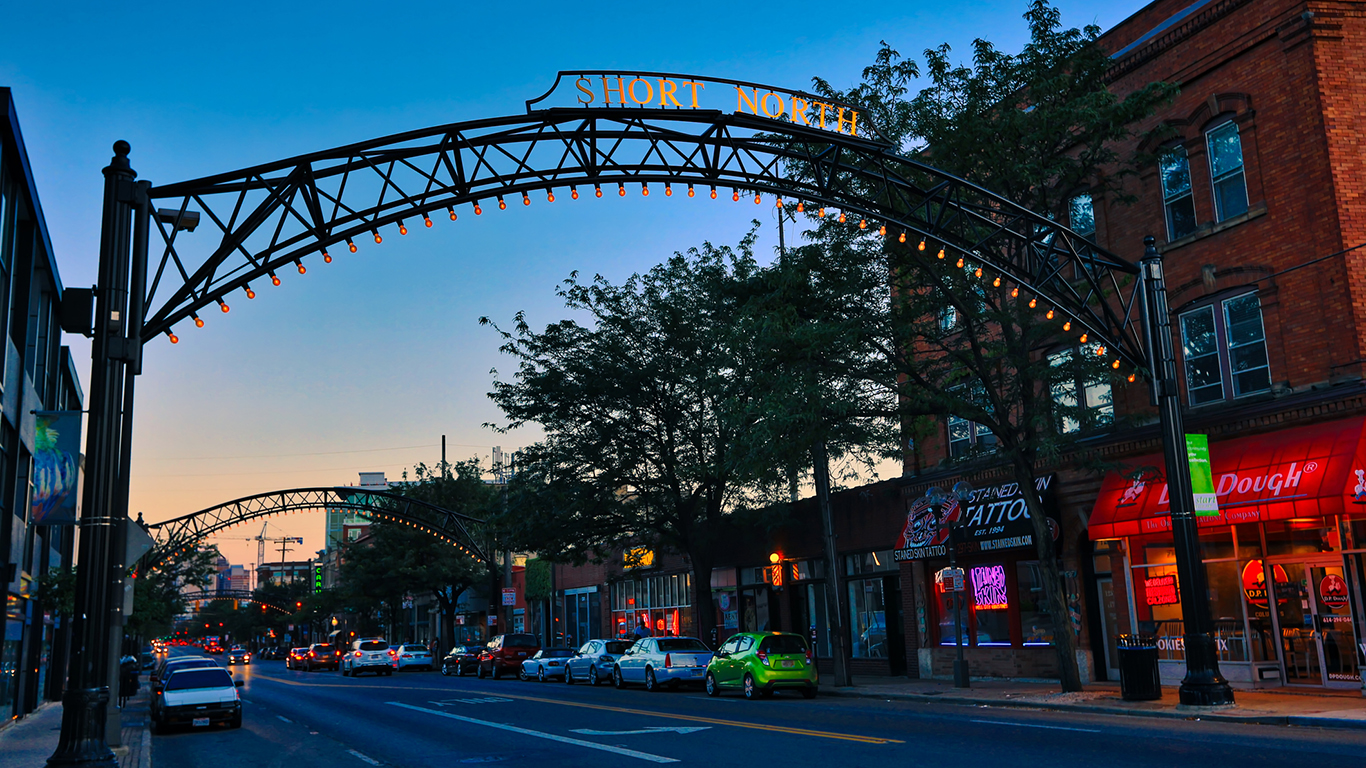
26. Ohio
> Annual per capita consumption: 27.3 gallons of beer
> Total beer consumption: 234.7 million gallons
> 5 yr. consumption change: -6.9%
> Bars and restaurants per 100,000 people: 180.6 (24th lowest)
> Beer tax rate: $0.18 per gallon (17th lowest)
25. Illinois (tied)
> Annual per capita consumption: 27.4 gallons of beer
> Total beer consumption: 259.4 million gallons
> 5 yr. consumption change: -3.9%
> Bars and restaurants per 100,000 people: 192.1 (22nd highest)
> Beer tax rate: $0.23 per gallon (23rd lowest)
[recirclink id=443564]
24. West Virginia (tied)
> Annual per capita consumption: 27.4 gallons of beer
> Total beer consumption: 37.8 million gallons
> 5 yr. consumption change: -10.9%
> Bars and restaurants per 100,000 people: 165.3 (9th lowest)
> Beer tax rate: $0.18 per gallon (16th lowest)
[in-text-ad]
23. Missouri
> Annual per capita consumption: 27.7 gallons of beer
> Total beer consumption: 125.6 million gallons
> 5 yr. consumption change: -7.2%
> Bars and restaurants per 100,000 people: 170.7 (17th lowest)
> Beer tax rate: $0.06 per gallon (2nd lowest)
22. Colorado
> Annual per capita consumption: 28.3 gallons of beer
> Total beer consumption: 117.6 million gallons
> 5 yr. consumption change: +4.5%
> Bars and restaurants per 100,000 people: 203.5 (15th highest)
> Beer tax rate: $0.08 per gallon (5th lowest)
[nativounit]

21. Minnesota
> Annual per capita consumption: 28.4 gallons of beer
> Total beer consumption: 115.4 million gallons
> 5 yr. consumption change: +0.1%
> Bars and restaurants per 100,000 people: 170.5 (16th lowest)
> Beer tax rate: $0.49 per gallon (10th highest)

20. Hawaii
> Annual per capita consumption: 28.5 gallons of beer
> Total beer consumption: 30.6 million gallons
> 5 yr. consumption change: -2.9%
> Bars and restaurants per 100,000 people: 227.8 (5th highest)
> Beer tax rate: $0.93 per gallon (5th highest)
[recirclink id=443882]

19. Delaware
> Annual per capita consumption: 28.7 gallons of beer
> Total beer consumption: 20.7 million gallons
> 5 yr. consumption change: -8.4%
> Bars and restaurants per 100,000 people: 185.3 (25th highest)
> Beer tax rate: $0.26 per gallon (24th highest)
[in-text-ad]
18. New Mexico
> Annual per capita consumption: 28.8 gallons of beer
> Total beer consumption: 43.8 million gallons
> 5 yr. consumption change: -9.1%
> Bars and restaurants per 100,000 people: 158.4 (7th lowest)
> Beer tax rate: $0.41 per gallon (14th highest)

17. Alabama
> Annual per capita consumption: 28.9 gallons of beer
> Total beer consumption: 103.7 million gallons
> 5 yr. consumption change: -2.3%
> Bars and restaurants per 100,000 people: 153.3 (3rd lowest)
> Beer tax rate: $1.05 per gallon (3rd highest)
[nativounit]

16. Wyoming
> Annual per capita consumption: 29.5 gallons of beer
> Total beer consumption: 12.3 million gallons
> 5 yr. consumption change: -10.4%
> Bars and restaurants per 100,000 people: 209.7 (12th highest)
> Beer tax rate: $0.02 per gallon (the lowest)
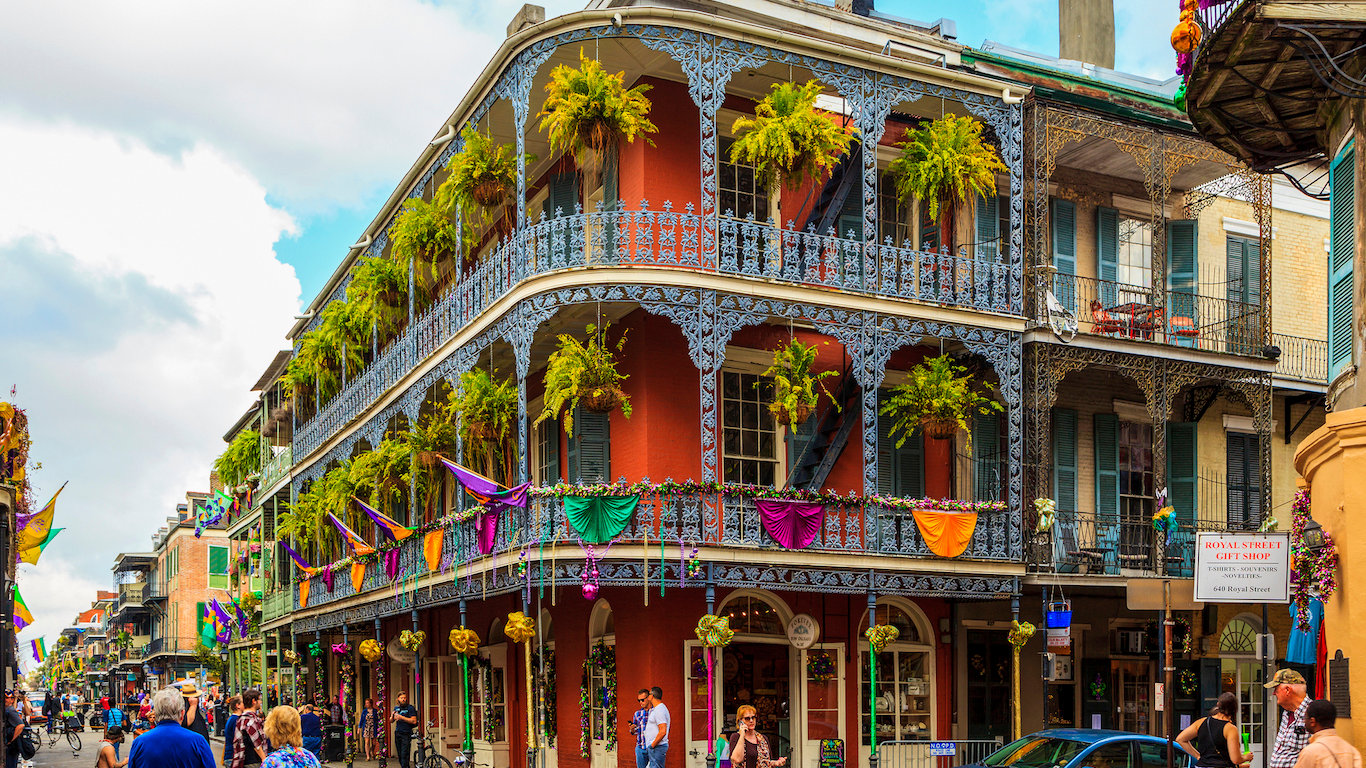
15. Louisiana
> Annual per capita consumption: 29.6 gallons of beer
> Total beer consumption: 99.4 million gallons
> 5 yr. consumption change: -10.9%
> Bars and restaurants per 100,000 people: 169.1 (13th lowest)
> Beer tax rate: $0.40 per gallon (15th highest)
[recirclink id=443620]

14. Oregon
> Annual per capita consumption: 30.0 gallons of beer
> Total beer consumption: 95.4 million gallons
> 5 yr. consumption change: +9.0%
> Bars and restaurants per 100,000 people: 236.3 (3rd highest)
> Beer tax rate: $0.08 per gallon (6th lowest)
[in-text-ad]
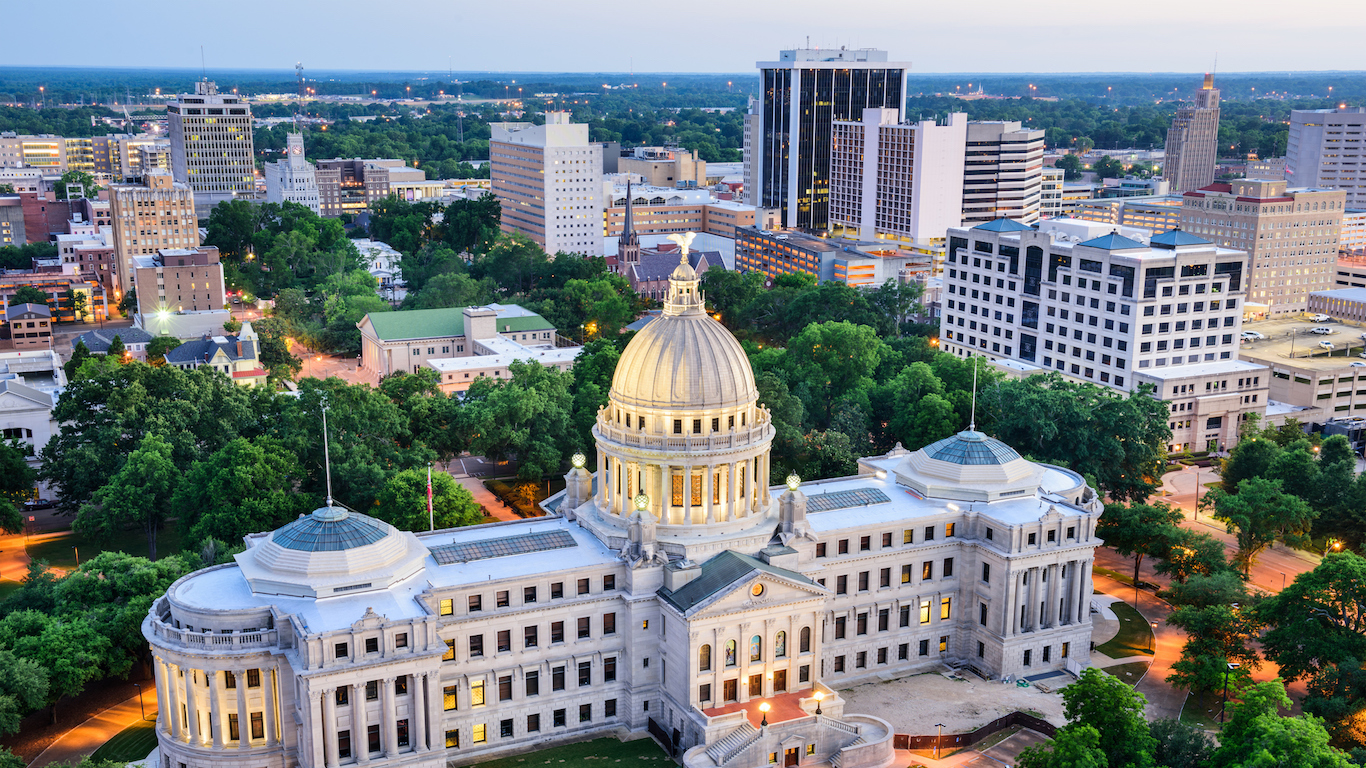
13. Mississippi (tied)
> Annual per capita consumption: 30.9 gallons of beer
> Total beer consumption: 66.6 million gallons
> 5 yr. consumption change: -6.7%
> Bars and restaurants per 100,000 people: 149.9 (the lowest)
> Beer tax rate: $0.43 per gallon (12th highest)
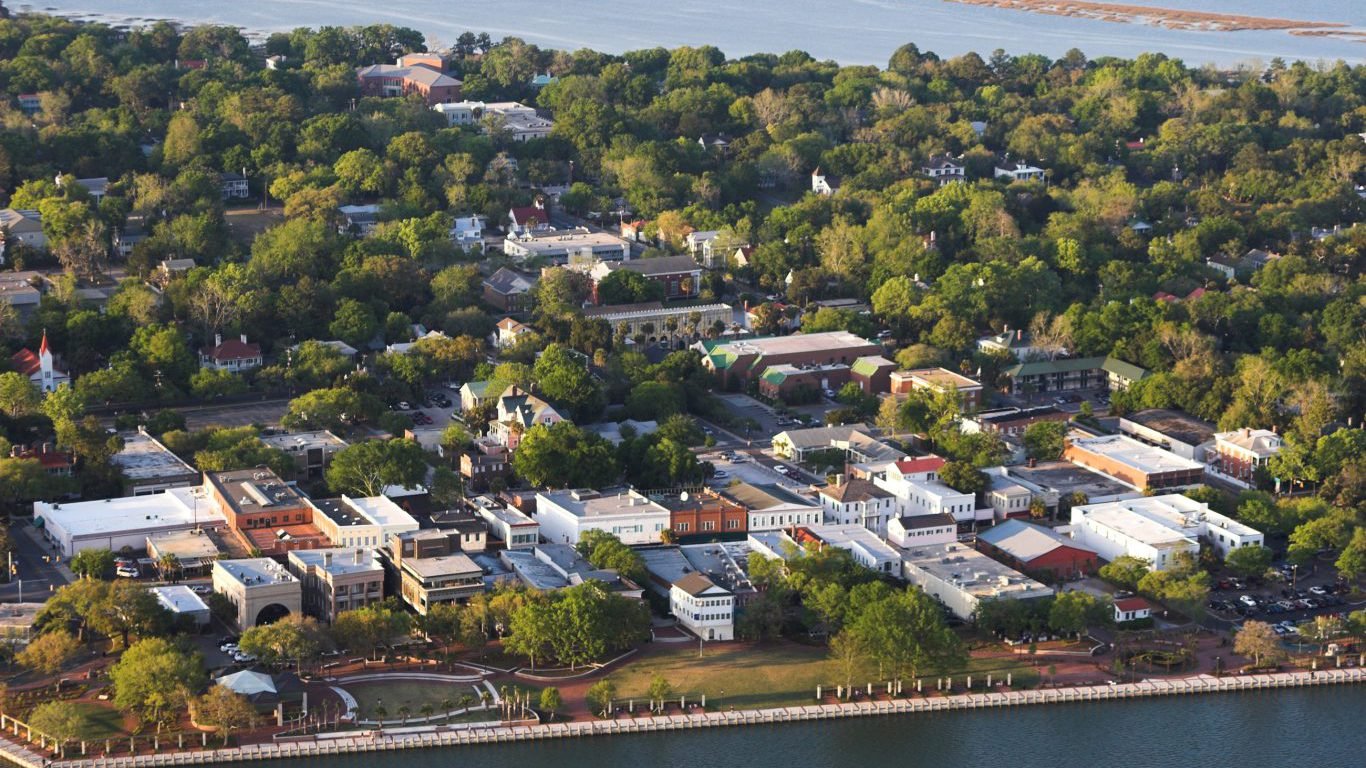
12. South Carolina (tied)
> Annual per capita consumption: 30.9 gallons of beer
> Total beer consumption: 115.0 million gallons
> 5 yr. consumption change: +2.2%
> Bars and restaurants per 100,000 people: 177.3 (23rd lowest)
> Beer tax rate: $0.77 per gallon (7th highest)
[nativounit]
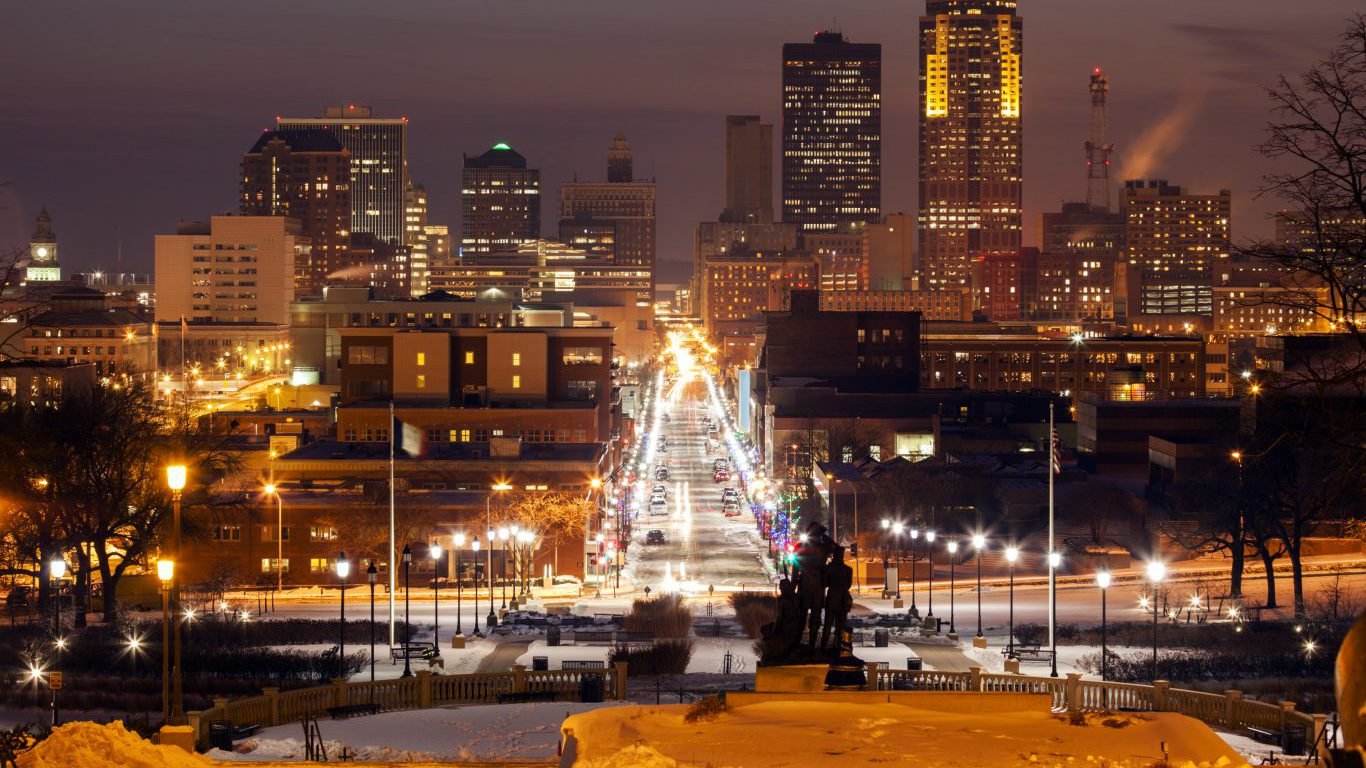
11. Iowa
> Annual per capita consumption: 31.7 gallons of beer
> Total beer consumption: 72.0 million gallons
> 5 yr. consumption change: -4.0%
> Bars and restaurants per 100,000 people: 190.5 (23rd highest)
> Beer tax rate: $0.19 per gallon (19th lowest)

10. Texas
> Annual per capita consumption: 31.8 gallons of beer
> Total beer consumption: 626.3 million gallons
> 5 yr. consumption change: +1.3%
> Bars and restaurants per 100,000 people: 166.3 (10th lowest)
> Beer tax rate: $0.20 per gallon (20th lowest)
[recirclink id=443575]
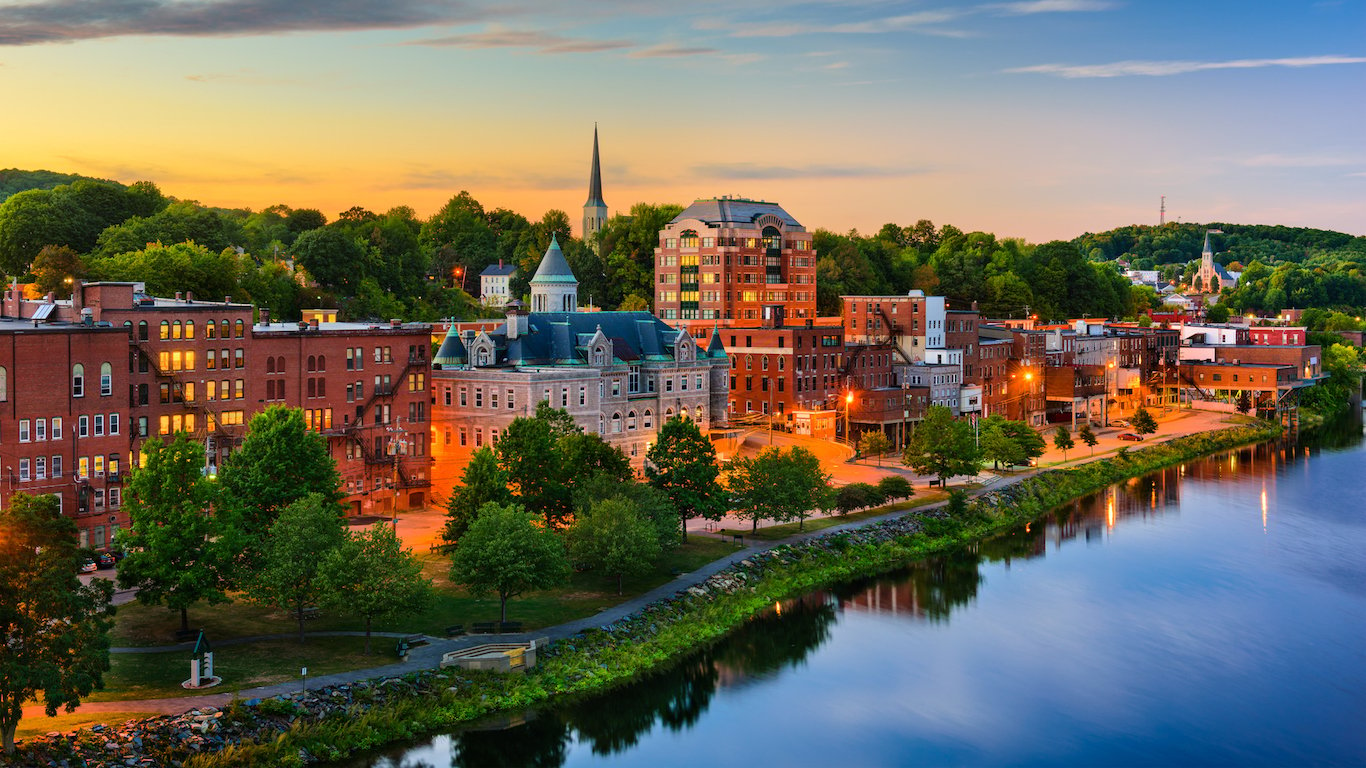
9. Vermont
> Annual per capita consumption: 32.8 gallons of beer
> Total beer consumption: 15.6 million gallons
> 5 yr. consumption change: -5.8%
> Bars and restaurants per 100,000 people: 210.2 (11th highest)
> Beer tax rate: $0.27 per gallon (23rd highest)
[in-text-ad]
8. Nevada
> Annual per capita consumption: 32.9 gallons of beer
> Total beer consumption: 72.9 million gallons
> 5 yr. consumption change: +2.2%
> Bars and restaurants per 100,000 people: 196.9 (19th highest)
> Beer tax rate: $0.16 per gallon (15th lowest)
7. Nebraska
> Annual per capita consumption: 33.3 gallons of beer
> Total beer consumption: 45.3 million gallons
> 5 yr. consumption change: -1.7%
> Bars and restaurants per 100,000 people: 197.1 (18th highest)
> Beer tax rate: $0.31 per gallon (20th highest)
[nativounit]
6. Maine
> Annual per capita consumption: 33.8 gallons of beer
> Total beer consumption: 34.9 million gallons
> 5 yr. consumption change: +0.2%
> Bars and restaurants per 100,000 people: 226.0 (6th highest)
> Beer tax rate: $0.35 per gallon (18th highest)
5. Wisconsin
> Annual per capita consumption: 34.3 gallons of beer
> Total beer consumption: 147.1 million gallons
> 5 yr. consumption change: -2.4%
> Bars and restaurants per 100,000 people: 213.8 (9th highest)
> Beer tax rate: $0.06 per gallon (3rd lowest)
[recirclink id=443188]
4. South Dakota
> Annual per capita consumption: 38.2 gallons of beer
> Total beer consumption: 23.7 million gallons
> 5 yr. consumption change: +2.8%
> Bars and restaurants per 100,000 people: 204.4 (14th highest)
> Beer tax rate: $0.27 per gallon (22nd highest)
[in-text-ad]
3. North Dakota
> Annual per capita consumption: 38.3 gallons of beer
> Total beer consumption: 20.9 million gallons
> 5 yr. consumption change: -10.3%
> Bars and restaurants per 100,000 people: 216.2 (8th highest)
> Beer tax rate: $0.39 per gallon (17th highest)
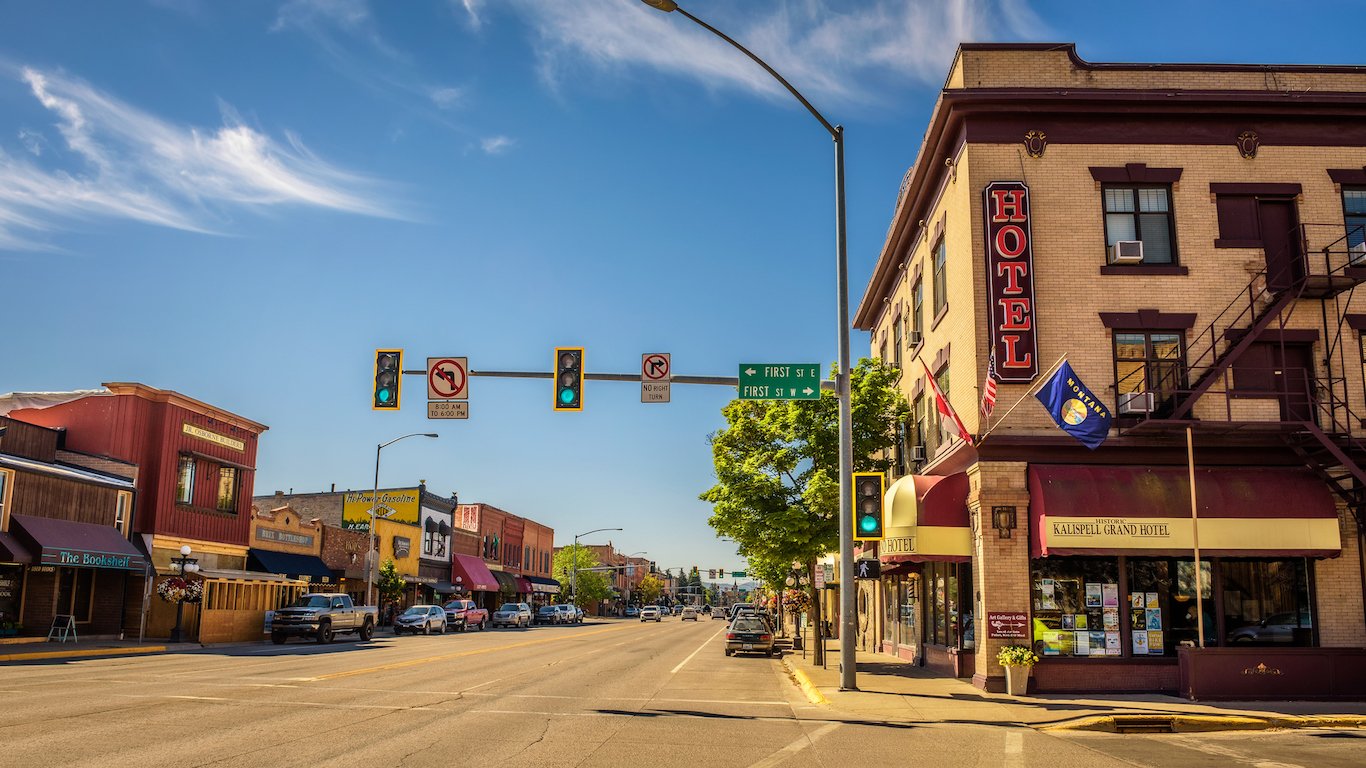
2. Montana
> Annual per capita consumption: 39.4 gallons of beer
> Total beer consumption: 30.8 million gallons
> 5 yr. consumption change: +1.4%
> Bars and restaurants per 100,000 people: 257.5 (the highest)
> Beer tax rate: $0.14 per gallon (11th lowest)
[nativounit]
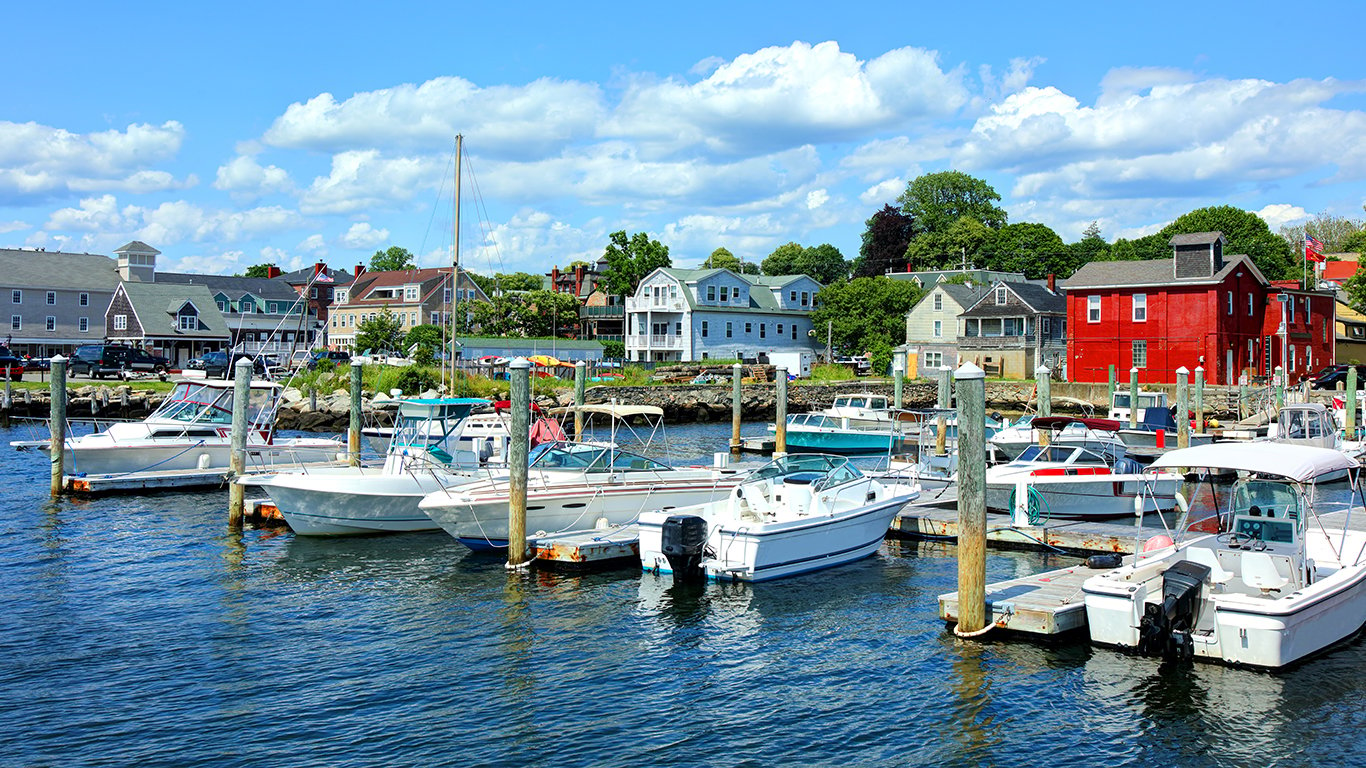
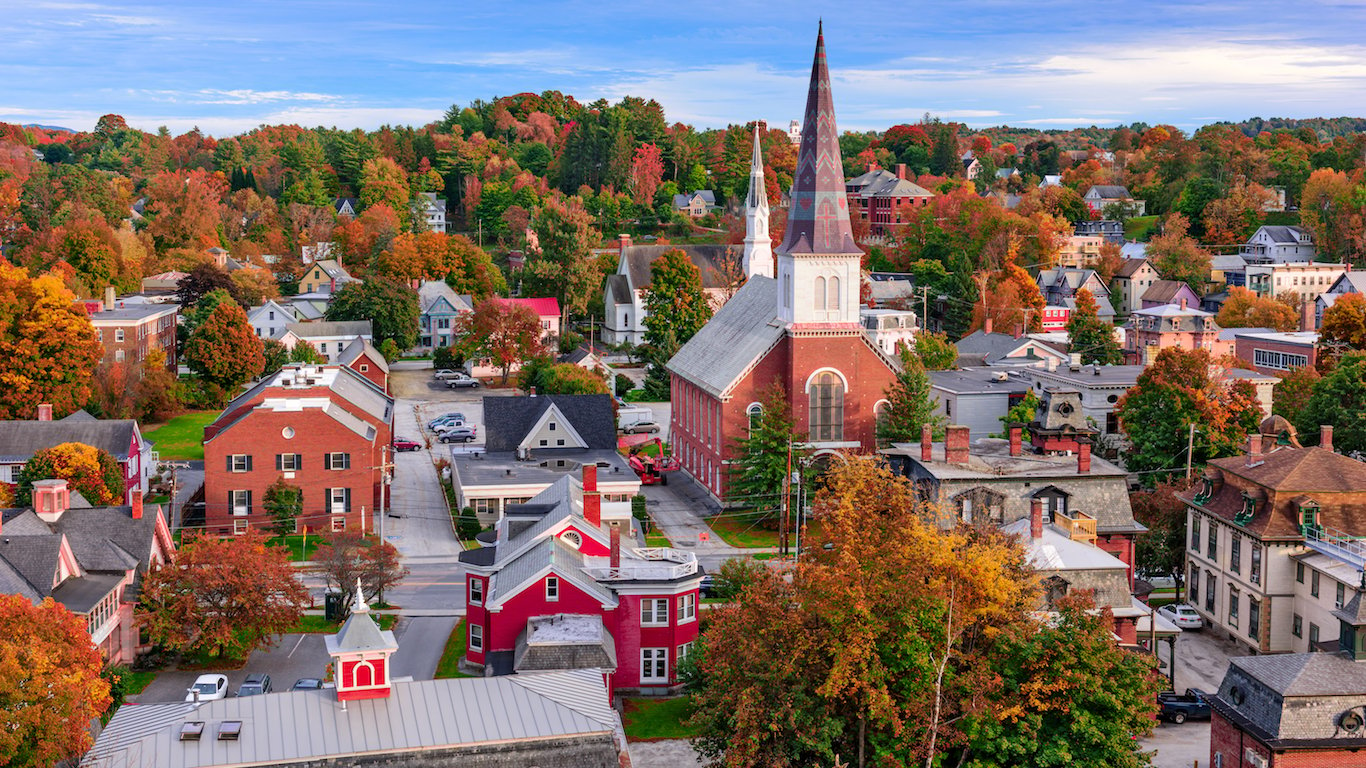
1. New Hampshire
> Annual per capita consumption: 40.6 gallons of beer
> Total beer consumption: 41.8 million gallons
> 5 yr. consumption change: -3.5%
> Bars and restaurants per 100,000 people: 213.0 (10th highest)
> Beer tax rate: $0.30 per gallon (21st highest)
Detailed Findings & Methodology
Many of the states at the top of the list of the biggest beer drinkers should not come as a surprise to those even slightly familiar with the history of brewing in the United States. Wisconsin, for example, which is fifth on this list, has produced some of the nation’s most popular breweries, including Miller, Milwaukee, and Pabst. Vermont, which ranks in the top 10, has the most craft breweries in the country. The presence of these industries indicate a strong cultural connection to beer, which likely leads to higher consumption rates.
Cultural influences can also partially account for low consumption rates in some states. Utah, which has by far the lowest annual beer consumption rate per capita, is also home to the largest share of members of the Church of Latter Day Saints, a religion that expressly forbids consumption of alcohol.
Though consumption figures are not available per state, this measure of shipments of beer per adult is meant to be a proxy for beer drinking in each state. At least one important factor is likely distorting how close shipments per capita reflect actual consumption per capita in certain states — out-of-state buyers.
In New Hampshire, which ranks first on this list at 40.6 gallons per adult consumed in 2017, there is no sales tax. This means that residents from nearby Vermont, Massachusetts, and Maine can travel to the state to buy cheaper beer, and they frequently do. The New Hampshire Liquor Commission estimates that roughly half of the state’s beer, wine, and spirits sales are by out-of-state buyers.
One of the most immediate risks associated with excessive drinking is fatal motor vehicle accidents. Nationwide, 29% of all driving deaths involve alcohol. In each of the nine states consuming the most beer, the alcohol-related driving death rate is higher than the national rate. In North Dakota, the state with the third highest beer consumption rate, 48.1% of driving deaths are alcohol related, the largest share of any state.
To identify the states drinking the most beer, 24/7 Wall St. reviewed beer shipments in each state per resident 21 years and older in 2017 with data provided by According to Beer Marketer’s Insights, a brewing industry trade publisher, and the U.S. Census Bureau. We also reviewed data from the Centers for Disease Control and Prevention on excessive drinking rates and alcohol-related death figures. Beer excise tax rates as well as sales tax rates came from the Tax Foundation, an independent tax policy research organization. The share of the population living in rural localities came from the U.S. Census Bureau, and alcohol impaired driving deaths came from the National Highway Transportation Safety Administration’s Fatality Analysis Reporting System.
Contact [email protected] for any questions or corrections.