 About 213,029 barrels of beer, or 6.6 billion gallons, were shipped into the United States in 2013, down slightly from the year before. U.S. beer shipments, used to capture consumption levels, fell slightly from 28.3 gallons per drinking-age adult in 2012 to 27.6 gallons in 2013.
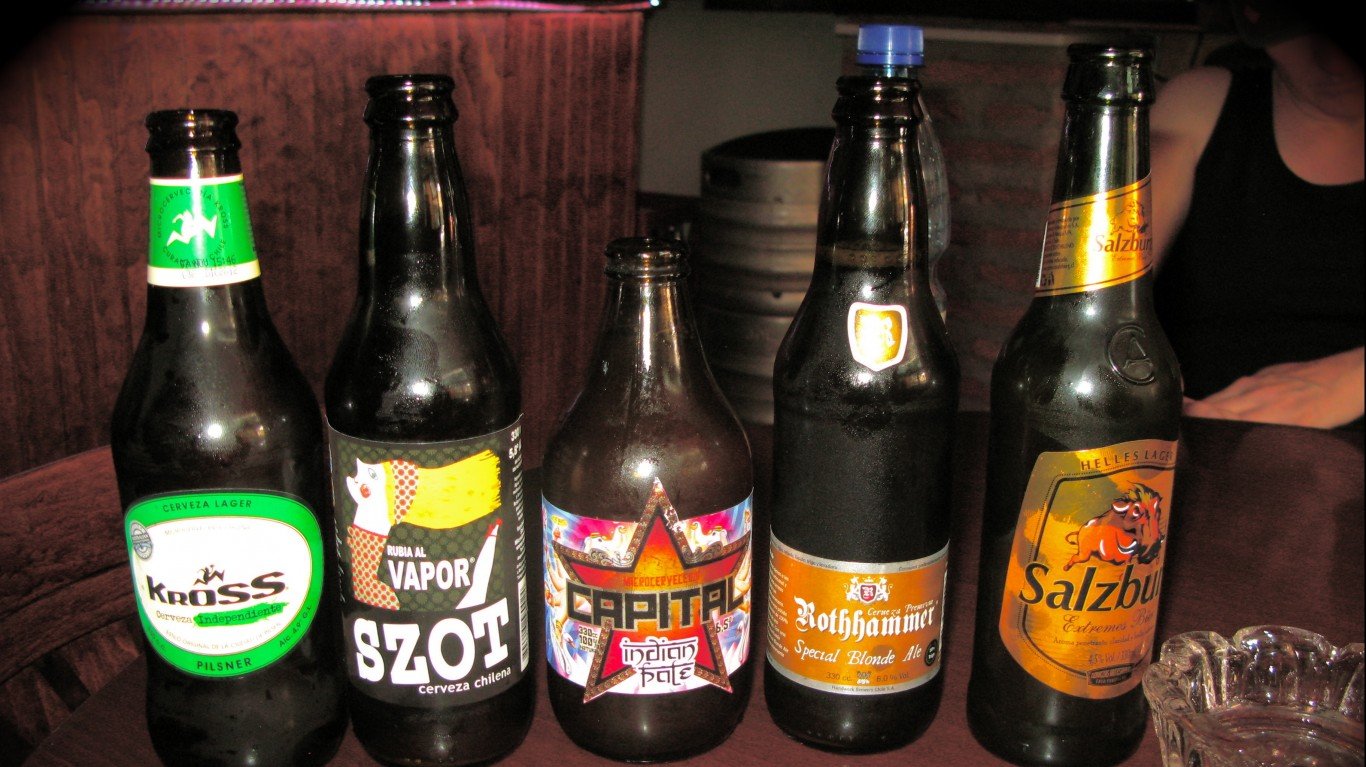
Despite declining across the United States, beer consumption remains quite high in some states. According to a recent study from Beer Marketer’s Insights, a brewing industry trade publisher, North Dakota residents consumed 43.6 gallons of beer per drinking-age adult in 2013, more than any other state. This was also more than double the 19.6 gallons per adult consumed in Utah, where residents drank the least beer. Based on figures from Beer Marketer’s Insights, these are the states where residents drink the most beer.
Click here to see the states where residents drink the most beer.
The share of Americans’ total alcohol intake from beer declined close to 10% from 2003 through 2013. Alcohol consumption from other beverages such as wine and spirits rose over that period, however, contributing to an overall increase in alcohol consumption among Americans 21 years and over. The average drinking age adult consumed the equivalent of 2.46 gallons of pure ethanol alcohol from all types of beers in 2013, 1.25 gallons of which came from beer.
High per capita beer consumption in a state does not necessarily mean residents drink excessively. However, the proportion of people binge drinking — the most common form of excessive drinking — tends to be higher in these states. Binge drinking is defined by the Centers for Disease Control and Prevention (CDC) as consuming four or more drinks for women and five or more drinks for men during a single sitting. Compared to the 16.8% of legal-age adults reporting binge drinking nationally, a higher percentage of adults reported the habit in seven of the states. These were also among the highest rates of binge drinking.
The states with the highest beer consumption rates also had high rates of heavy drinking — consuming more than two drinks per day for men and more than one drink per day for women. In Montana and Wisconsin, 7.7% and 7.8% of adults were heavy drinkers as of 2013, the third and fourth most in the United States, respectively, and well above the national rate of 6.1%.
According to Eric Shepherd, executive editor at Beer Marketer’s Insights, it can be problematic to associate high beer consumption with high binge drinking rates primarily because binge drinkers may be consuming other forms of alcohol. Also, while the beer consumption data are based on shipments, the binge drinking data are based on self-reports, and people frequently under-report their drinking habits.
Consuming excessive amounts of alcohol is associated with a range of health problems. One in 10 deaths among adults in the United States is due to excessive drinking, according to a 2014 study recently released by the CDC.
According to the study, “Excessive alcohol use is responsible for 2.5 million years of potential life lost annually, or an average of about 30 years of potential life lost for each death.” Especially high beer consumption, however, did not necessarily increase years lost per legal-age adult. Only three of the top beer drinking states exceeded the national average for years of potential life lost per 100,000 residents between 2006 and 2010.
Yet, high beer consumption levels were also associated with a higher incidence of drunk driving. Six of the 11 states drinking the most beer reported above average percentages of adults driving after having too much to drink in the past 30 days. Only about 2% of adults nationwide reported doing so.
Population density was also a factor in beer consumption rates. The average population density nationwide was 90 people per square mile. All but three of the 11 states with the highest beer consumption were less densely populated. Shepherd suggested there may be fewer entertainment options in rural areas. Not only that, but beer may also be among a shorter list of available beverage options in rural states compared to more urban states.
To identify the states drinking the most beer, 24/7 Wall St. reviewed 2013 per capita beer consumption in gallons among people 21 and over in each state provided by Beer Marketer’s Insights. Hard cider was included for the first time this year. Pure alcohol intake levels from spirits, wine, and beer also came from Beer Marketer’s Insights. The percentage of beer consumed in cans, bottles, and draft also came from Beer Marketer’s Insights. Consumption is based on shipment volumes to each state. Total deaths, alcohol-related fatalities, and estimated years of potential life lost are for the period 2006-2010 and from the Centers for Disease Control and Prevention (CDC). The percentages of adults reporting driving after excessive drinking, and drunk driving fatality statistics also came from the CDC and are for 2013. The percentages of adults reporting excellent health in 2013 also came from the CDC. We also reviewed household median income, poverty rates, and educational attainment rates from the U.S. Census Bureau’s American Community Survey. Annual unemployment rates are for 2013 and from the Bureau of Labor Statistics. Cost of living, or regional price parity (RPP), is as of 2012 and came from the Bureau of Economic Analysis (BEA).
These are the states drinking the most beer.
11. Texas
> Annual per capita consumption: 33.2
> Pct. chg. in alcohol consumption 2003-2013: -4.5% (5th largest decrease)
> Pct. binge drinkers: 16.7% (25th lowest)
> Median household income: $51,704 (23rd highest)
Alcohol intake from beer declined 12.9% in texas from 2003 through 2013, a larger drop than even the nationwide decline of 9.4%. Across all beverages, including wine beer and spirits, alcohol intake decline as well, by 4.5% — this was the fifth largest total decline. Still, the average Texas resident 21 years and over consumed 33.2 gallons of beer in 2013, tied for the 10th highest beer consumption nationwide. More people died by crashes involving drunk drivers in Texas between 2003 and 2012 than in any other state, at a total of 13,138. The rate of death due to drunk driving of 4.9 per 100,000 people was also among the higher rates nationwide.
ALSO READ: States With the Fastest Growing Economies
10. Mississippi
> Annual per capita consumption: 33.2
> Pct. chg. in alcohol consumption 2003-2013: -1.7% (11th largest decrease)
> Pct. binge drinkers:12.4% (5th lowest)
> Median household income: $37,963 (the lowest)
Drinking-age Mississippians consumed 33.2 gallons of beer each in 2013, tied for the 10th highest state per capita consumption, and well above the typical level of 27.7 gallons nationwide. On average, each resident consumed 2.5 less gallons in 2013 than in 2009, roughly in line with the per capita beer consumption decline of 1.8 gallons across the country over that period. Nationwide, most drinkers preferred canned beer. Mississippians were no exception, with canned beer accounting for nearly 58% of consumption. However, Mississippians were far less likely to drink draft beer than Americans nationwide. Just 2.1% of drinking-age state residents drank draft beer versus 10% of Americans. Like several other states drinking the most beer per capita, the cost of living was relatively low. The cost of living in Mississippi, in fact, was the least expensive compared with other states, at nearly 14% lower than the national average.
9. Nebraska
> Annual per capita consumption: 34.1
> Pct. chg. in alcohol consumption 2003-2013: 6.8% (13th largest increase)
> Pct. binge drinkers:20.0% (7th highest)
> Median household income: $51,440 (25th highest)
As in nearly all states drinking the most beer, Nebraskans were far more likely to binge drink than other Americans. One in five residents reported a binge drinking habit, the seventh highest proportion nationwide. While binge drinking includes beverages apart from beer, the state’s spirits consumption was also above average. The CDC has associated a range of negative health outcomes and economic costs to binge drinking, including premature death and higher medical bills. More than 19% of Nebraska residents rated their general health as excellent, however, one of the higher percentages. Still, they were also the most likely compared to people in other states to report driving after having too much to drink. While alcohol consumption from beer declined in the state, total alcohol consumption rose by just under 7%, with alcohol intake from spirits rising by more than 36% over the 10-year period.
ALSO READ: States With the Strongest Unions
8. Maine
> Annual per capita consumption: 34.8
> Pct. chg. in alcohol consumption 2003-2013: 11.4% (4th largest increase)
> Pct. binge drinkers:17.2% (18th highest)
> Median household income: $46,974 (16th lowest)
Unlike all but six other states, beer consumption increased in Maine since 2009, with an average drinking-age resident consuming nearly 3 more gallons of beer in 2013 than they did in 2009. This was the largest increase nationwide, and it stood in stark contrast with the nationwide per capita decrease of 1.8 gallons. Between 2003 and 2013, alcohol consumption from beer in the state increased by 12.1%, the largest increase of any state over that time. As in other states, the higher per capita beer consumption in Maine may be partly due to low population density. There were just over 43 people per square mile in the state, less than half the national average density of 90.2 people per square mile.
7. Nevada
> Annual per capita consumption: 34.9
> Pct. chg. in alcohol consumption 2003-2013: -10.1% (the largest decrease)
> Pct. binge drinkers:15.2% (17th lowest)
> Median household income: $51,230 (25th lowest)
Nevada per capita beer consumption in 2013 was nearly 35 gallons per person, well above the consumption level in the Mountain region, where the average annual consumption was nearly 31 gallons. However, this doesn’t necessarily mean that Nevada residents are heavier beer drinkers, as tourists to the Las Vegas region are likely responsible for a large proportion of the state’s annual alcohol intake. Drinkers in the state preferred bottled beer more than their peers in other states, with bottled beer accounting for 42.6% of all beer consumption, the sixth highest percentage in the country. While people in the state drink more beer than the vast majority of Americans, per capita beer consumption in the state fell by 4.6 gallons from 2009, the largest drop of any state in the country.
ALSO READ: 9 Cities Running Out of Water
6. Wisconsin
> Annual per capita consumption: 35.8
> Pct. chg. in alcohol consumption 2003-2013: 3.9% (22nd largest increase)
> Pct. binge drinkers:22.5% (2nd highest)
> Median household income: $51,467 (24th highest)
In addition to drinking more beer than people in all but a handful of other states, 22.5% of Wisconsin adults reported binge drinking, the second highest percentage after only North Dakota. Drinking-age state residents were also among the nation’s most likely to be heavy drinkers — 7.8% reported drinking alcohol every day, the third highest percentage. In addition, more than 3% of adults said they had driven in the past 30 days after drinking too much, the fourth highest figure. Beer consumption fell in the nation by roughly 9.4% between 2003 and 2013. The trend in Wisconsin was no different, with alcohol consumption from beer falling by 7.5% over the same period. However, total alcohol consumption actually went up over that decade, with a 16.5% increase in alcohol use from spirits, and a 26.5% increase from wine.
5. Vermont
> Annual per capita consumption: 35.9
> Pct. chg. in alcohol consumption 2003-2013: 16.4% (the largest increase)
> Pct. binge drinkers:17.1% (21st highest)
> Median household income: $52,578 (20th highest)
Vermonters 21 and over consumed 35.9 gallons of beer in 2013 on average, 1.2 gallons more than they did in 2009, the third largest increase — and Vermont was one of only six states where beer consumption did not decline over that period. Looking at a longer time span: from 2003 to 2013, only Vermont and one other state — Maine — saw an increase in alcohol consumption from beer. From all beverages, alcohol intake in Vermont increased the most over that period. Like most states drinking the most beer, Vermont is relatively rural — low population density has been associated with high propensities to drink more alcohol. Despite the high per capita beer consumption, nearly 22% of residents reported excellent health, the fourth highest such figure in the country.
ALSO READ: America’s Least Healthy Fast-Food Chains
4. South Dakota
> Annual per capita consumption: 38.2
> Pct. chg. in alcohol consumption 2003-2013: 12.0% (3rd largest increase)
> Pct. binge drinkers:19.2% (10th highest)
> Median household income: $48,947 (22nd lowest)
Each South Dakotan consumed more than 38 gallons of beer on average in 2013, well above the national and regional per capita averages of 27.7 gallons and 33.5 gallons, respectively. As was the case nationwide, alcohol intake from beer declined in South Dakota, although by only 0.6%. With shares of total consumption from spirits and wine increasing 36.8% and 29.4% respectively — the seventh and fourth highest figures — overall consumption increased by 12% from 2003. This was the third largest overall increase. Living in sparsely populated areas seems to increase the likelihood of beer consumption, as most states drinking the most beer had below average population densities. There were just over 11 people per square mile in South Dakota, nearly the lowest population density nationwide.
3. Montana
> Annual per capita consumption: 40.5
> Pct. chg. in alcohol consumption 2003-2013: 4.0% (21st largest increase)
> Pct. binge drinkers:20.8% (6th highest)
> Median household income: $46,972 (15th lowest)
Residents in the Mountain region of the United States drank an average of 30.6 gallons of beer per capita, higher than the national average of 27.7 gallons. Montana’s drinking-age residents drank even more, consuming an average of 40.5 gallons of beer per person annually. The high prevalence of beer consumption in Montana likely contributed to higher rates of drunk driving. While less than 2% of American adults said they had driven after drinking excessively in the past 30 days, 3.4% of Montana residents reported doing so, the highest percentage nationwide. Perhaps as a result, there were 9.4 deaths per 100,000 people from alcohol-related car crashes, second only to North Dakota.
ALSO READ: 10 States With the Most Gun Violence
2. New Hampshire
> Annual per capita consumption: 42.2
> Pct. chg. in alcohol consumption 2003-2013: 7.3% (12th largest increase)
> Pct. binge drinkers:16.8% (24th highest)
> Median household income: $64,230 (7th highest)
New Hampshire’s beer consumption was the highest in the nation in 2009, 2010, and 2011. While consumption has fallen slightly from those years, residents drank an average of 42.2 gallons of beer in 2013, second only to North Dakota. In contrast, New England residents consumed an average of 31 gallons of beer that year. The state had the highest alcohol intake from wine, and by far the highest intake from spirits. This may not accurately reflect drinking habits among long-term residents, as New Hampshire’s low taxes and cheap alcohol attract many Americans from other states. Binge drinking was roughly in line with the national average, unlike most other states drinking the most beer. Binge drinking is strongly associated with negative health outcomes, and the low prevalence in New Hampshire compared to other states where people drink the most beer may partly explain the relatively good health among residents. Nearly 22% of residents reported excellent health, the fifth highest percentage nationwide. The state also had the lowest poverty rate in the country at 8.7%.
1. North Dakota
> Annual per capita consumption: 43.6
> Pct. chg. in alcohol consumption 2003-2013: 16.3% (2nd largest increase)
> Pct. binge drinkers:23.8% (the highest)
> Median household income: $55,759 (19th highest)
North Dakota led the nation for beer drinking, with each drinking-age resident consuming 43.6 gallons in 2013 on average, an increase of 1.6 gallons from 2009, the second largest such increase. The state’s beer consumption was the highest in the West North Central region of the country, which at 33.5 gallons was itself the highest average consumption level compared to the nine other regions reviewed. North Dakota also led the nation in binge drinking, with nearly 24% of adults reporting such excessive alcohol consumption.
While the number of jobs in North Dakota dropped by 5,300 from April through May this year, economic factors can partly account for the state’s high beer consumption level. Not only was the cost of living nearly 10% lower than the national average, but also incomes in the state have risen dramatically in recent years as a result of the regional oil boom. In addition, the energy sector has attracted especially men, who are far more likely than women to binge drink. There were more than 11 persons per 100,000 people killed in an alcohol-related car crash, the highest rate in the country.
Contact [email protected] for any questions or corrections.