Each year, hundreds of thousands of Americans leave their hometowns and move to a new place. Some go for education and others for career opportunities. Some elderly Americans head to warmer climates to enjoy their retirement. No matter the reason, moving is rarely easy, and often can be rather expensive.
Packing up all of one’s belongings and relocating to a different part of the state or the country is not an option for everyone. Moving is challenging, time consuming, and costly. The average cost of moving to a large city is at least $1,200. In one case the average is more than $1,500.
And that figure only includes direct moving expenses such as truck rental, hired help, and fuel for the journey. That figure does not take into account the largest single expense when moving to a new place — the price of place being moved into. The average price of the security deposit and one month’s rent in the largest U.S. cities is at least $1,500 dollars — and more than double that amount in many cases.
24/7 Wall St. reviewed average moving costs and average first month’s rents and security deposits in America’s 100 largest metro areas to determine the 25 most expensive cities to move to.
Click here to see the 25 most expensive cities to move to.
Click here to see our detailed findings and methodology.

25. Orlando-Kissimmee-Sanford, Florida
> Avg. total moving cost: $3,741
> 1st month’s rent and deposit: $2,482
> Median household income: $44,007
> Population change from migration (2010-2017): 11.9%
[in-text-ad]

24. Las Vegas-Henderson-Paradise, Nevada
> Avg. total moving cost: $3,750
> 1st month’s rent and deposit: $2,492
> Median household income: $50,882
> Population change from migration (2010-2017): 7.7%
[recirclink id=444492]

23. Colorado Springs, Colorado
> Avg. total moving cost: $3,837
> 1st month’s rent and deposit: $2,572
> Median household income: $56,227
> Population change from migration (2010-2017): 5.6%
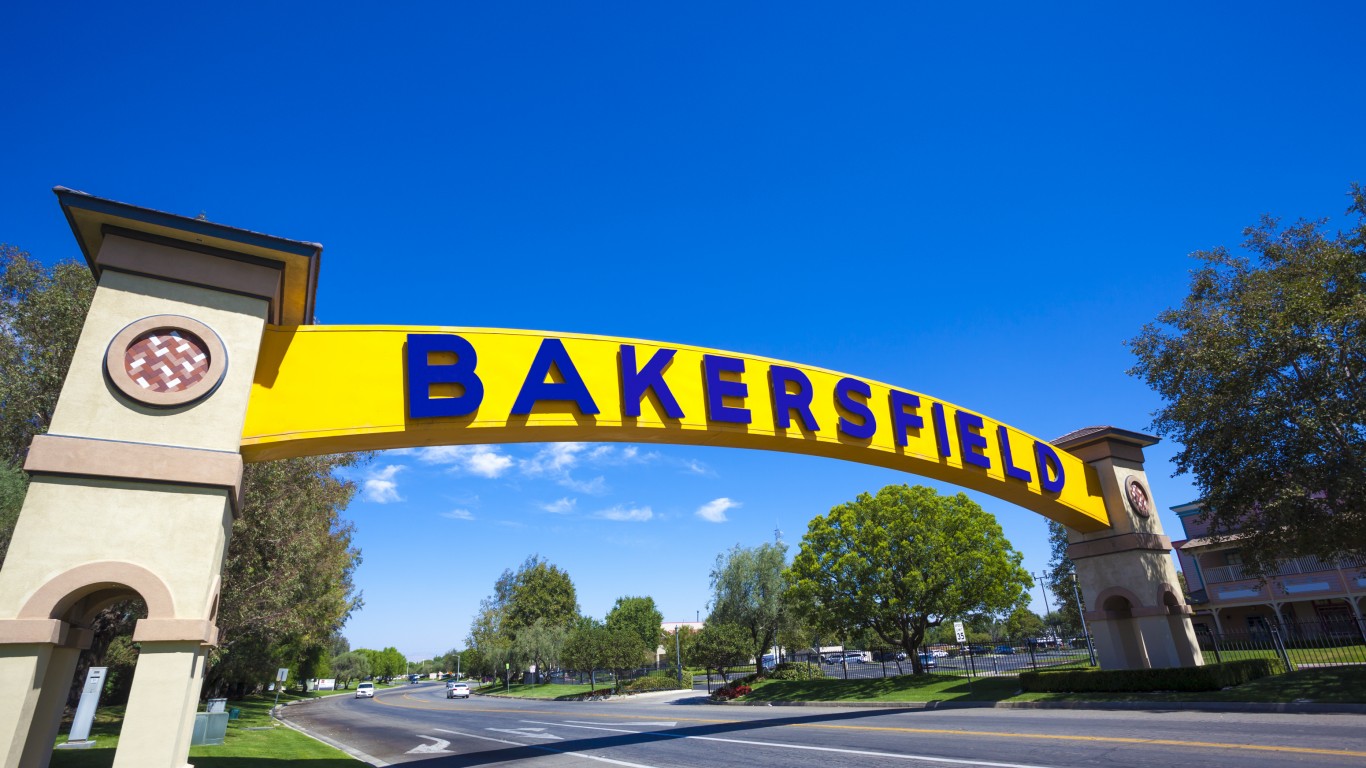
22. Bakersfield, California
> Avg. total moving cost: $3,853
> 1st month’s rent and deposit: $2,522
> Median household income: $58,669
> Population change from migration (2010-2017): -0.8%
[in-text-ad-2]

21. Minneapolis-St. Paul-Bloomington, Minnesota
> Avg. total moving cost: $3,888
> 1st month’s rent and deposit: $2,586
> Median household income: $52,611
> Population change from migration (2010-2017): 2.4%

20. Madison, Wisconsin
> Avg. total moving cost: $3,891
> 1st month’s rent and deposit: $2,626
> Median household income: $56,464
> Population change from migration (2010-2017): 3.9%
[in-text-ad]

19. New Haven-Milford, Connecticut
> Avg. total moving cost: $3,898
> 1st month’s rent and deposit: $2,614
> Median household income: $38,126
> Population change from migration (2010-2017): -1.3%
[recirclink id=444468]

18. Sacramento–Roseville–Arden-Arcade, California
> Avg. total moving cost: $3,938
> 1st month’s rent and deposit: $2,650
> Median household income: $52,071
> Population change from migration (2010-2017): 4.3%
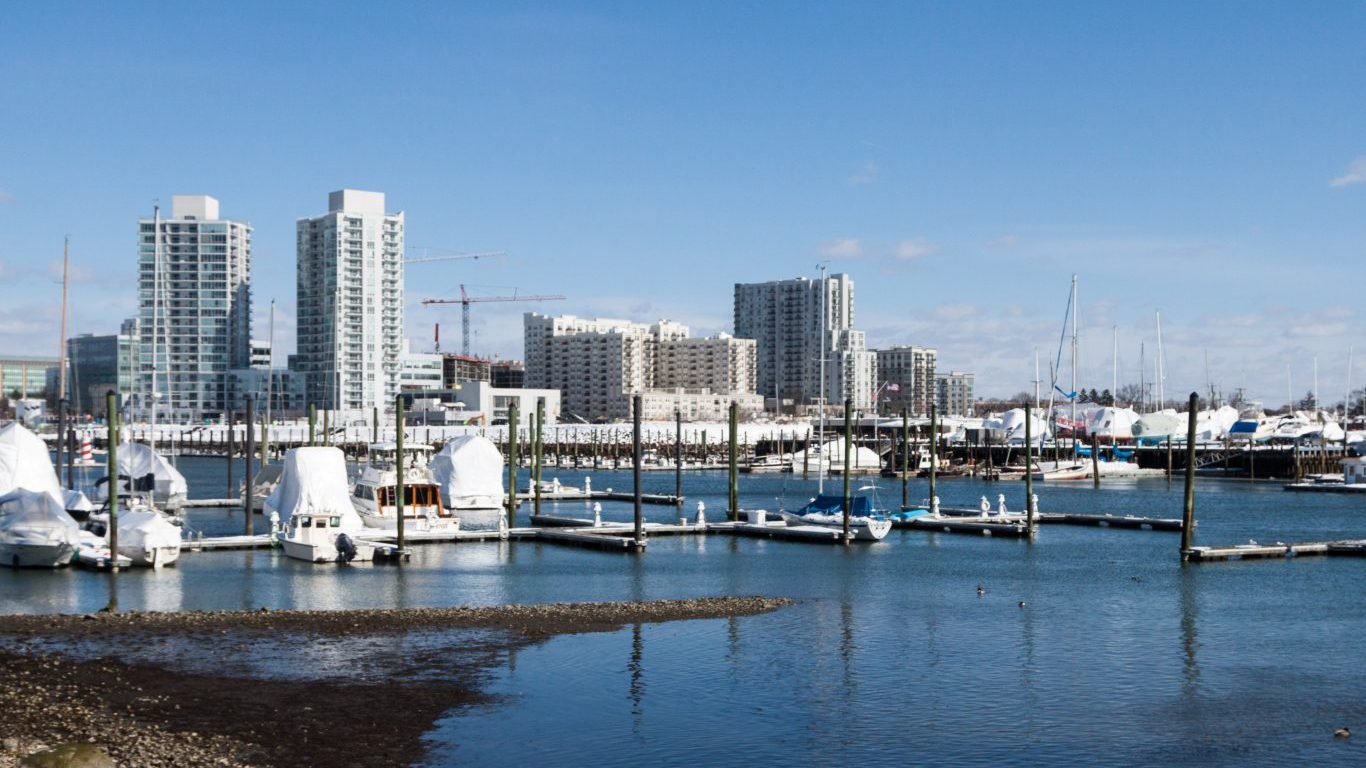
17. Bridgeport-Stamford-Norwalk, Connecticut
> Avg. total moving cost: $4,069
> 1st month’s rent and deposit: $2,632
> Median household income: $43,137
> Population change from migration (2010-2017): 0.8%
[in-text-ad-2]

16. Denver-Aurora-Lakewood, Colorado
> Avg. total moving cost: $4,074
> 1st month’s rent and deposit: $2,776
> Median household income: $56,258
> Population change from migration (2010-2017): 7.3%
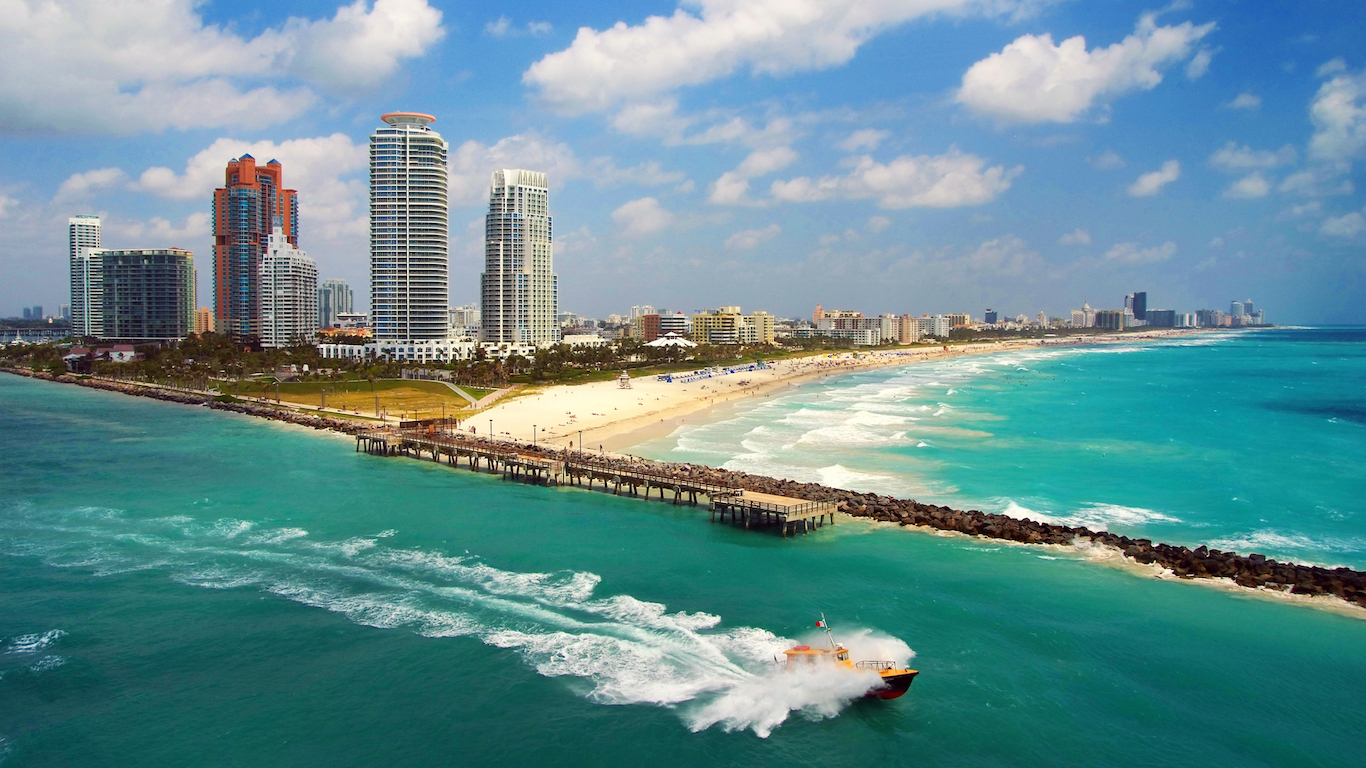
15. Miami-Fort Lauderdale-West Palm Beach, Florida
> Avg. total moving cost: $4,074
> 1st month’s rent and deposit: $2,792
> Median household income: $31,642
> Population change from migration (2010-2017): 7.4%
[in-text-ad]

14. Portland-Vancouver-Hillsboro, Oregon
> Avg. total moving cost: $4,087
> 1st month’s rent and deposit: $2,768
> Median household income: $58,423
> Population change from migration (2010-2017): 6.0%
[recirclink id=444391]

13. Charleston-North Charleston, South Carolina
> Avg. total moving cost: $4,106
> 1st month’s rent and deposit: $2,854
> Median household income: $57,603
> Population change from migration (2010-2017): 10.6%

12. Austin-Round Rock, Texas
> Avg. total moving cost: $4,154
> 1st month’s rent and deposit: $2,890
> Median household income: $60,939
> Population change from migration (2010-2017): 13.3%
[in-text-ad-2]

11. Boston-Cambridge-Newton, Massachusetts
> Avg. total moving cost: $4,185
> 1st month’s rent and deposit: $2,854
> Median household income: $58,516
> Population change from migration (2010-2017): 3.6%
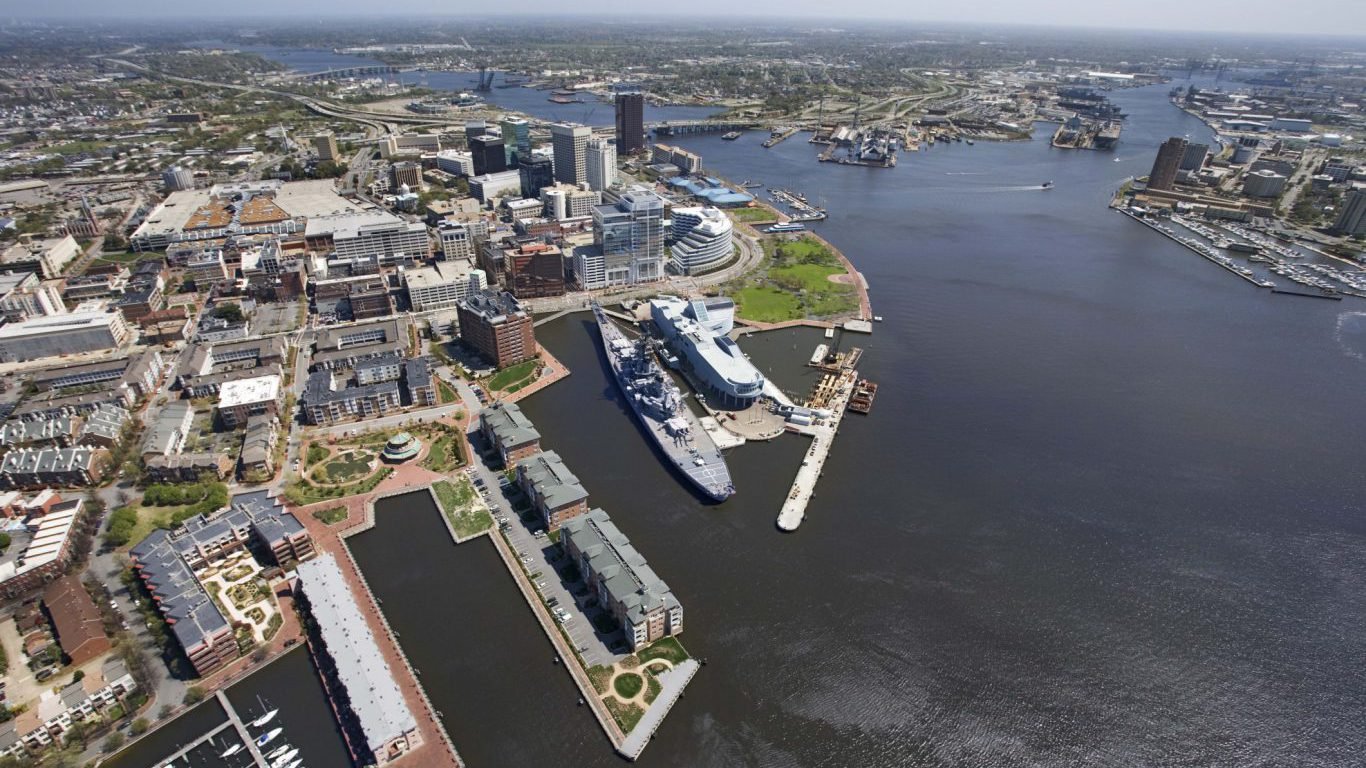
10. Virginia Beach-Norfolk-Newport News, Virginia
> Avg. total moving cost: $4,247
> 1st month’s rent and deposit: $2,988
> Median household income: $67,719
> Population change from migration (2010-2017): -1.0%
[in-text-ad]
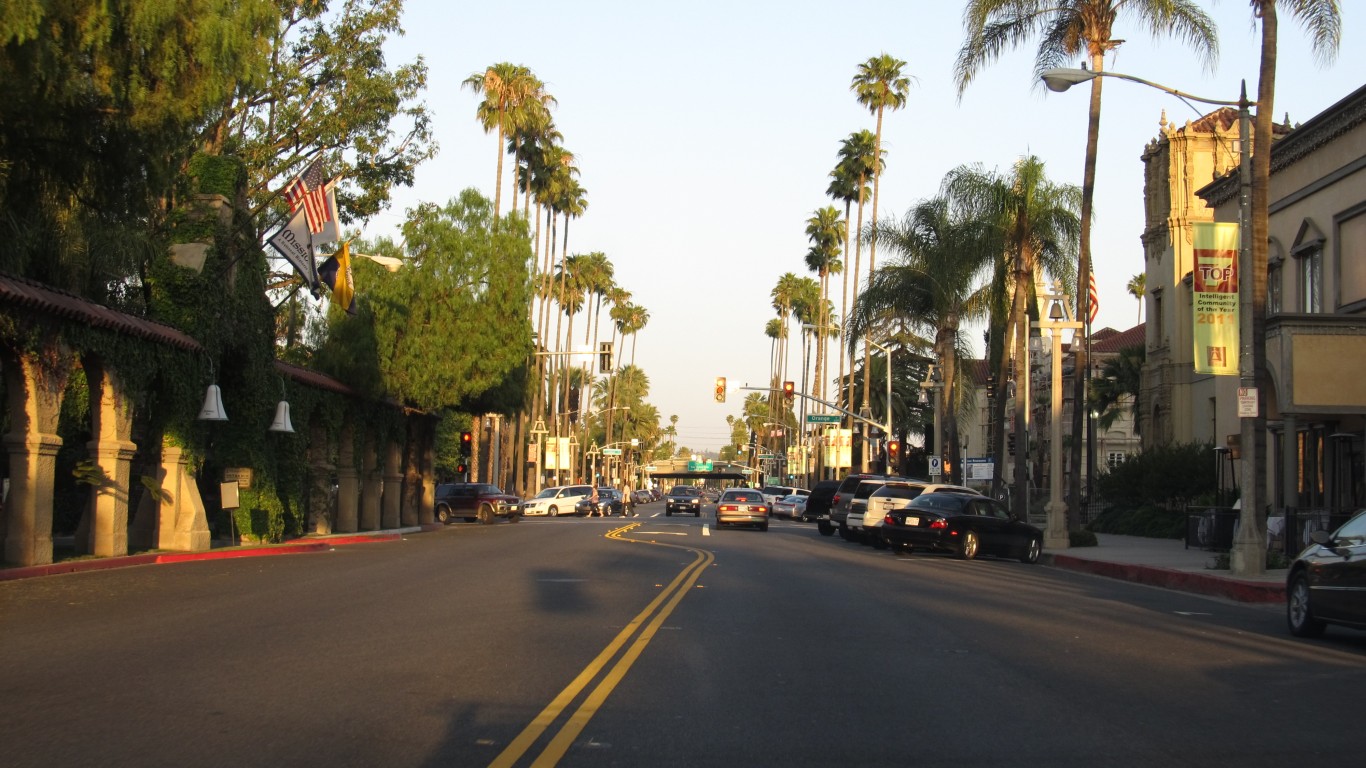
9. Riverside-San Bernardino-Ontario, California
> Avg. total moving cost: $4,392
> 1st month’s rent and deposit: $3,118
> Median household income: $58,979
> Population change from migration (2010-2017): 2.7%
[recirclink id=444326]

8. New York-Newark-Jersey City, New York
> Avg. total moving cost: $4,515
> 1st month’s rent and deposit: $2,988
> Median household income: $55,191
> Population change from migration (2010-2017): -0.1%

7. Washington-Arlington-Alexandria, District of Columbia
> Avg. total moving cost: $4,602
> 1st month’s rent and deposit: $3,286
> Median household income: $72,935
> Population change from migration (2010-2017): 3.8%
[in-text-ad-2]

6. Seattle-Tacoma-Bellevue, Washington
> Avg. total moving cost: $4,873
> 1st month’s rent and deposit: $3,562
> Median household income: $74,458
> Population change from migration (2010-2017): 7.0%

5. Los Angeles-Long Beach-Anaheim, California
> Avg. total moving cost: $4,904
> 1st month’s rent and deposit: $3,574
> Median household income: $51,538
> Population change from migration (2010-2017): -0.7%
[in-text-ad]
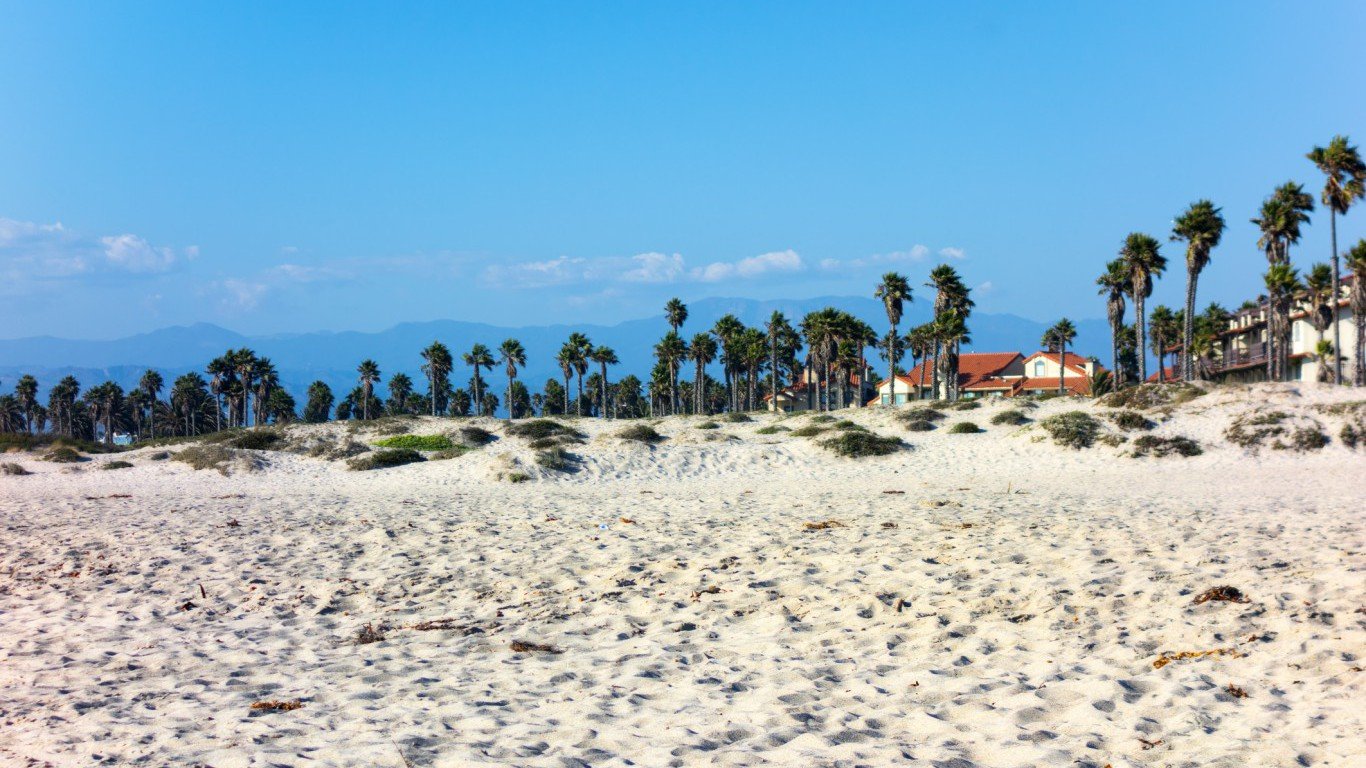
4. Oxnard-Thousand Oaks-Ventura, California
> Avg. total moving cost: $4,927
> 1st month’s rent and deposit: $3,596
> Median household income: $61,709
> Population change from migration (2010-2017): -0.6%
[recirclink id=444046]

3. San Diego-Carlsbad, California
> Avg. total moving cost: $5,174
> 1st month’s rent and deposit: $3,828
> Median household income: $68,117
> Population change from migration (2010-2017): 2.3%

2. San Jose-Sunnyvale-Santa Clara, California
> Avg. total moving cost: $5,523
> 1st month’s rent and deposit: $4,192
> Median household income: $90,303
> Population change from migration (2010-2017): 3.0%
[in-text-ad-2]

1. San Francisco-Oakland-Hayward, California
> Avg. total moving cost: $5,661
> 1st month’s rent and deposit: $4,330
> Median household income: $87,701
> Population change from migration (2010-2017): 4.9%
Detailed findings & methodology:
Moving can be very expensive anywhere in the country, but prices are the highest for those moving to the West Coast. Of the 25 metro areas with the highest moving costs, 10 are in West Coast states, with eight in California. In fact, all the top five most expensive places to move to are in the Golden State.
Outside of California, Connecticut, Colorado, and Florida are the only states with more than one metro area among the 25 most expensive cities to move to — each with two cities. The other metro areas are scattered across the country in states like Texas, South Carolina, Minnesota, New York, and Nevada.
While moving costs to these 25 places are very high, they may offer incentives other cities with cheaper moving costs do not. For one, the median household income in most of the cities on the list is well above the national median of $55,322 a year. The higher incomes may be one of the reasons that people are flocking to these areas — despite the high cost of getting there. Across the country, the average population change due to migration over the past seven years was 2.2%. Among these 25 metro areas, 18 have a greater rate of net migration.
24/7 Wall St. determined the 25 cities with the highest moving costs by combining the median price of one month’s rent plus a security deposit and the estimated moving cost to the 100 largest U.S. metropolitan areas. The rent is for a three-bedroom housing unit, and the security deposit is equivalent to one month’s rent. The estimated moving cost is within the most populated zip code in the principal city of each metro area.
The median price of rent comes from the U.S. Census Bureau’s 2015 American Community Survey. The moving cost was determined using data from real estate data company Moving Inc. The 2016 median household income data and 2010-2017 population change from migration came from the U.S. Census Bureau’s American Community Survey. The Urban Honolulu metro area in Hawaii is the only place that lacked data on moving costs, so it was omitted from the list.
Contact [email protected] for any questions or corrections.