From the end of 2007 through mid-2009, the United States went through one of the worst recessions in its history. During the recession and in the months that followed, the U.S. labor market shed millions of jobs, and the unemployment rate peaked at 10%
The nation is nearing the 10-year anniversary of the official end of the recession and the beginning of the recovery. Today, after 95 months of uninterrupted job growth and unemployment falling below even pre-recession levels, it appears that the nation has more than fully recovered from the economic crisis.
However, in many major U.S. cities, the recovery has either fully stalled or has not been strong enough to offset the jobs lost during the recession.
In several dozen U.S. cities, job levels remains well below the levels before to the recession, even as total U.S. employment has increased by 5% since 2007. In these cities, unemployment remains high — even after thousands have given up looking for work and no longer count among the officially unemployed.
24/7 Wall St. identified the U.S. cities where the total number of people employed fell by at least 10% between 2007 and 2017. We excluded those cities where employment did not fall by at least 15% in the five years immediately following the start of the recession. Many of these places have faced longer-term economic issues, including high unemployment, and the recent recession only worsened matters. In addition to high unemployment, nearly all these cities struggle with such issues that plague areas with shrinking economies such as low or declining incomes.
Click here to see the cities that never recovered from the recession.
Click here to see our detailed findings and methodology.

28. Romeoville, Illinois
> 2007-2017 employment: -10.6% (21,229 to 18,969)
> 2017 unemployment: 5.5%
> 2007-2017 labor force: -9.9% (22,291 to 20,079)
> Poverty: 8.1%
> Median household income: $71,344
[in-text-ad]

27. Chester, Pennsylvania
> 2007-2017 employment: -11.3% (13,747 to 12,193)
> 2017 unemployment: 8.5%
> 2007-2017 labor force: -9.8% (14,767 to 13,325)
> Poverty: 36.9%
> Median household income: $27,217
[recirclink id=488456]
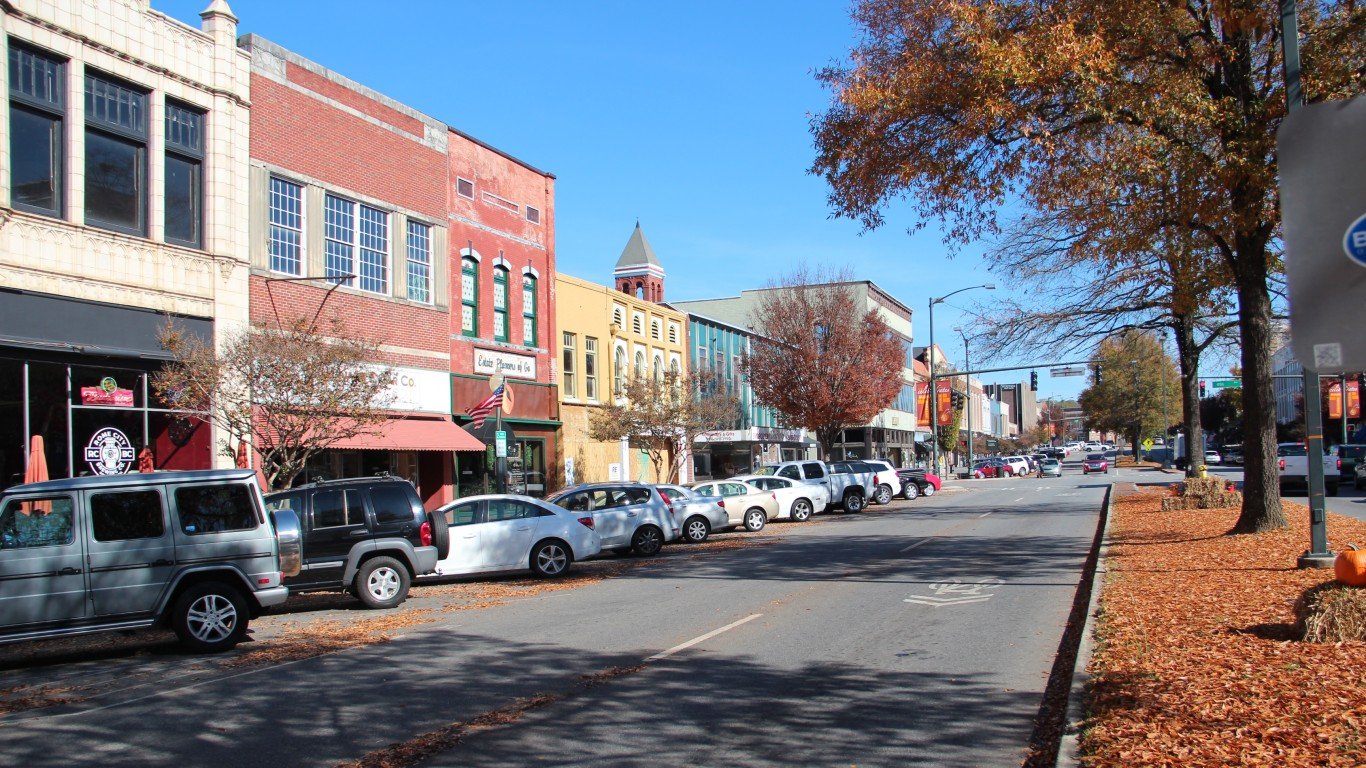
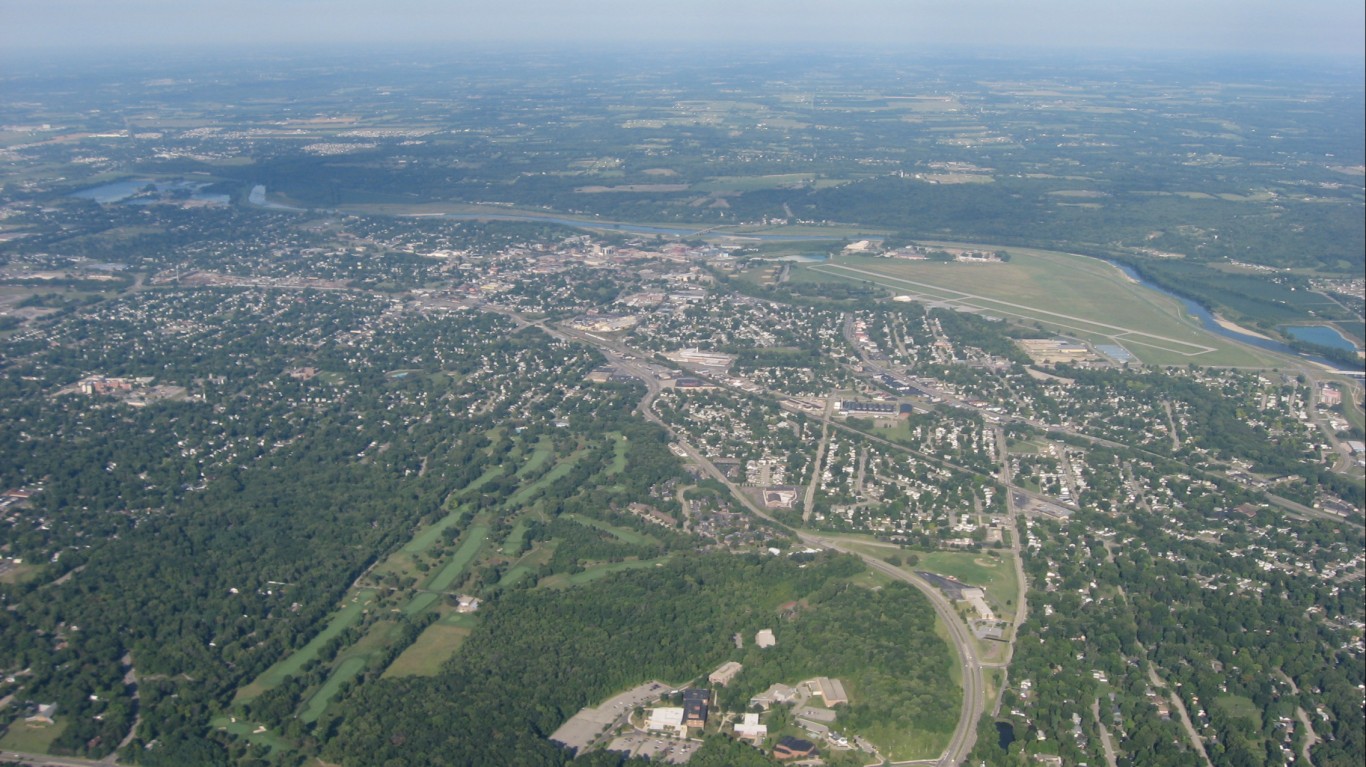
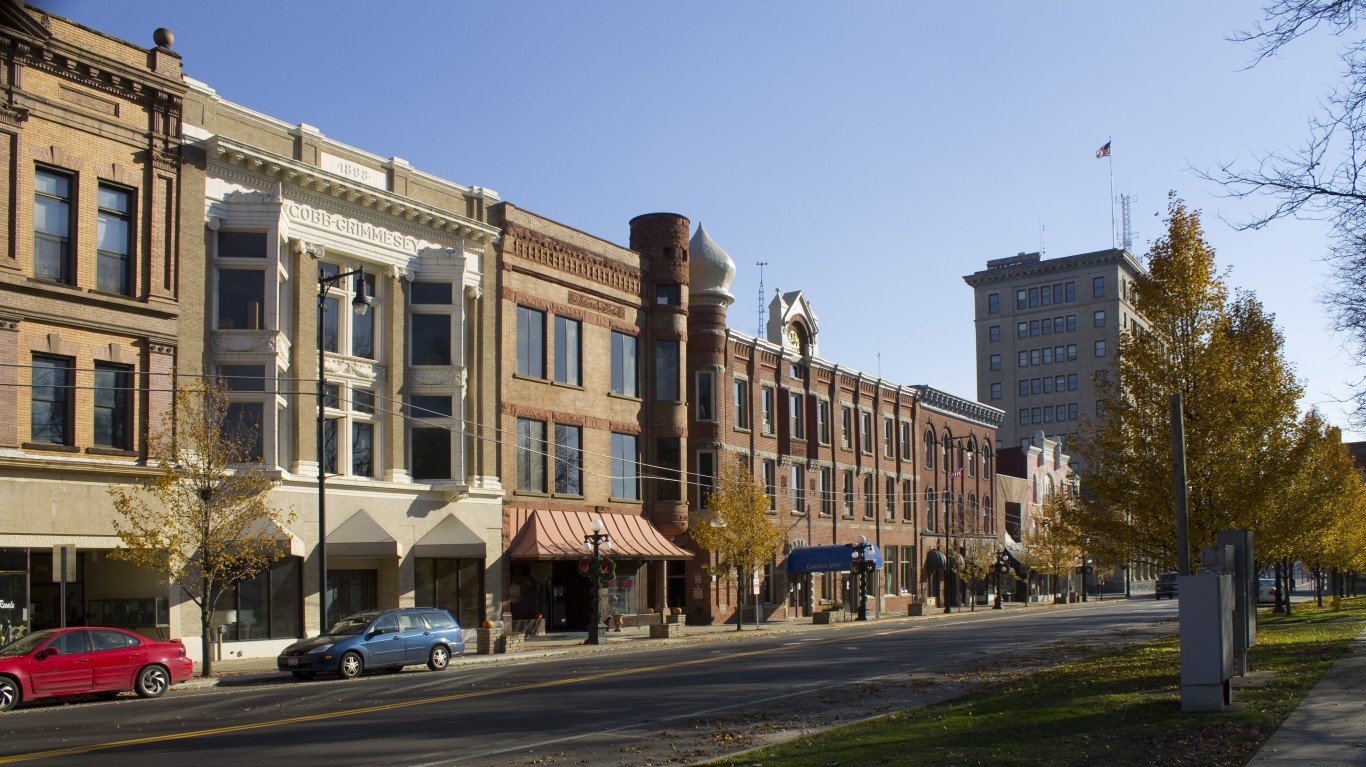
26. Rome, Georgia
> 2007-2017 employment: -11.9% (16,746 to 14,750)
> 2017 unemployment: 5.6%
> 2007-2017 labor force: -12.1% (17,761 to 15,620)
> Poverty: 26.6%
> Median household income: $36,616

25. Myrtle Beach, South Carolina
> 2007-2017 employment: -12.2% (16,556 to 14,544)
> 2017 unemployment: 5.6%
> 2007-2017 labor force: -10.9% (17,285 to 15,405)
> Poverty: 22.9%
> Median household income: $37,023
[in-text-ad-2]
24. Eastpointe, Michigan
> 2007-2017 employment: -12.2% (16,581 to 14,554)
> 2017 unemployment: 6.3%
> 2007-2017 labor force: -13.1% (17,868 to 15,529)
> Poverty: 19.4%
> Median household income: $44,240

23. East Point, Georgia
> 2007-2017 employment: -12.5% (18,411 to 16,113)
> 2017 unemployment: 6.5%
> 2007-2017 labor force: -12.1% (19,621 to 17,238)
> Poverty: 28.0%
> Median household income: $36,863
[in-text-ad]
22. Woonsocket, Rhode Island
> 2007-2017 employment: -14.4% (20,892 to 17,886)
> 2017 unemployment: 6.0%
> 2007-2017 labor force: -14.3% (22,207 to 19,032)
> Poverty: 25.1%
> Median household income: $37,235
[recirclink id=488594]
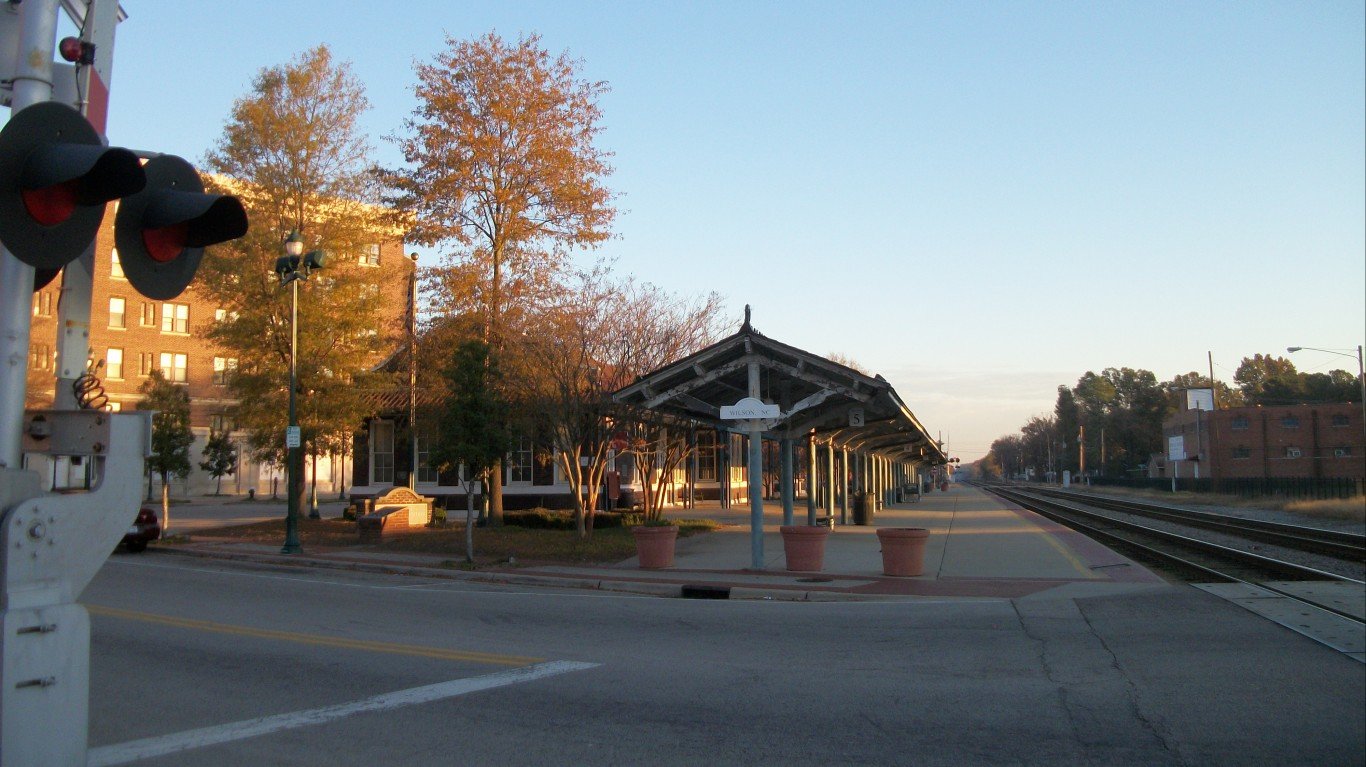
21. Wilson, North Carolina
> 2007-2017 employment: -14.4% (22,763 to 19,483)
> 2017 unemployment: 8.5%
> 2007-2017 labor force: -11.7% (24,137 to 21,302)
> Poverty: 25.4%
> Median household income: $38,046

20. Dayton, Ohio
> 2007-2017 employment: -14.5% (65,139 to 55,689)
> 2017 unemployment: 5.8%
> 2007-2017 labor force: -15.9% (70,255 to 59,114)
> Poverty: 34.5%
> Median household income: $28,745
[in-text-ad-2]
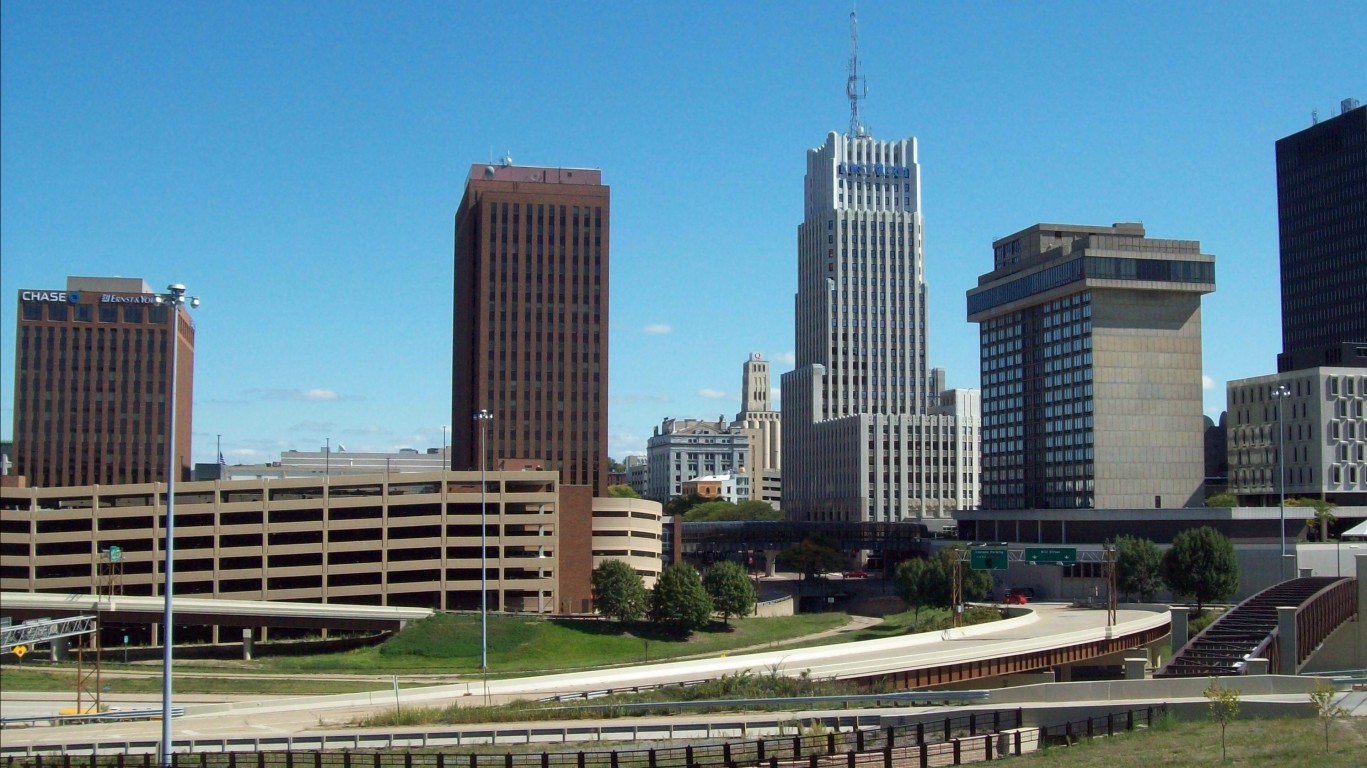
19. Akron, Ohio
> 2007-2017 employment: -14.7% (101,420 to 86,477)
> 2017 unemployment: 5.8%
> 2007-2017 labor force: -14.9% (107,865 to 91,776)
> Poverty: 25.4%
> Median household income: $35,240

18. Sandusky, Ohio
> 2007-2017 employment: -15.7% (13,190 to 11,116)
> 2017 unemployment: 6.9%
> 2007-2017 labor force: -15.6% (14,150 to 11,946)
> Poverty: 22.4%
> Median household income: $33,817
[in-text-ad]
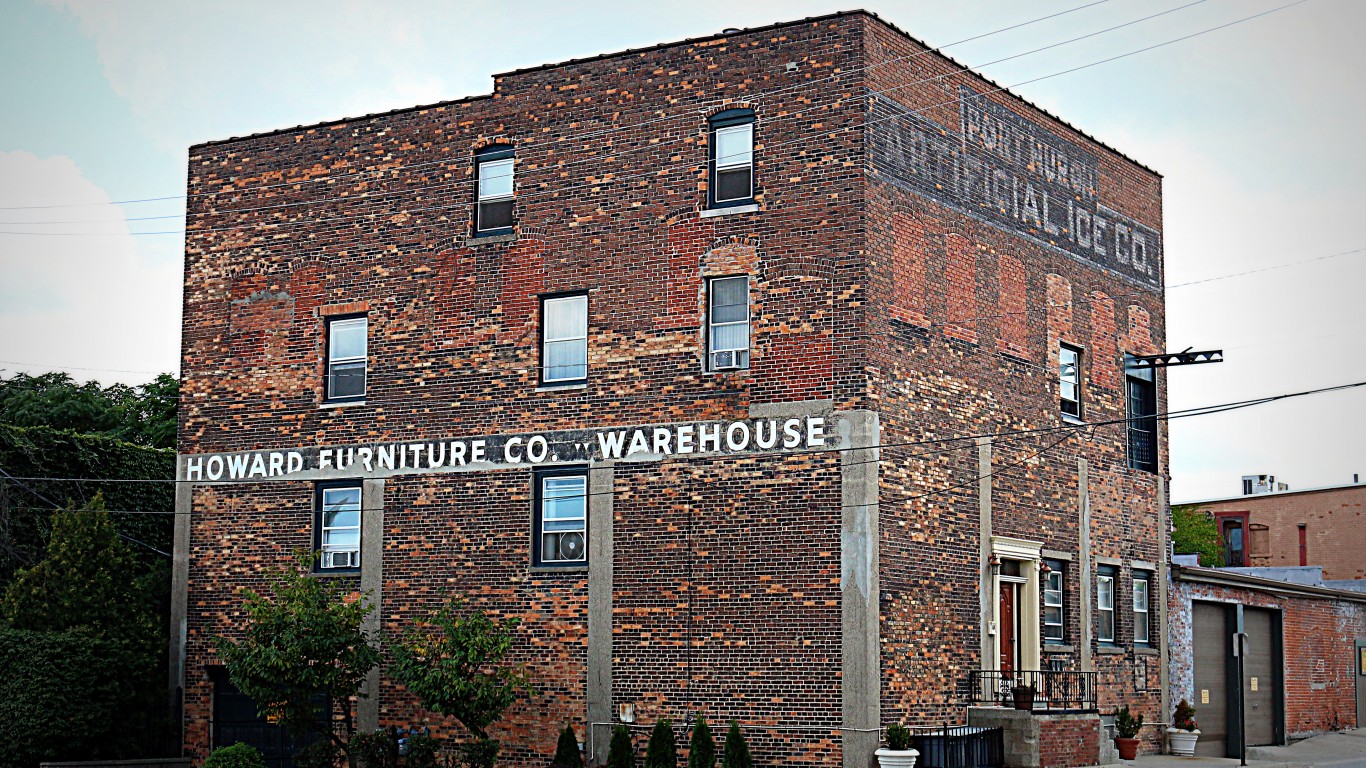
17. Port Huron, Michigan
> 2007-2017 employment: -15.7% (14,271 to 12,024)
> 2017 unemployment: 6.8%
> 2007-2017 labor force: -20.5% (16,211 to 12,895)
> Poverty: 27.8%
> Median household income: $34,592
[recirclink id=488561]

16. Jackson, Michigan
> 2007-2017 employment: -16.4% (15,586 to 13,034)
> 2017 unemployment: 7.8%
> 2007-2017 labor force: -19.3% (17,533 to 14,143)
> Poverty: 36.3%
> Median household income: $28,697
15. Middletown, Ohio
> 2007-2017 employment: -17.9% (24,274 to 19,941)
> 2017 unemployment: 5.5%
> 2007-2017 labor force: -18.3% (25,822 to 21,092)
> Poverty: 24.2%
> Median household income: $36,898
[in-text-ad-2]

14. Alton, Illinois
> 2007-2017 employment: -17.9% (13,154 to 10,805)
> 2017 unemployment: 6.4%
> 2007-2017 labor force: -18.3% (14,133 to 11,540)
> Poverty: 28.1%
> Median household income: $37,108

13. Lorain, Ohio
> 2007-2017 employment: -18.1% (30,887 to 25,291)
> 2017 unemployment: 8.1%
> 2007-2017 labor force: -17.0% (33,134 to 27,513)
> Poverty: 26.2%
> Median household income: $35,753
[in-text-ad]
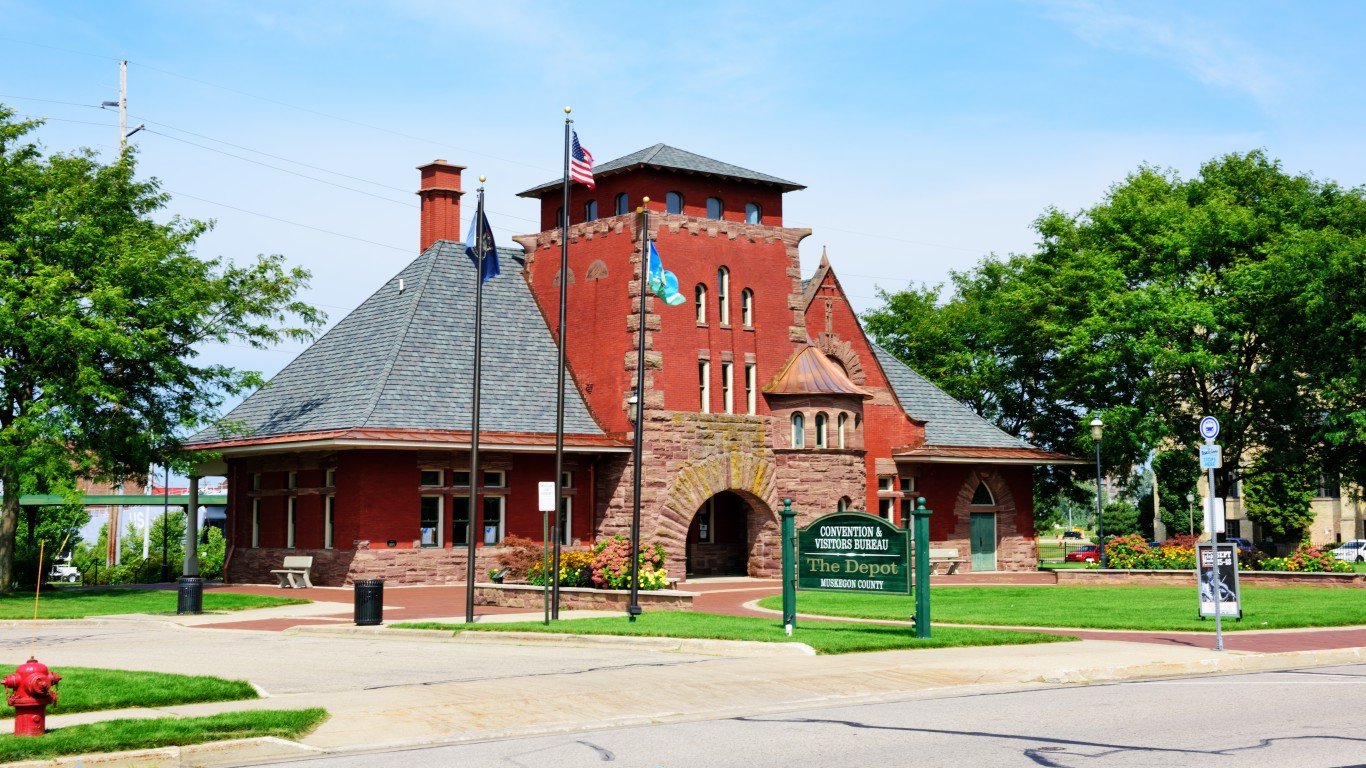
12. Muskegon, Michigan
> 2007-2017 employment: -20.2% (16,303 to 13,003)
> 2017 unemployment: 9.1%
> 2007-2017 labor force: -20.6% (18,015 to 14,301)
> Poverty: 37.4%
> Median household income: $27,359
[recirclink id=488514]

11. Marion, Ohio
> 2007-2017 employment: -20.9% (16,451 to 13,010)
> 2017 unemployment: 5.7%
> 2007-2017 labor force: -20.9% (17,433 to 13,791)
> Poverty: 21.9%
> Median household income: $34,932
10. Saginaw, Michigan
> 2007-2017 employment: -21.9% (22,266 to 17,380)
> 2017 unemployment: 9.7%
> 2007-2017 labor force: -24.4% (25,444 to 19,238)
> Poverty: 34.7%
> Median household income: $28,871
[in-text-ad-2]
9. Mansfield, Ohio
> 2007-2017 employment: -23.1% (21,624 to 16,632)
> 2017 unemployment: 6.2%
> 2007-2017 labor force: -23.5% (23,182 to 17,726)
> Poverty: 25.6%
> Median household income: $33,257
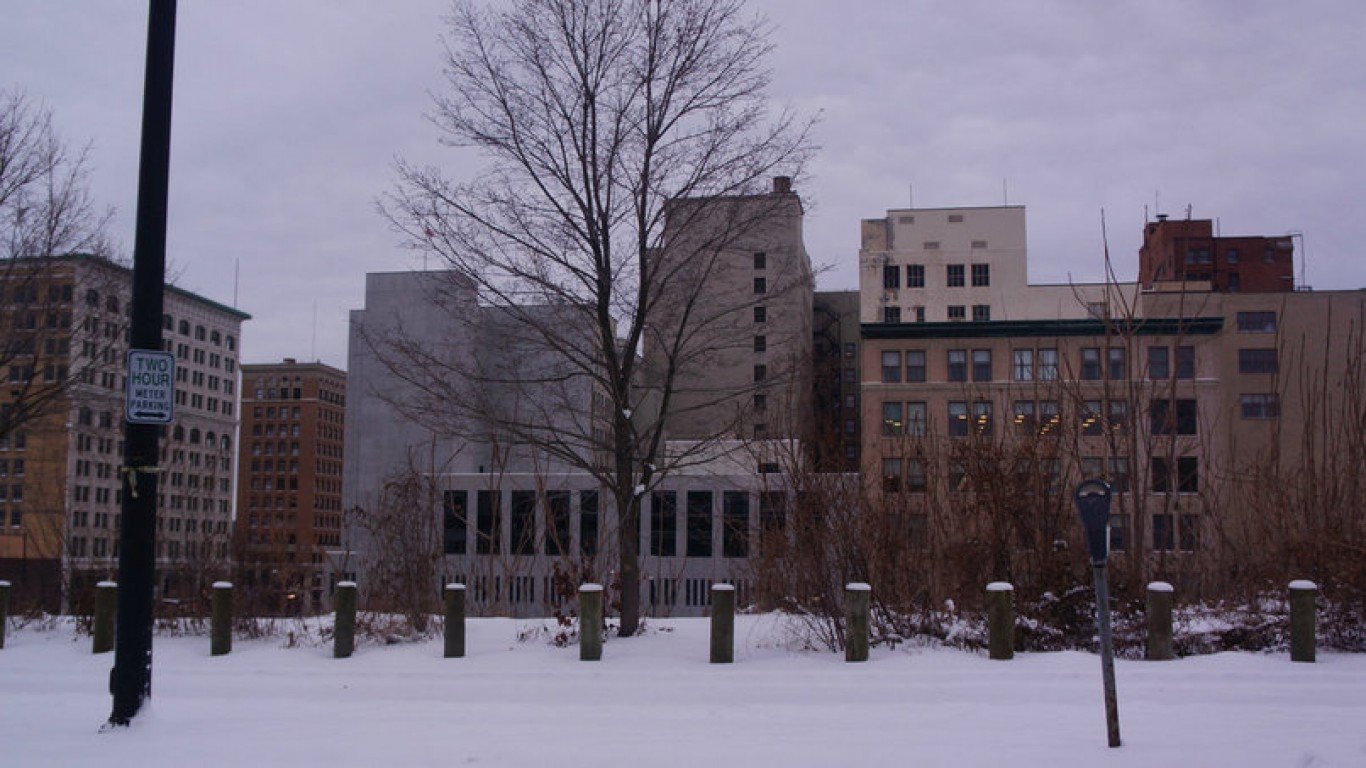
8. Youngstown, Ohio
> 2007-2017 employment: -23.3% (27,149 to 20,835)
> 2017 unemployment: 8.5%
> 2007-2017 labor force: -22.7% (29,452 to 22,770)
> Poverty: 38.0%
> Median household income: $24,448
[in-text-ad]

7. New Iberia, Louisiana
> 2007-2017 employment: -23.8% (13,651 to 10,407)
> 2017 unemployment: 8.3%
> 2007-2017 labor force: -20.1% (14,207 to 11,351)
> Poverty: 24.0%
> Median household income: $38,240
[recirclink id=488498]

6. Gary, Indiana
> 2007-2017 employment: -24.3% (32,983 to 24,960)
> 2017 unemployment: 7.4%
> 2007-2017 labor force: -23.8% (35,386 to 26,968)
> Poverty: 35.9%
> Median household income: $28,895
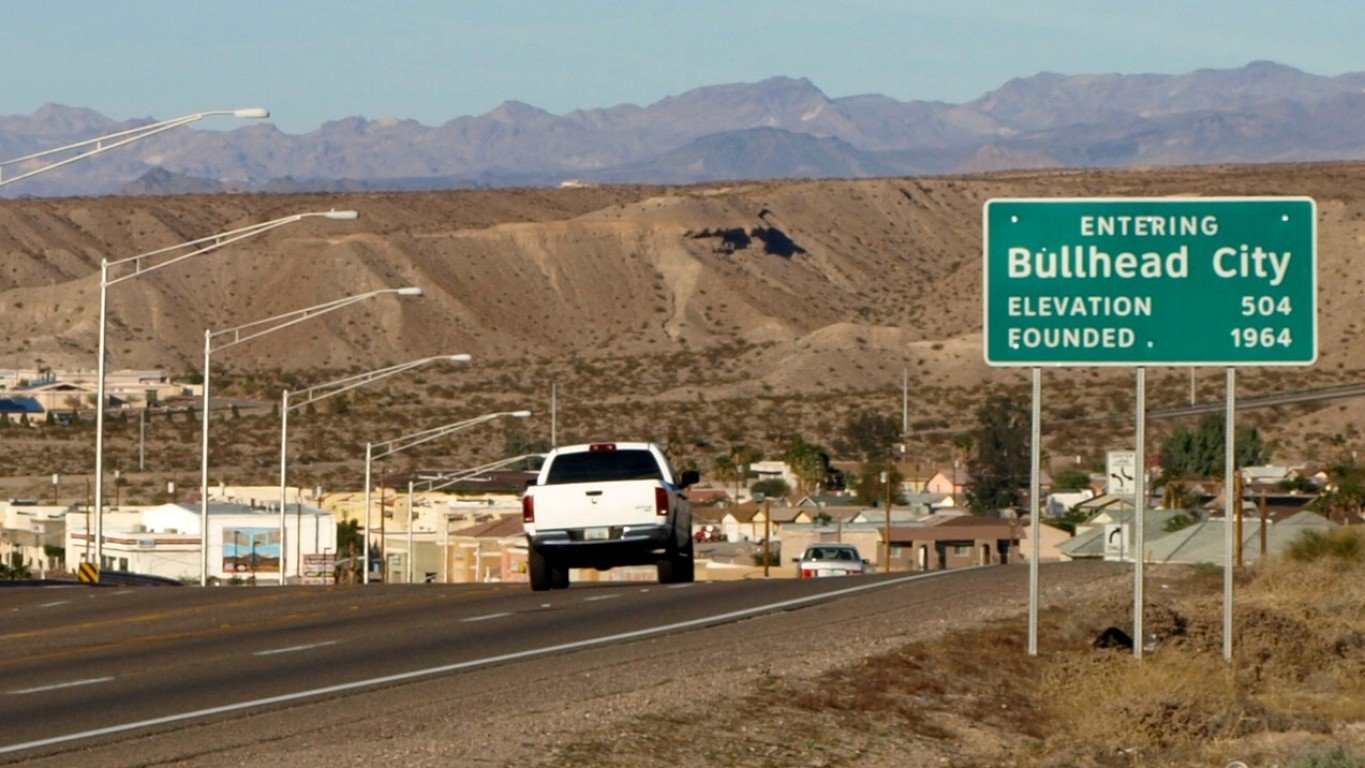
5. Bullhead City, Arizona
> 2007-2017 employment: -24.8% (20,616 to 15,497)
> 2017 unemployment: 5.9%
> 2007-2017 labor force: -23.6% (21,572 to 16,477)
> Poverty: 19.3%
> Median household income: $37,206
[in-text-ad-2]
4. Harvey, Illinois
> 2007-2017 employment: -25.1% (9,969 to 7,462)
> 2017 unemployment: 9.9%
> 2007-2017 labor force: -24.8% (11,007 to 8,280)
> Poverty: 37.9%
> Median household income: $21,909
3. Warren, Ohio
> 2007-2017 employment: -27.7% (18,165 to 13,142)
> 2017 unemployment: 8.6%
> 2007-2017 labor force: -26.2% (19,500 to 14,384)
> Poverty: 34.9%
> Median household income: $29,176
[in-text-ad]
2. Detroit, Michigan
> 2007-2017 employment: -28.5% (314,777 to 224,958)
> 2017 unemployment: 9.3%
> 2007-2017 labor force: -31.8% (363,760 to 248,070)
> Poverty: 39.4%
> Median household income: $26,249
[recirclink id=488094]

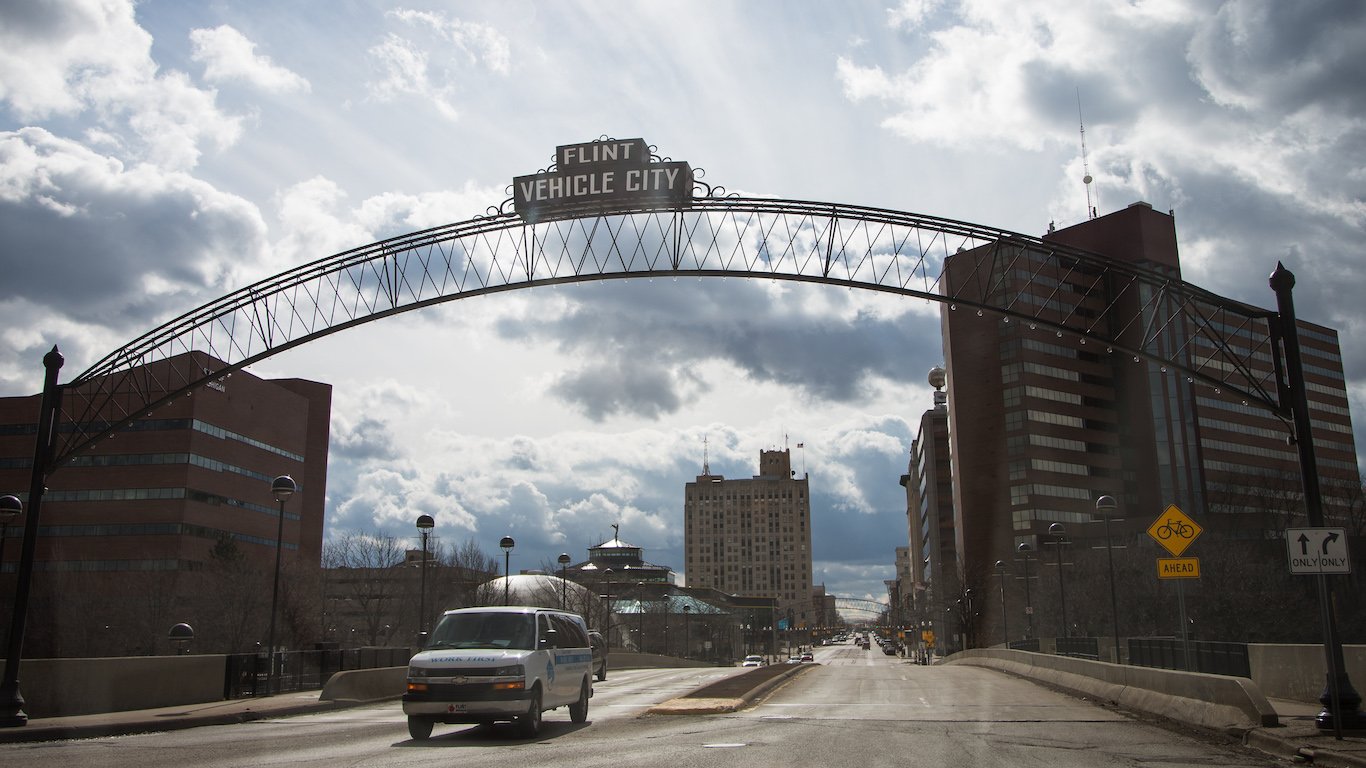
1. Flint, Michigan
> 2007-2017 employment: -31.9% (45,249 to 30,825)
> 2017 unemployment: 10.3%
> 2007-2017 labor force: -35.3% (53,128 to 34,367)
> Poverty: 41.9%
> Median household income: $25,65
Detailed Findings
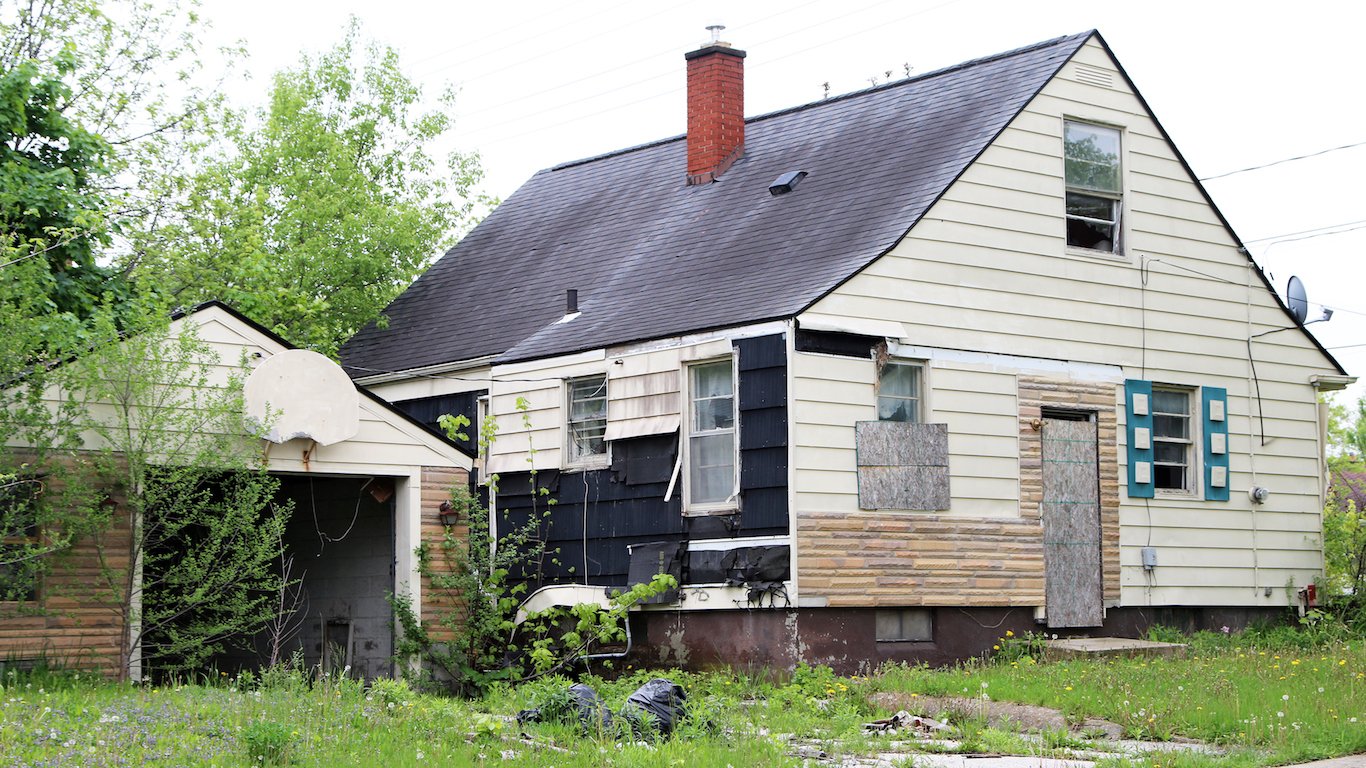
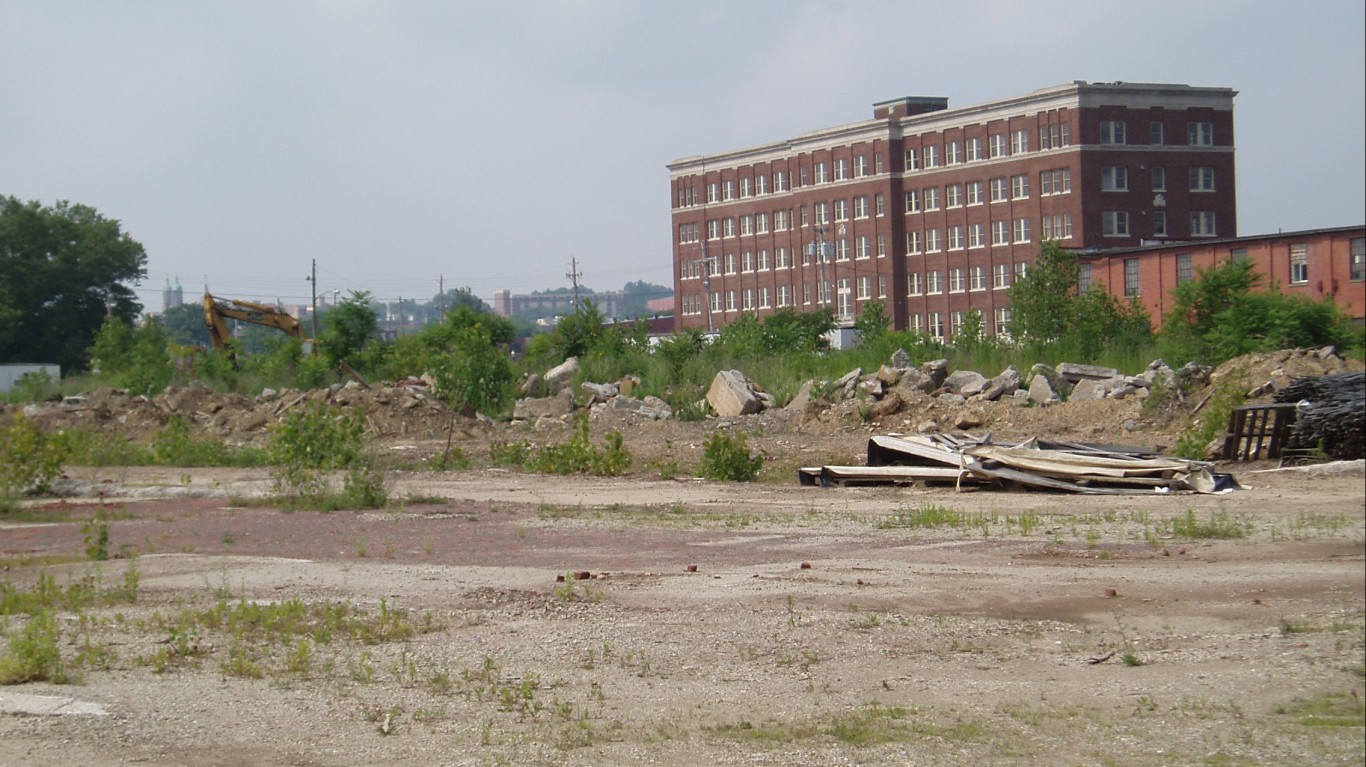
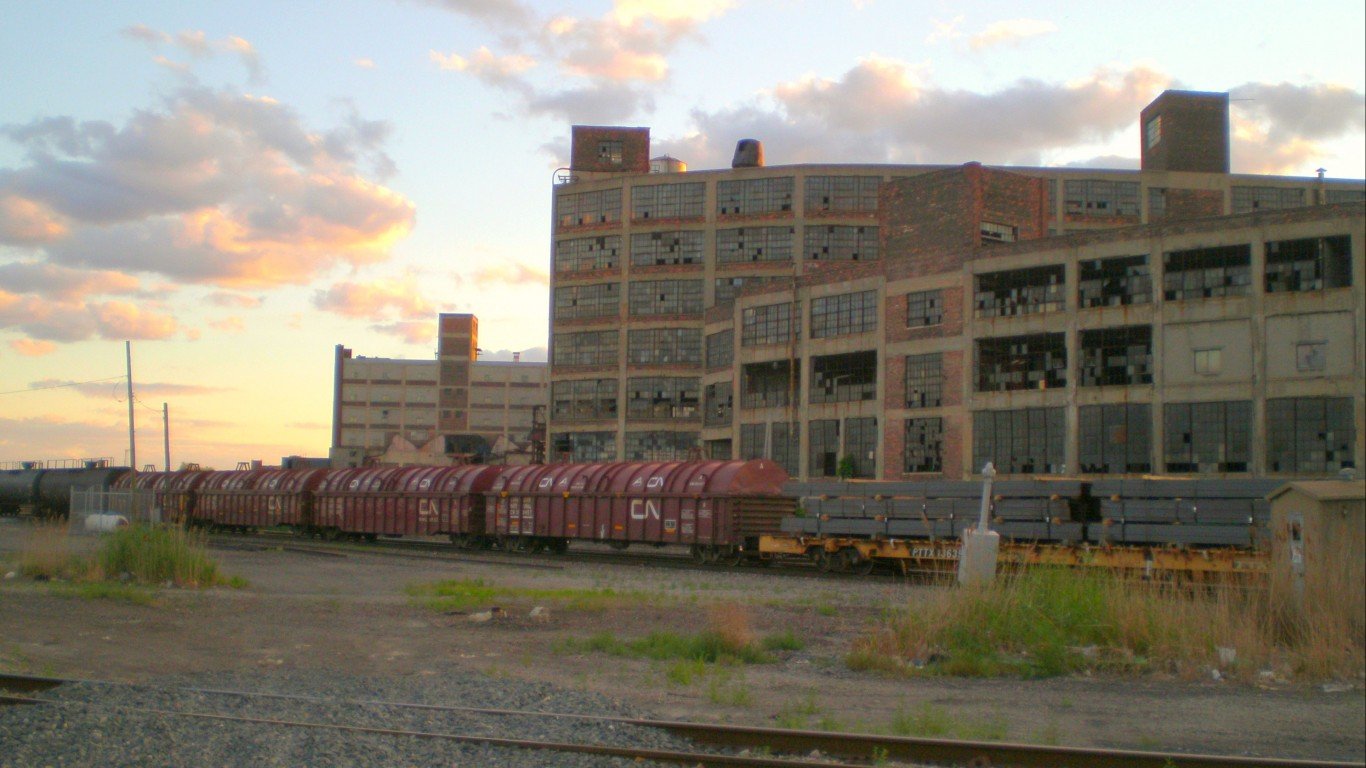
Many of the cities on this list had economic problems long before the recession began. The majority are mid-sized and large Rust Belt cities that have struggled with long-term job losses and population declines. Also referred to as legacy cities, these places include such cities as Detroit, Michigan; Youngstown, Ohio; and Gary, Indiana.
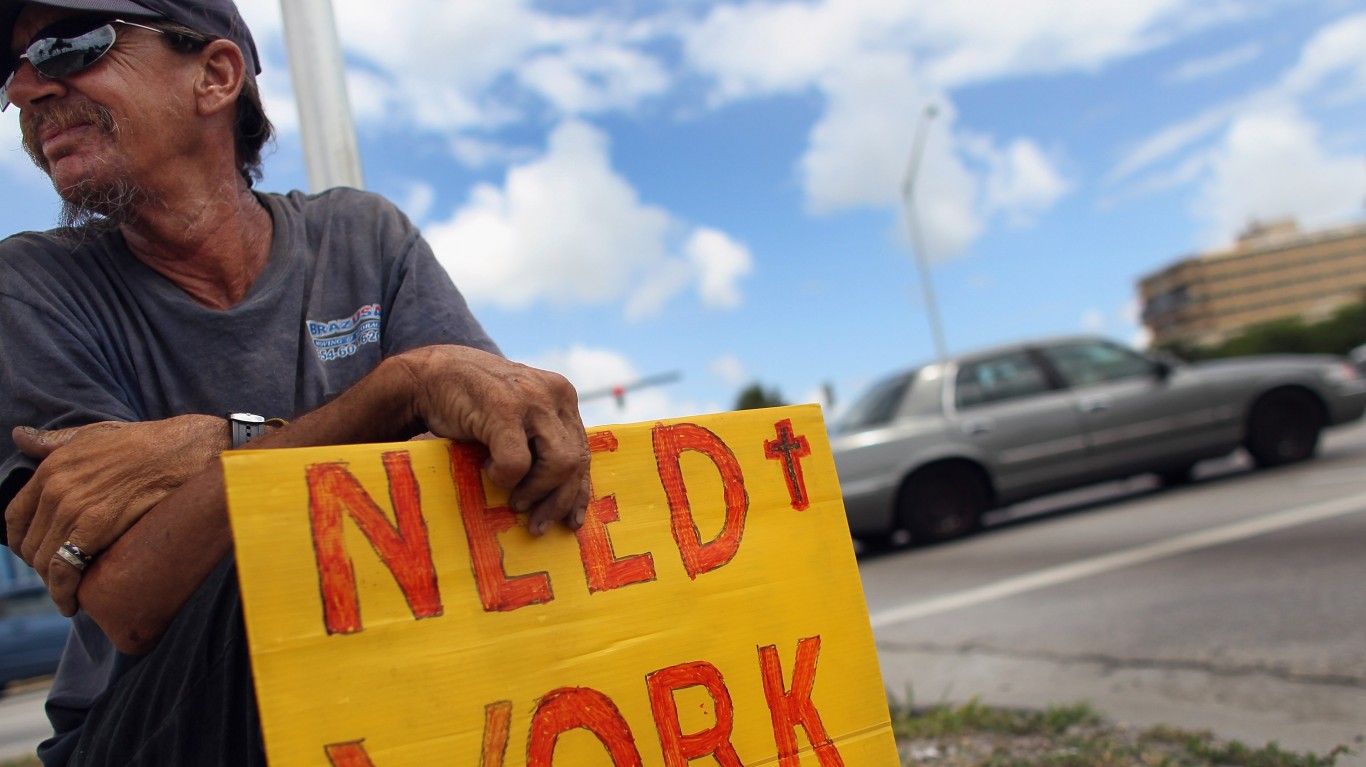
As might be expected, the majority of the cities on this list had relatively high unemployment even before the effects of the housing crisis and recession began to be felt. The U.S. annual unemployment rate in 2007 was 4.6%, but unemployment was higher in 25 of the 28 cities on this list. Still, as was the case nationwide, unemployment worsened in these cities as well as the result of the recession, more than doubling in most cases on this list and rising above 20% in a number of cases.
Unemployment rates in many of these metropolitan areas have improved and are even lower than 2007 levels, but this does mean the economies of these places have returned to normal. While unemployment may have recovered, it is largely because people have given up looking for work in these cities. The overall size of the labor force — people who are working or looking for work, has shrunk meaningfully. The labor forces in each of these 28 cities has declined by at least 9.8% and by as much as 35.3%.
As is the case at the national level, the jobs that have returned to many of these cities are less likely to be high-paying and more likely to be part-time positions. While wages were low in many of these cities prior to the recession, the recovery has done little to improve the likelihood workers will earn wages sufficient to escape poverty.
In 2016, the most recent year for which data is available at the small city level, the national poverty rate was 15.1%. It was higher in all but one of the 28 cities on this list, and at least 10 percentage points higher in 19 of the 28. In Flint, Michigan, the city where employment remains the furthest below 2007 levels, 41.9% of residents live in poverty.
The national median household income in 2016 of $55,322 was higher than in all but one of the cities on this list. In 10 of the 28 cities on this list, the typical annual household income in 2016 was less than $30,000.
Methodology
To determine the cities that never recovered from the recession, 24/7 Wall St. ranked the 2007-2017 employment declines in all U.S. cities with a population of at least 25,000 based on data from the U.S. Bureau of Labor Statistics. For Vermont, the population cutoff was lowered to allow for at least three cities to compare. To make this list, cities needed to meet the following criteria: employment needed to decline by at least 15% from 2007 to some point in the first five years of the recession; the 2017 annual unemployment rate must be a full percentage point higher than the U.S. 2017 annual unemployment rate of 4.4%; and the annual unemployment rate must have never fallen below the city’s 2007 jobless rate. All data on employment, unemployment, and labor force is from the Local Area Unemployment Statistics (LAUS) survey from the Bureau of Labor Statistics.
Contact [email protected] for any questions or corrections.