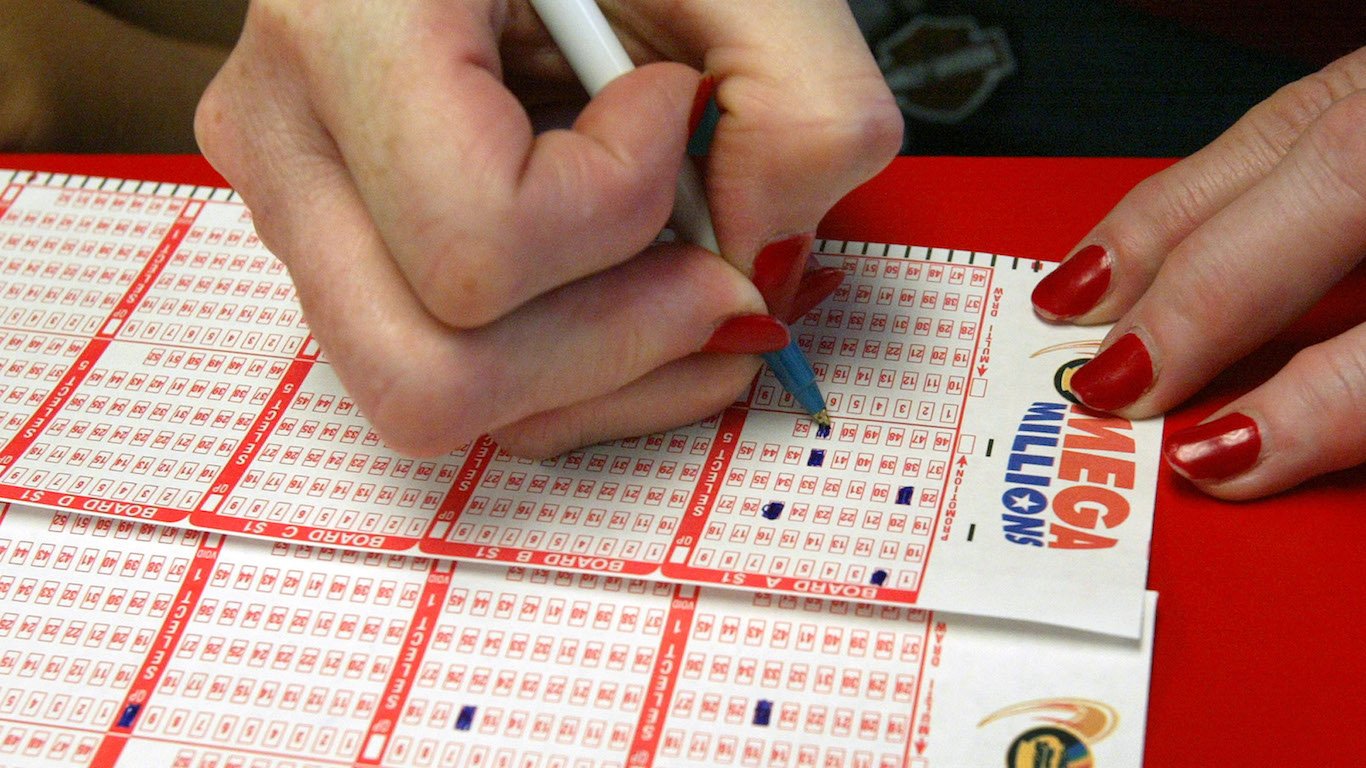
Chances are you had to go to work today — because you did not have the Mega Millions ticket that netted a near-U.S. record of $1.537 billion.
The winning ticket was drawn at a convenience store in Simpsonville, South Carolina, a town just outside of Greenville. The jackpot fell short of the record of $1.586 billion, set in January 2016, that was divided among three winning Powerball tickets.
The lottery is played in 44 states, the District of Columbia, and the Virgin Islands (six states — Alabama, Alaska, Hawaii, Mississippi, Nevada, and Utah — do not have a lottery). In five states, lottery mania takes particular hold.
The five states — Massachusetts, West Virginia, Rhode Island, New York, and Delaware — spend the most on lottery ticket sales per capita at more than $400 per year, according to Census Bureau data. Massachusetts is first at $768.36. Across all states that sell lottery tickets, ticket sales per capita is $225.14.
Click here to see the states that are addicted to the lottery.
The states spending the most on lottery tickets share other characteristics.
All five states are also in the top five in dividing up the funds from lottery proceeds per capita, money that is utilized for public use. Rhode Island is first at $349.71. The U.S. average is $71.03.
Geographically concentrated, three of the states — Massachusetts, New York, and Rhode Island — are in the Northeast. The remaining two states — Delaware and West Virginia — are in the South Atlantic.
In four of the five states, the adult population with a bachelor’s degree either matches or exceeds the national average of 32%. West Virginia is the exception. Three of the five states have high school graduation rates of about 90% or higher (New York and West Virginia are the exceptions). The U.S. average is 88%.
Three of the five states pay out the most lottery winnings per capita. Massachusetts is first, paying out $564.07 per capita in lottery winnings followed by West Virginia at $307.53, and fourth-place New York at $234.47. Rhode Island is 13th at $153.02, and Delaware is 24th at $114.45.
Here is a quick breakdown of the history of the lottery in each state and a notable winner in each of the five states.
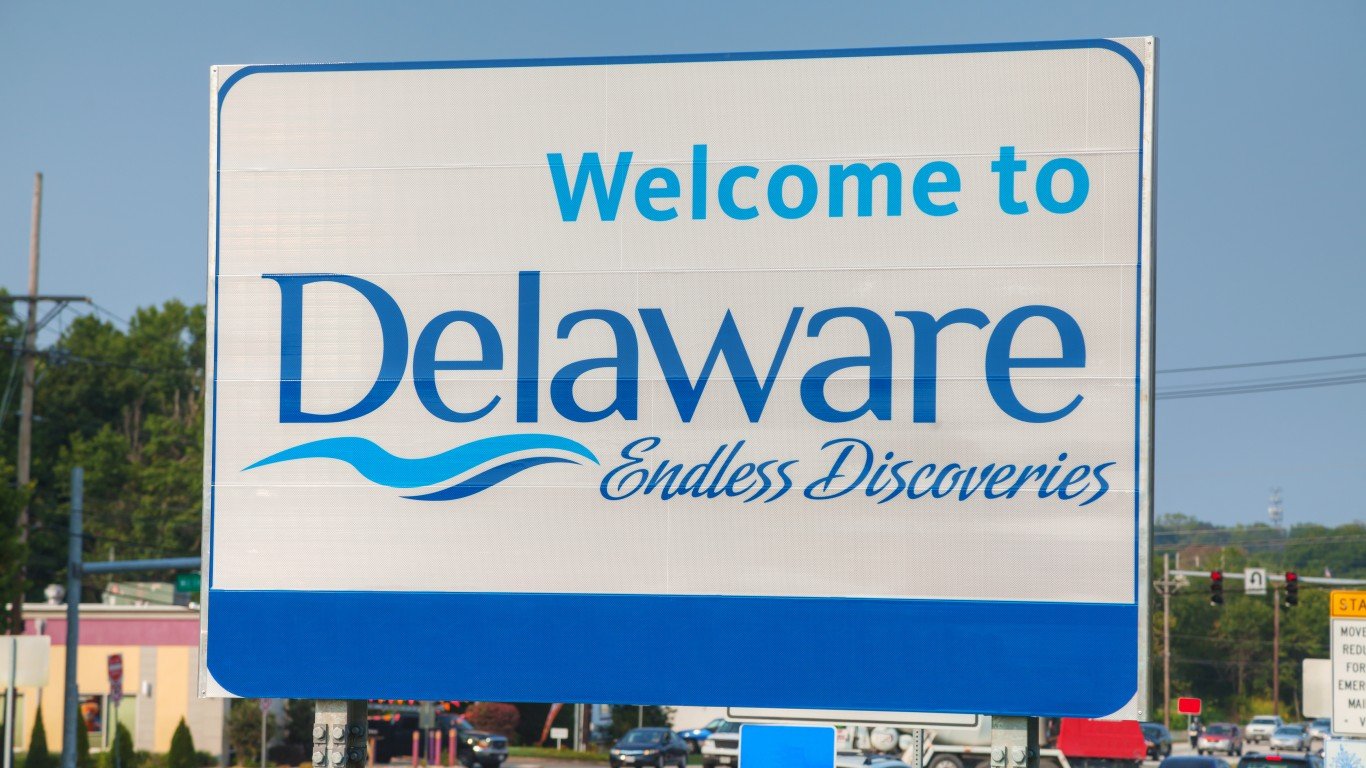
5. Delaware
> Ticket sales per capita: $421
> Ticket sales: $400,647,000 (20th lowest)
> Year of first lottery: 1975
The Delaware lottery provides income for the state’s general fund, which is money used for various state services such as education, crime protection, and health care for senior citizens.
The lottery has raised nearly $5.2 billion for the general fund since 1975, $212 million in fiscal year 2018 alone (the year ended in June 2018).
The lottery was created through a law that was signed on May 31, 1974. The first lottery games were played in 1975. The lottery website said the Delaware lottery is the fourth-biggest revenue producer for the state.
Lottery proceeds available after deducting prizes and administration costs were $240.7 million in fiscal year 2016. It also costs more to operate the lottery in Delaware than any other state, $53.51 per capita for administrative expenses. The next highest is Oregon at $24.71.
Delaware is one of only six states where Powerball and Mega Millions winners can remain anonymous. Rose and Robert Crowther won the first Hot Lotto jackpot in Delaware history in 2009, taking home $10.774 million.
[in-text-ad]

4. New York
> Ticket sales per capita: $423
> Ticket sales: $8,344,023,000 (the highest)
> Year of first lottery: 1967
New York state has held its lottery since 1967. All lottery profits from the sale of New York lottery tickets go toward funding New York state’s kindergarten-12 public education, according to the lottery’s website. The lottery has provided more than $64 billion for public education since its inception.
New York, fourth in the nation in population, has the highest lottery income of any state at $8.34 billion. Lottery proceeds available after deducting prizes and administration costs were $3.32 billion in fiscal year 2016.
James and Sylvia Silverence of Hudson Valley became the biggest scratch-off winners in New York history in March 2017 by winning $10 million with a New York lottery scratch-off ticket.
[recirclink id=488456]
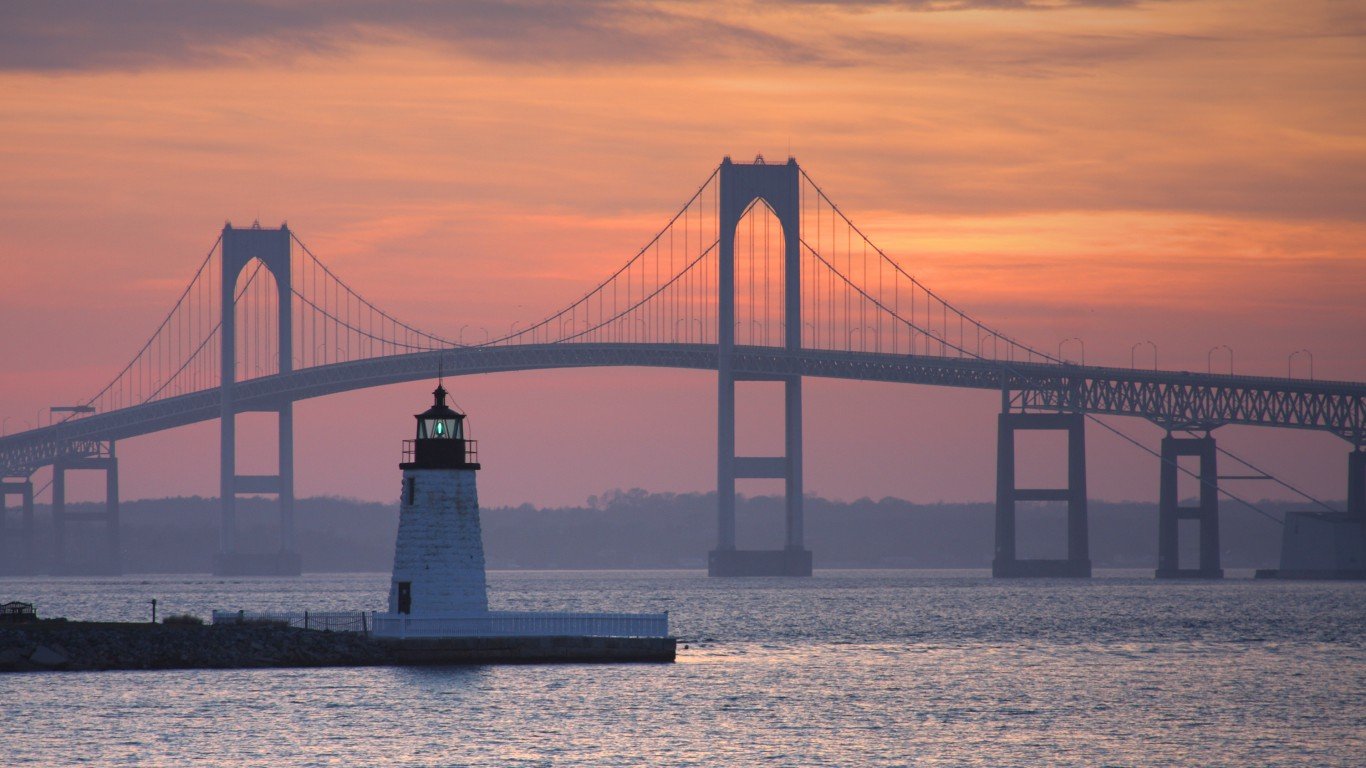
3. Rhode Island
> Ticket sales per capita: $513
> Ticket sales: $542,209,000 (24th lowest)
> Year of first lottery: 1974
The Rhode Island lottery was established in 1974. According to the lottery’s website, the beneficiaries are the state general fund and communities in need.
Since 1974, the lottery has generated more than $6.9 billion to the state general fund, which supports education, health care, public safety, and the environment, according to the lottery’s website.
Lottery proceeds available after deducting prizes and administration costs were $369.4 million in fiscal year 2016, according to census data.
Louise White, an 81-year-old Newport, Rhode Island, resident won $336.4 million in March 2012, at the time the third largest Powerball lottery jackpot ever.

2. West Virginia
> Ticket sales per capita: $593
> Ticket sales: $1,086,745,000 (20th highest)
> Year of first lottery: 1986
West Virginia voters approved the lottery on Nov. 6, 1984, and the state legislature passed the Lottery Act in April 1985. It was signed into law the following May by Gov. Arch A. Moore, Jr.
West Virginia’s first instant tickets were sold on Jan. 9, 1986. Since that time, the lottery generates more than $520 million a year for West Virginia. The lottery’s proceeds help fund public education, senior services and the state’s tourism industry. Lottery proceeds available after deducting prizes and administration costs were $501.6 million in fiscal year 2016, according to census data.
Lottery players have won more than $3 billion in prizes since the lottery began, according to its website. One of those winners was Jack Whittaker, who took home a $315 million Powerball jackpot in December 2002. At the time it was the largest jackpot ever won by a single ticket.
[in-text-ad-2]

1. Massachusetts
> Ticket sales per capita: $768
> Ticket sales: $5,233,931,000 (4th highest)
> Year of first lottery: 1971
The Massachusetts State Lottery was established by the state legislature in 1971 to provide revenue for the municipalities of the state. The lottery sold its first ticket in March 1972, and since then the lottery has generated $110.4 billion in sales, awarded $76.7 billion in prizes, and provided $24.7 billion to the state for aid to cities and towns, according to its website.
Lottery proceeds available after deducting prizes and administration costs were $1.29 billion in fiscal year 2016, according to Census Bureau data.
Mavis Wanczyk, a hospital worker from Chicopee, Massachusetts, won what had been the largest single-ticket prize in U.S. lottery history in August 2017, a $758.7 million Powerball jackpot.
Contact [email protected] for any questions or corrections.