[cnxvideo id=”507121″ placement=”ros”]Governors are the highest-ranking officials in state government. Much like CEOs in the private sector, governors serve as the chief executives of their state, wielding exclusive power and shouldering the responsibility that comes with the post. However, as public servants, state governors are generally compensated far less than their private-sector counterparts.
The average pay among CEOs of America’s 500 largest companies was $14 million in 2017 — more than double the combined salaries of all 50 state governors. Still, just as it does in the private sector, compensation for the top job varies from state to state. In some states, governors earn more than double the salaries of governors of other states.
24/7 Wall St. reviewed the listed salary of governors in each state to identify America’s highest-paid governors. These salaries do not factor in common benefits such as housing, access to government vehicles, and travel allowances and reimbursement.
While the size of the state and the number of constituents each governor is accountable for does not appear to directly impact compensation, many of the highest-paid governors work in more populous states.
Click here to see America’s highest-paid governors.
Click here to read our detailed findings and methodology.

50. Paul LePage (R) – Maine
> Salary: $70,000
> Present term: January 2015 – January 2019
> State tax collections: $3,105 per capita (14th highest)
> Statewide cost of living: 8.7% more expensive than avg. (19th highest)
[in-text-ad]

49. John Hickenlooper (D) – Colorado
> Salary: $90,000
> Present term: January 2015 – January 2019
> State tax collections: $2,314 per capita (14th lowest)
> Statewide cost of living: 13.7% more expensive than avg. (11th highest)
[recirclink id=488456]

48. Doug Ducey (R) – Arizona
> Salary: $95,000
> Present term: January 2015 – January 2019
> State tax collections: $2,124 per capita (12th lowest)
> Statewide cost of living: 6.0% more expensive than avg. (25th lowest)

47. Kate Brown (D) – Oregon
> Salary: $98,600
> Present term: January 2017 – January 2019
> State tax collections: $2,703 per capita (25th highest)
> Statewide cost of living: 10.2% more expensive than avg. (15th highest)
[in-text-ad-2]

46. Jeff Colyer (R) – Kansas
> Salary: $99,636
> Present term: January 2018 – January 2019
> State tax collections: $2,772 per capita (22nd highest)
> Statewide cost of living: Average (16th lowest)

45. Matthew Mead (R) – Wyoming
> Salary: $105,000
> Present term: January 2015 – January 2019
> State tax collections: $3,272 per capita (12th highest)
> Statewide cost of living: 6.9% more expensive than avg. (25th highest)
[in-text-ad]
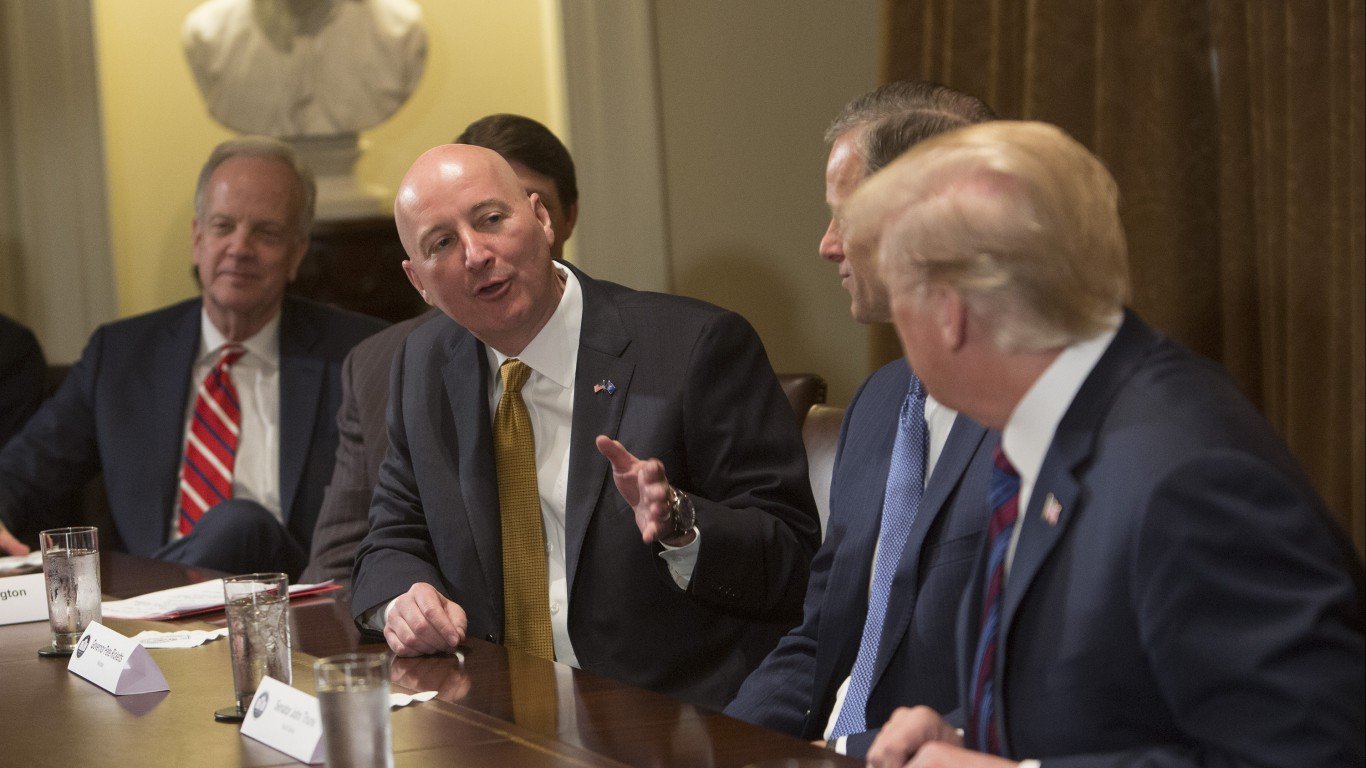
44. Pete Ricketts (R) – Nebraska
> Salary: $105,000
> Present term: January 2015 – January 2019
> State tax collections: $2,682 per capita (25th lowest)
> Statewide cost of living: 0.1% less expensive than avg. (15th lowest)
[recirclink id=488594]

43. Henry McMaster (R) – South Carolina
> Salary: $106,078
> Present term: January 2017 – January 2019
> State tax collections: $1,926 per capita (4th lowest)
> Statewide cost of living: 0.2% less expensive than avg. (14th lowest)
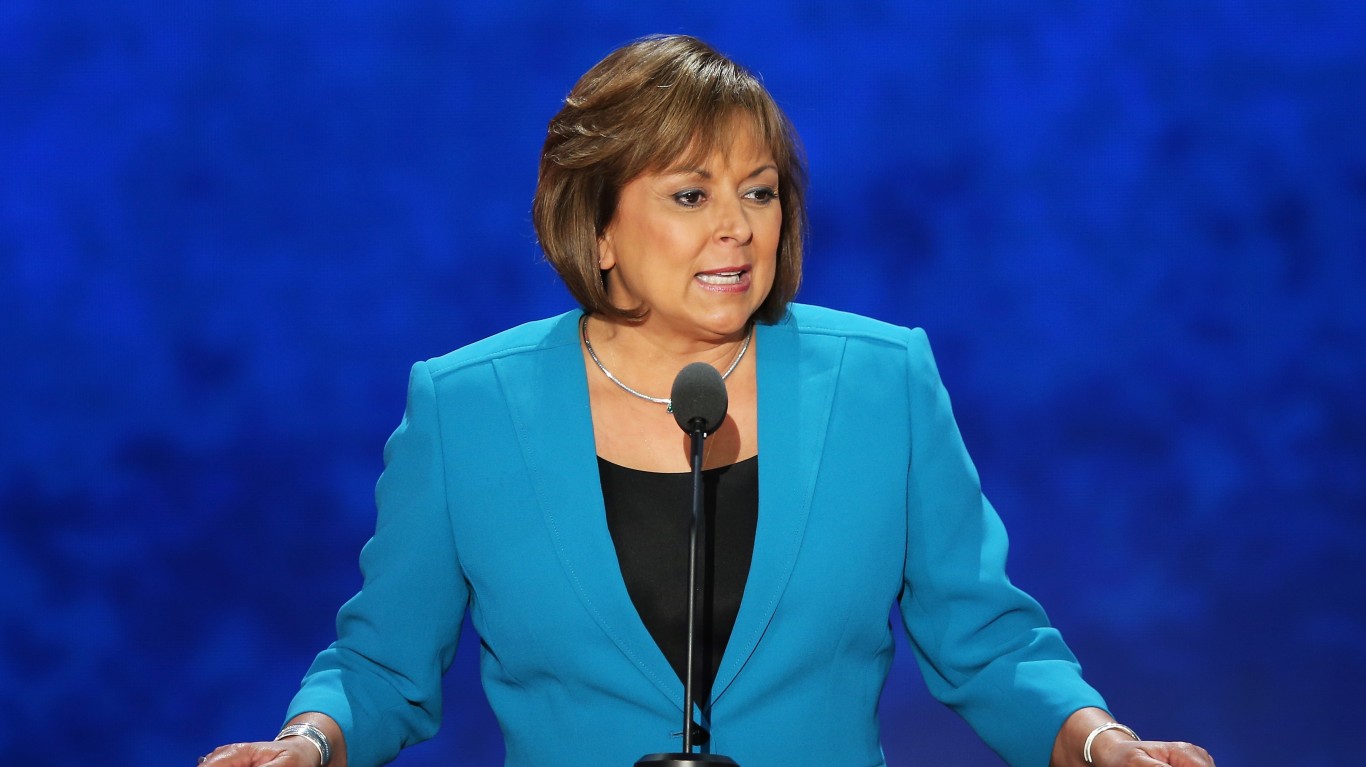
42. Susana Martinez (R) – New Mexico
> Salary: $110,000
> Present term: January 2015 – January 2019
> State tax collections: $2,619 per capita (22nd lowest)
> Statewide cost of living: 3.4% more expensive than avg. (23rd lowest)
[in-text-ad-2]

41. Dennis Daugaard (R) – South Dakota
> Salary: $112,214
> Present term: January 2015 – January 2019
> State tax collections: $2,028 per capita (9th lowest)
> Statewide cost of living: 2.4% less expensive than avg. (6th lowest)

40. Steve Bullock (D) – Montana
> Salary: $115,505
> Present term: January 2017 – January 2021
> State tax collections: $2,530 per capita (19th lowest)
> Statewide cost of living: 4.0% more expensive than avg. (24th lowest)
[in-text-ad]

39. Bill Haslam (R) – Tennessee
> Salary: $119,116
> Present term: January 2015 – January 2019
> State tax collections: $2,013 per capita (8th lowest)
> Statewide cost of living: 0.4% less expensive than avg. (11th lowest)
[recirclink id=488561]

38. Kay Ivey (R) – Alabama
> Salary: $120,395
> Present term: April 2017 – January 2019
> State tax collections: $2,041 per capita (10th lowest)
> Statewide cost of living: 4.4% less expensive than avg. (2nd lowest)

37. Eric Holcomb (R) – Indiana
> Salary: $121,233
> Present term: January 2017 – January 2021
> State tax collections: $2,651 per capita (23rd lowest)
> Statewide cost of living: 0.2% less expensive than avg. (14th lowest)
[in-text-ad-2]

36. Phil Bryant (R) – Mississippi
> Salary: $122,160
> Present term: January 2016 – January 2020
> State tax collections: $2,566 per capita (20th lowest)
> Statewide cost of living: 4.6% less expensive than avg. (the lowest)

35. C.L. “Butch” Otter (R) – Idaho
> Salary: $124,436
> Present term: January 2015 – January 2019
> State tax collections: $2,506 per capita (17th lowest)
> Statewide cost of living: 2.8% more expensive than avg. (21st lowest)
[in-text-ad]

34. Chris Sununu (R) – New Hampshire
> Salary: $127,443
> Present term: January 2017 – January 2019
> State tax collections: $1,979 per capita (5th lowest)
> Statewide cost of living: 16.9% more expensive than avg. (8th highest)
[recirclink id=488514]
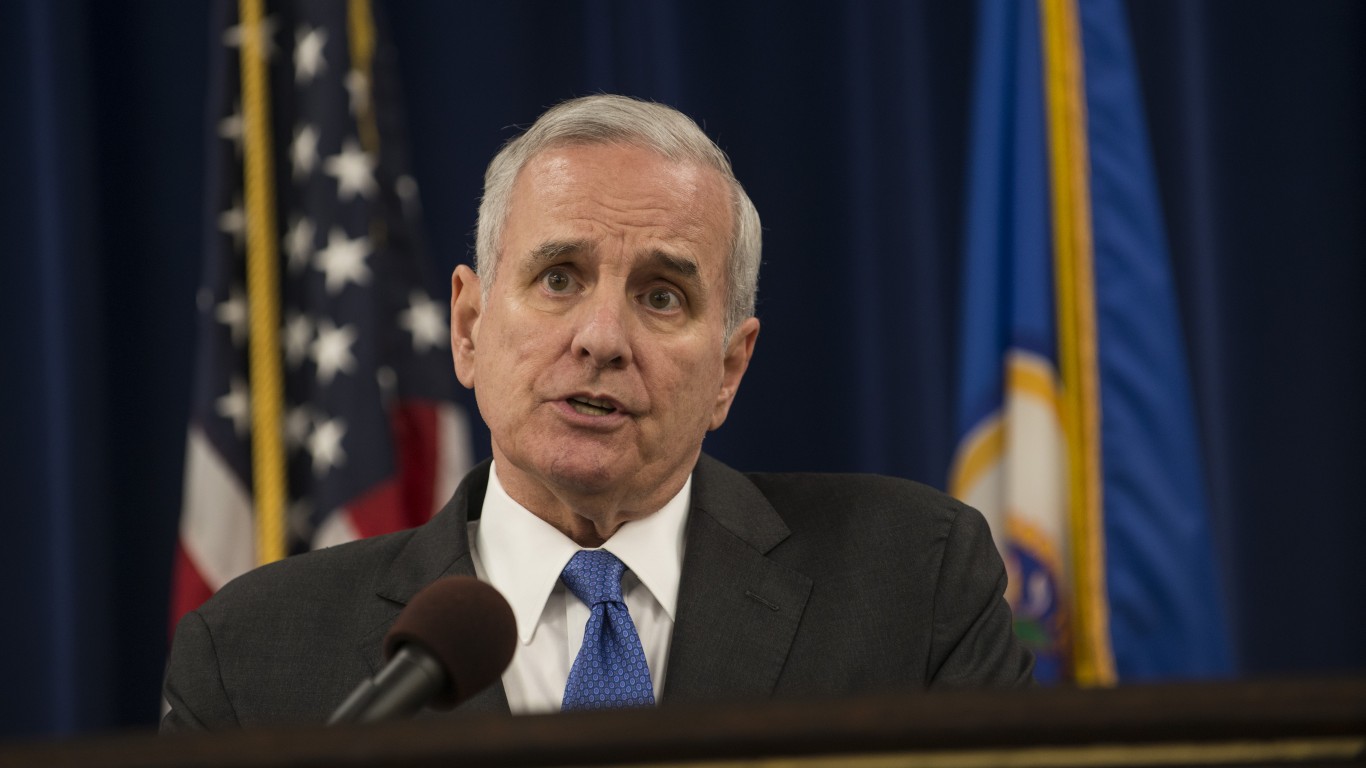
33. Mark Dayton (D) – Minnesota
> Salary: $127,629
> Present term: January 2015 – January 2019
> State tax collections: $4,559 per capita (4th highest)
> Statewide cost of living: 7.7% more expensive than avg. (21st highest)

32. Doug Burgum (R) – North Dakota
> Salary: $129,096
> Present term: December 2016 – December 2020
> State tax collections: $4,909 per capita (2nd highest)
> Statewide cost of living: 1.1% more expensive than avg. (18th lowest)
[in-text-ad-2]

31. John Bel Edwards (D) – Louisiana
> Salary: $130,000
> Present term: January 2016 – January 2020
> State tax collections: $1,987 per capita (6th lowest)
> Statewide cost of living: 0.2% less expensive than avg. (14th lowest)
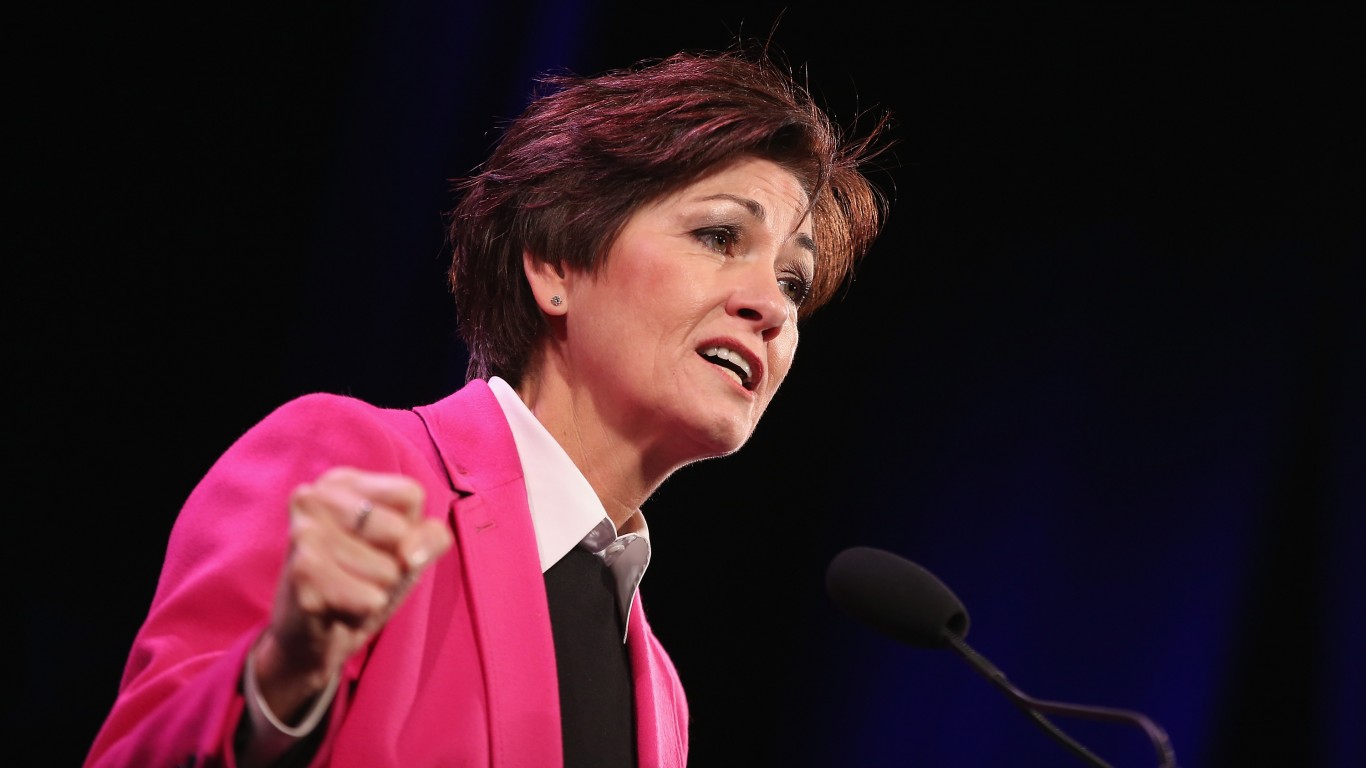
30. Kim Reynolds (R) – Iowa
> Salary: $130,000
> Present term: May 2017 – January 2019
> State tax collections: $3,053 per capita (17th highest)
> Statewide cost of living: 0.4% less expensive than avg. (11th lowest)
[in-text-ad]
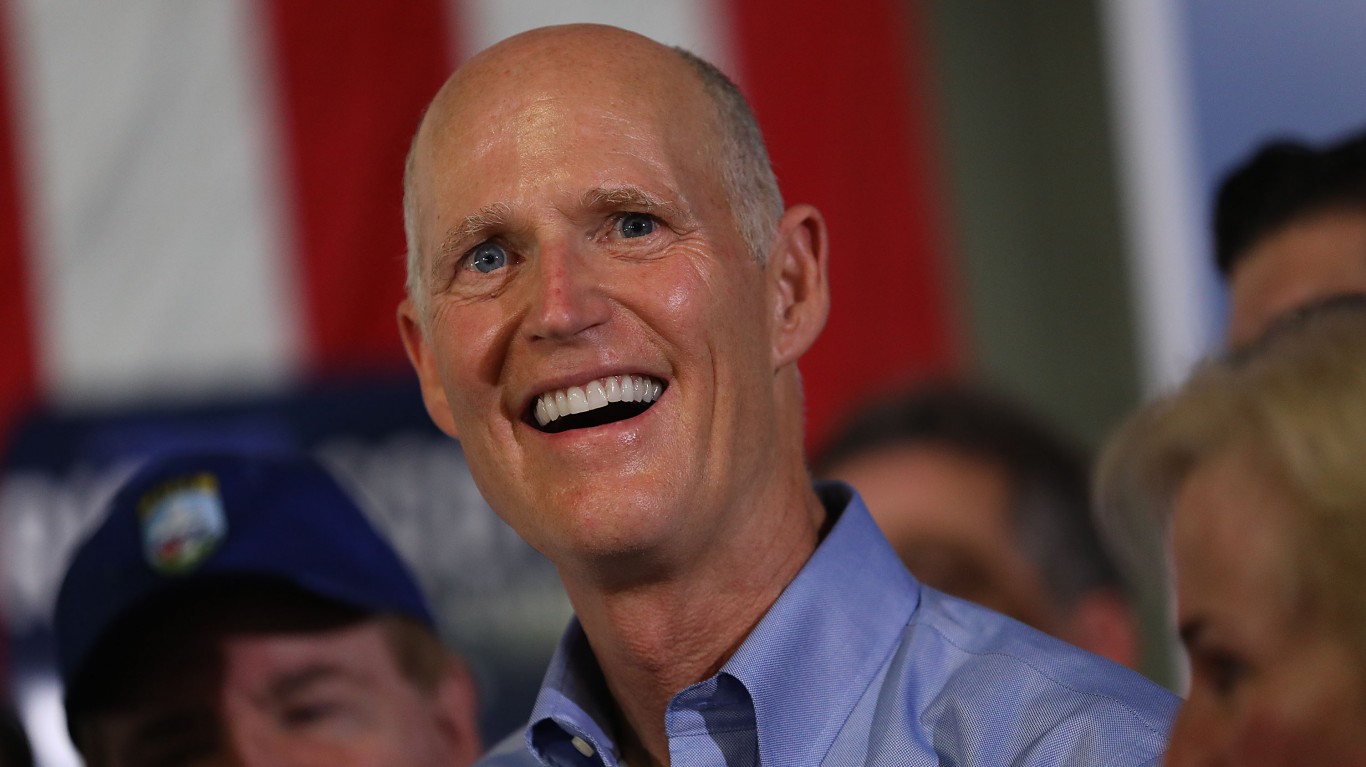
29. Rick Scott (R) – Florida
> Salary: $130,273
> Present term: January 2015 – January 2019
> State tax collections: $1,822 per capita (2nd lowest)
> Statewide cost of living: 10.2% more expensive than avg. (15th highest)
[recirclink id=488498]

28. Mike Parson (R) – Missouri
> Salary: $133,821
> Present term: June 2018 – January 2021
> State tax collections: $2,010 per capita (7th lowest)
> Statewide cost of living: 1.2% less expensive than avg. (9th lowest)
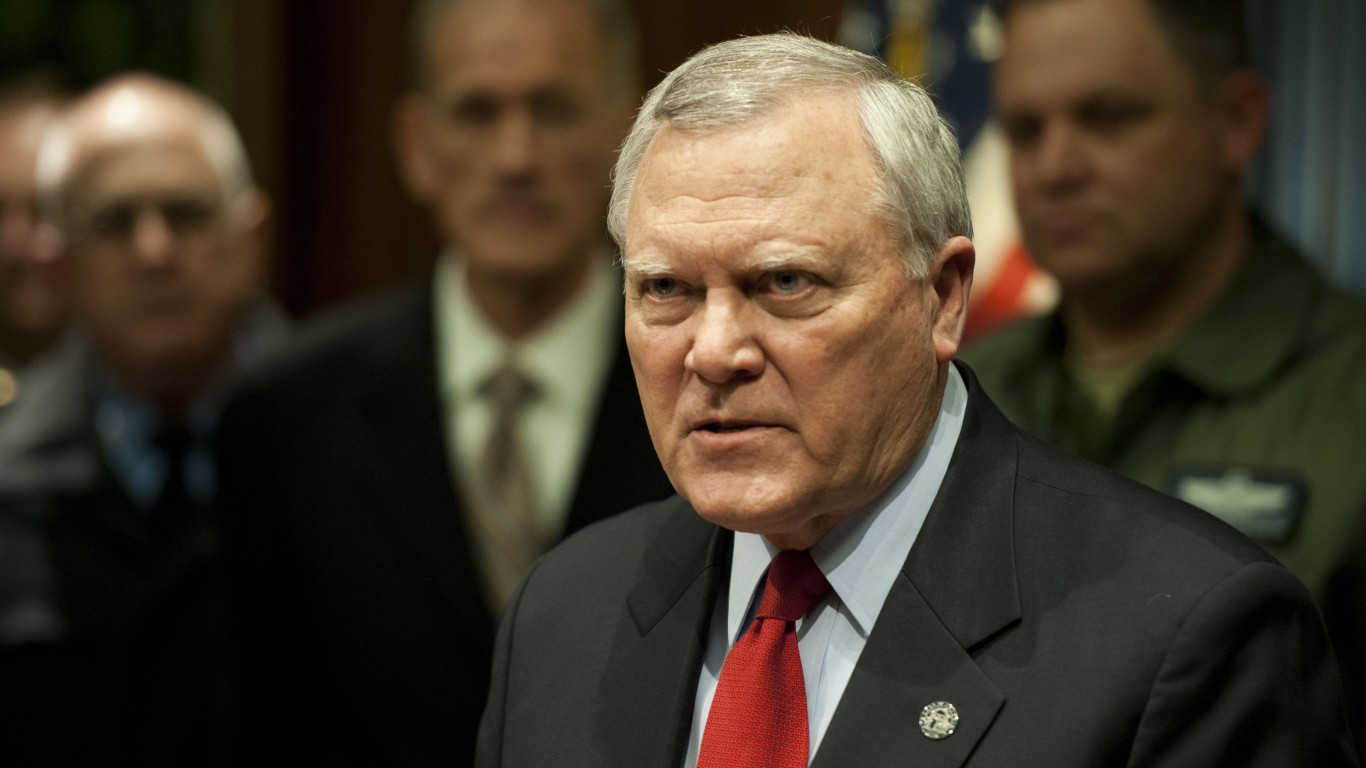
27. Nathan Deal (R) – Georgia
> Salary: $139,339
> Present term: January 2015 – January 2019
> State tax collections: $2,080 per capita (11th lowest)
> Statewide cost of living: 1.8% more expensive than avg. (19th lowest)
[in-text-ad-2]

26. Gina Raimondo (D) – Rhode Island
> Salary: $139,695
> Present term: January 2015 – January 2019
> State tax collections: $3,088 per capita (15th highest)
> Statewide cost of living: 10.0% more expensive than avg. (17th highest)

25. Asa Hutchinson (R) – Arkansas
> Salary: $143,820
> Present term: January 2015 – January 2019
> State tax collections: $3,163 per capita (13th highest)
> Statewide cost of living: 4.0% less expensive than avg. (3rd lowest)
[in-text-ad]

24. Roy Cooper (D) – North Carolina
> Salary: $144,349
> Present term: January 2017 – January 2021
> State tax collections: $2,580 per capita (21st lowest)
> Statewide cost of living: 0.4% more expensive than avg. (17th lowest)
[recirclink id=488094]
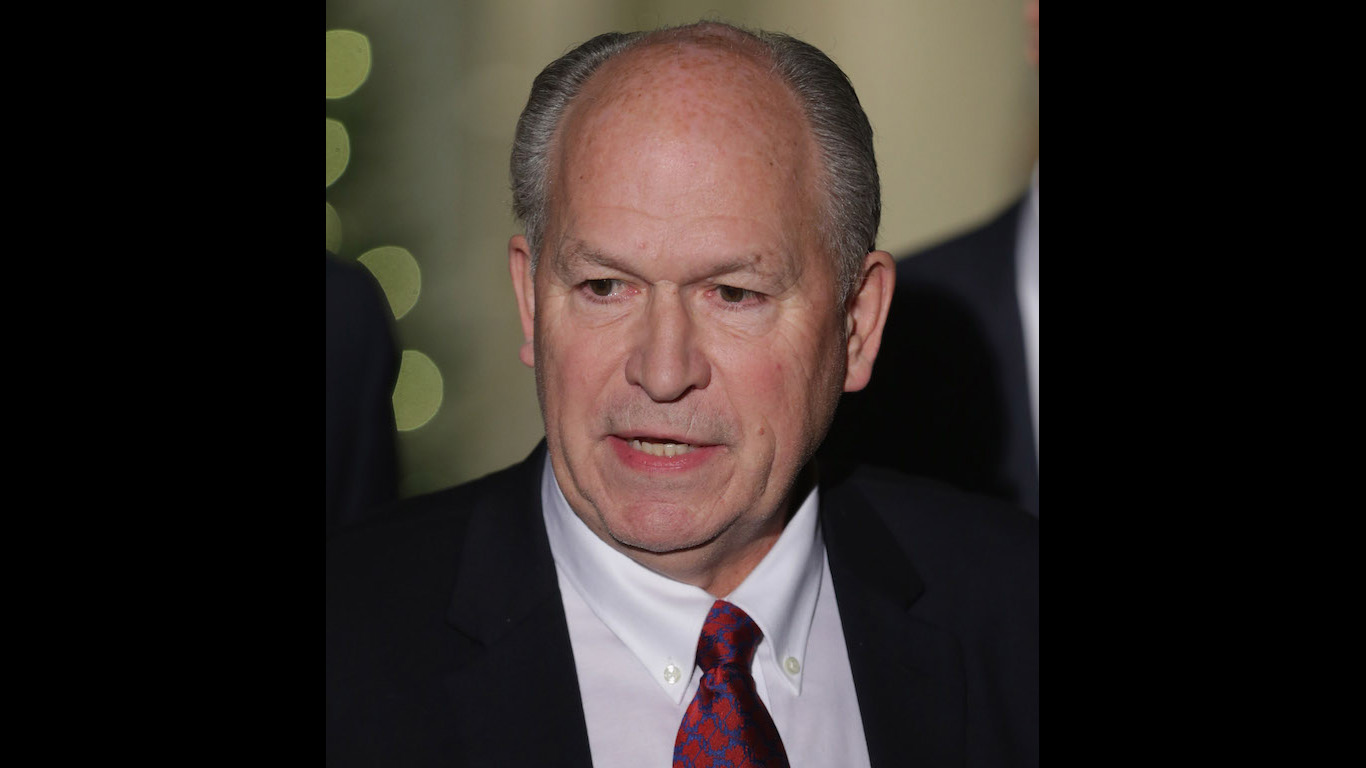
23. Bill Walker (Independent) – Alaska
> Salary: $145,000
> Present term: December 2014 – December 2018
> State tax collections: $1,405 per capita (the lowest)
> Statewide cost of living: 16.4% more expensive than avg. (10th highest)
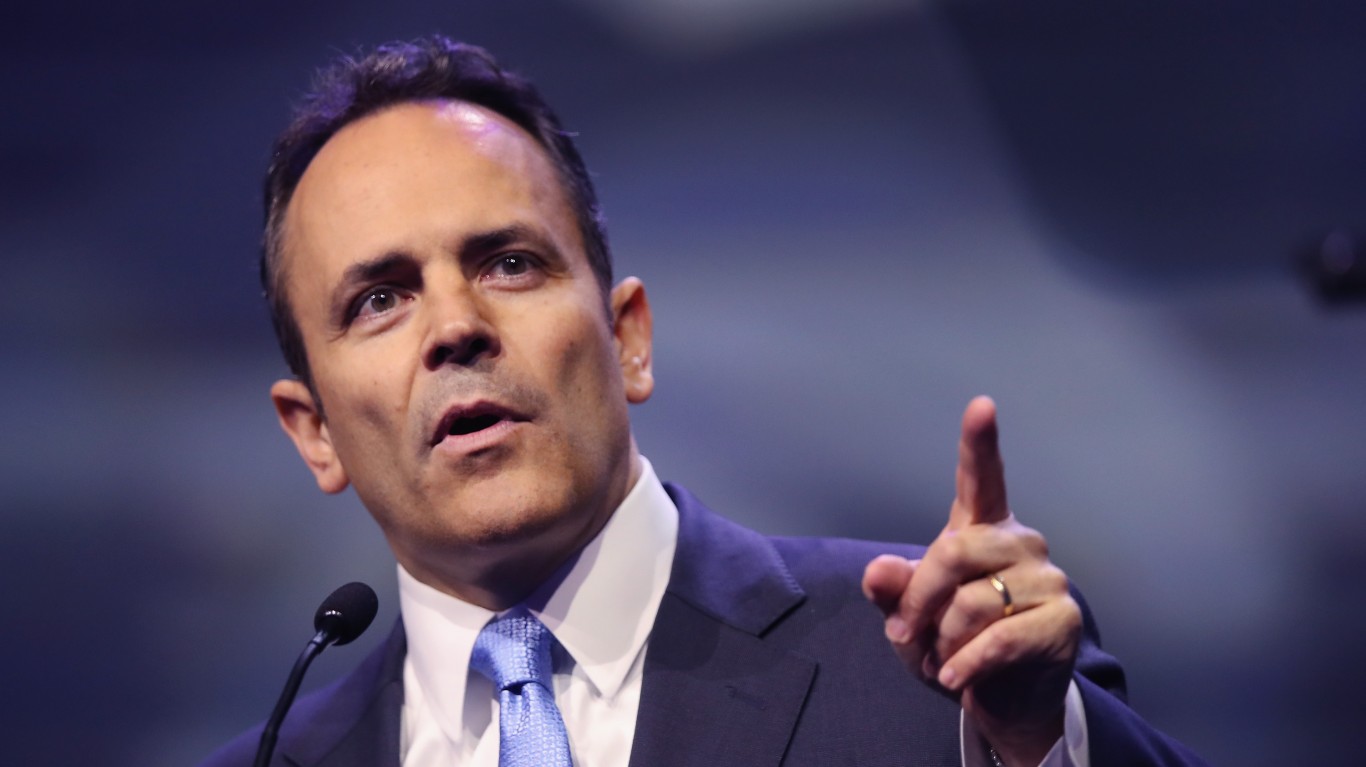
22. Matt Bevin (R) – Kentucky
> Salary: $145,992
> Present term: December 2015 – December 2019
> State tax collections: $2,655 per capita (24th lowest)
> Statewide cost of living: 3.1% less expensive than avg. (5th lowest)
[in-text-ad-2]

21. Scott Walker (R) – Wisconsin
> Salary: $146,786
> Present term: January 2015 – January 2019
> State tax collections: $3,050 per capita (18th highest)
> Statewide cost of living: 2.5% more expensive than avg. (20th lowest)

20. Mary Fallin (R) – Oklahoma
> Salary: $147,000
> Present term: January 2015 – January 2019
> State tax collections: $2,165 per capita (13th lowest)
> Statewide cost of living: 1.7% less expensive than avg. (7th lowest)
[in-text-ad]

19. John Kasich (R) – Ohio
> Salary: $148,886
> Present term: January 2015 – January 2019
> State tax collections: $2,469 per capita (16th lowest)
> Statewide cost of living: 1.4% less expensive than avg. (8th lowest)
[recirclink id=488247]

18. Brian Sandoval (R) – Nevada
> Salary: $149,573
> Present term: January 2015 – January 2019
> State tax collections: $2,730 per capita (24th highest)
> Statewide cost of living: 7.6% more expensive than avg. (22nd highest)

17. Dan Malloy (D) – Connecticut
> Salary: $150,000
> Present term: January 2015 – January 2019
> State tax collections: $4,249 per capita (5th highest)
> Statewide cost of living: 20.1% more expensive than avg. (6th highest)
[in-text-ad-2]
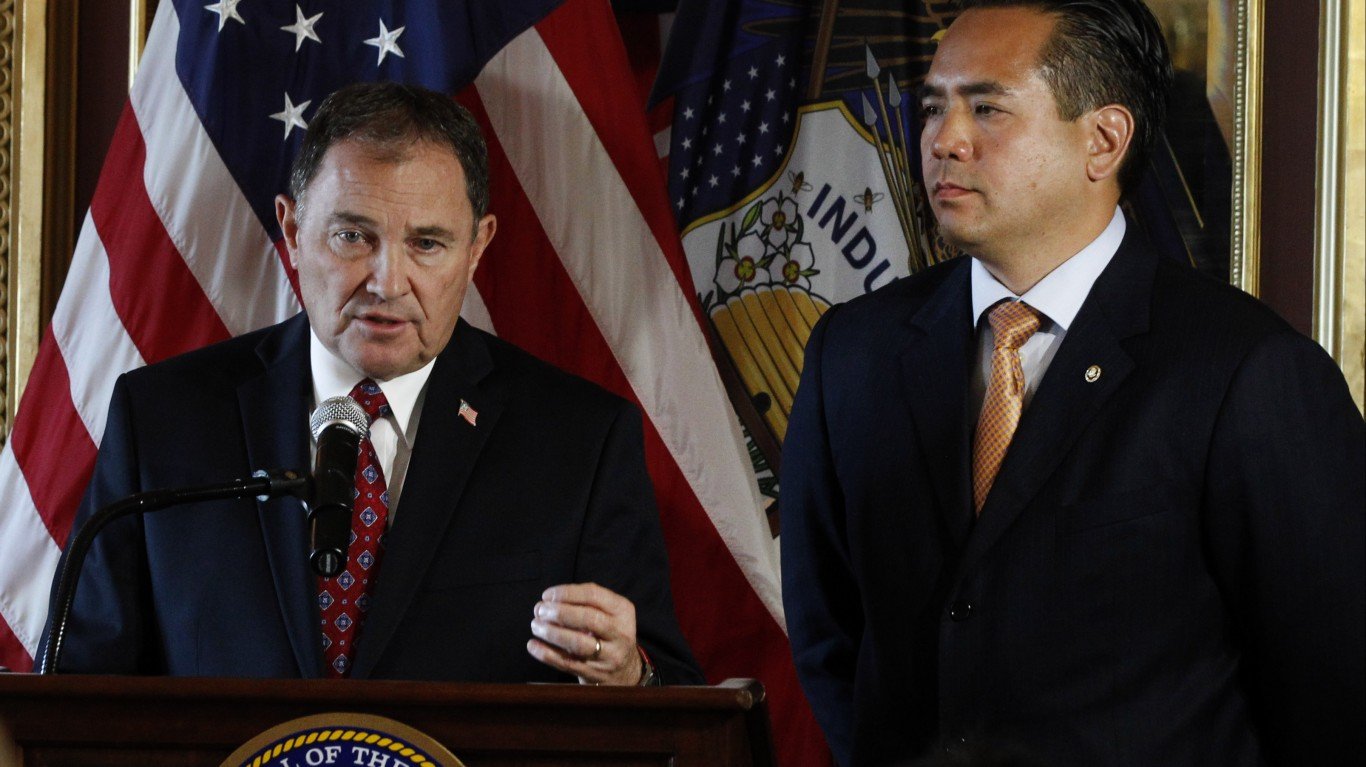
16. Gary R. Herbert (R) – Utah
> Salary: $150,000
> Present term: January 2017 – January 2021
> State tax collections: $2,327 per capita (15th lowest)
> Statewide cost of living: 7.5% more expensive than avg. (23rd highest)

15. Virginia Jim Justice (R) – West Virginia
> Salary: $150,000
> Present term: January 2017 – January 2021
> State tax collections: $2,804 per capita (21st highest)
> Statewide cost of living: 3.3% less expensive than avg. (4th lowest)
[in-text-ad]

14. Charlie Baker (R) – Massachusetts
> Salary: $151,800
> Present term: January 2015 – January 2019
> State tax collections: $3,998 per capita (7th highest)
> Statewide cost of living: 19.1% more expensive than avg. (7th highest)
[recirclink id=488174]

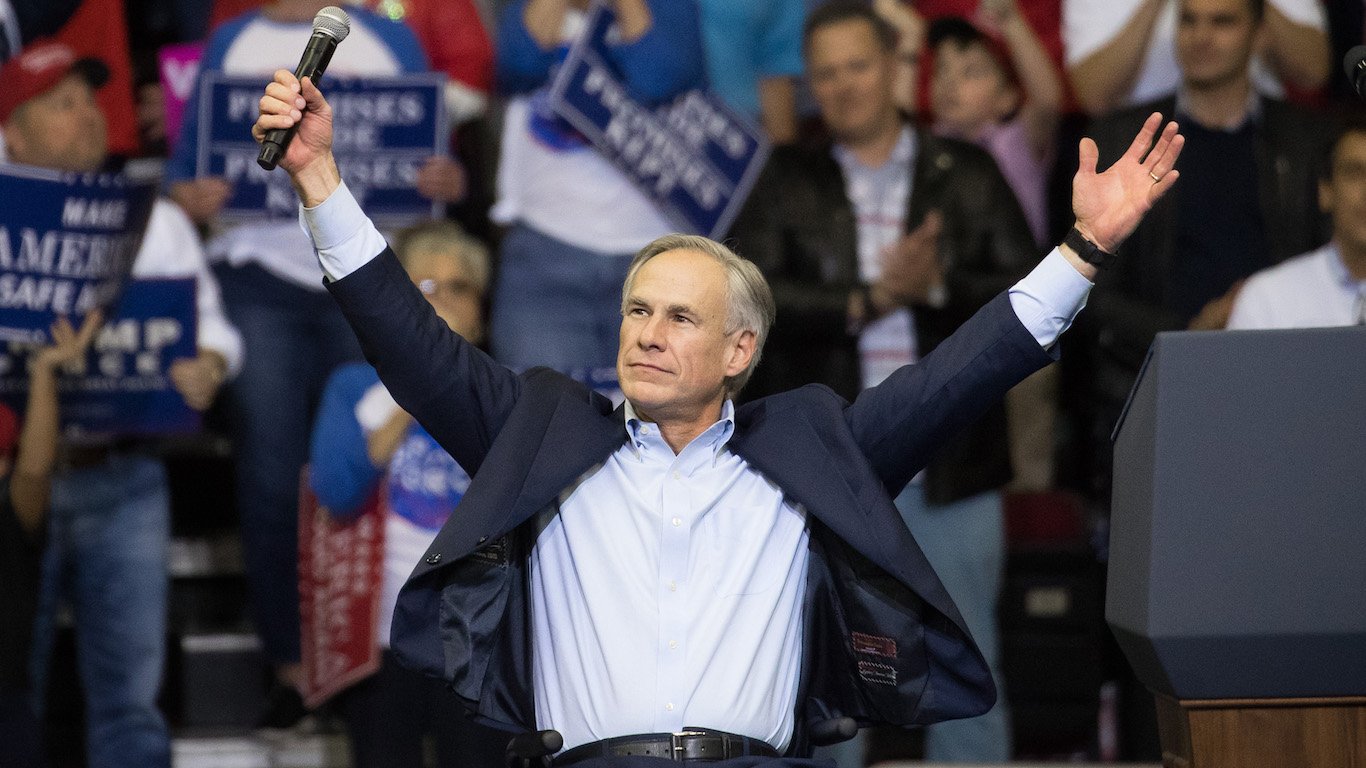
13. Greg Abbott (R) – Texas
> Salary: $153,750
> Present term: January 2015 – January 2019
> State tax collections: $1,868 per capita (3rd lowest)
> Statewide cost of living: 7.1% more expensive than avg. (24th highest)

12. David Ige (D) – Hawaii
> Salary: $155,592
> Present term: December 2014 – December 2018
> State tax collections: $4,843 per capita (3rd highest)
> Statewide cost of living: 30.8% more expensive than avg. (the highest)
[in-text-ad-2]

11. Rick Snyder (R) – Michigan
> Salary: $159,300
> Present term: January 2015 – January 2019
> State tax collections: $2,762 per capita (23rd highest)
> Statewide cost of living: 3.0% more expensive than avg. (22nd lowest)

10. Phil Scott (R) – Vermont
> Salary: $166,046
> Present term: January 2017 – January 2019
> State tax collections: $4,950 per capita (the highest)
> Statewide cost of living: 12.3% more expensive than avg. (13th highest)
[in-text-ad]

9. Larry Hogan (R) – Maryland
> Salary: $170,000
> Present term: January 2015 – January 2019
> State tax collections: $3,468 per capita (11th highest)
> Statewide cost of living: 20.9% more expensive than avg. (5th highest)
[recirclink id=487977]
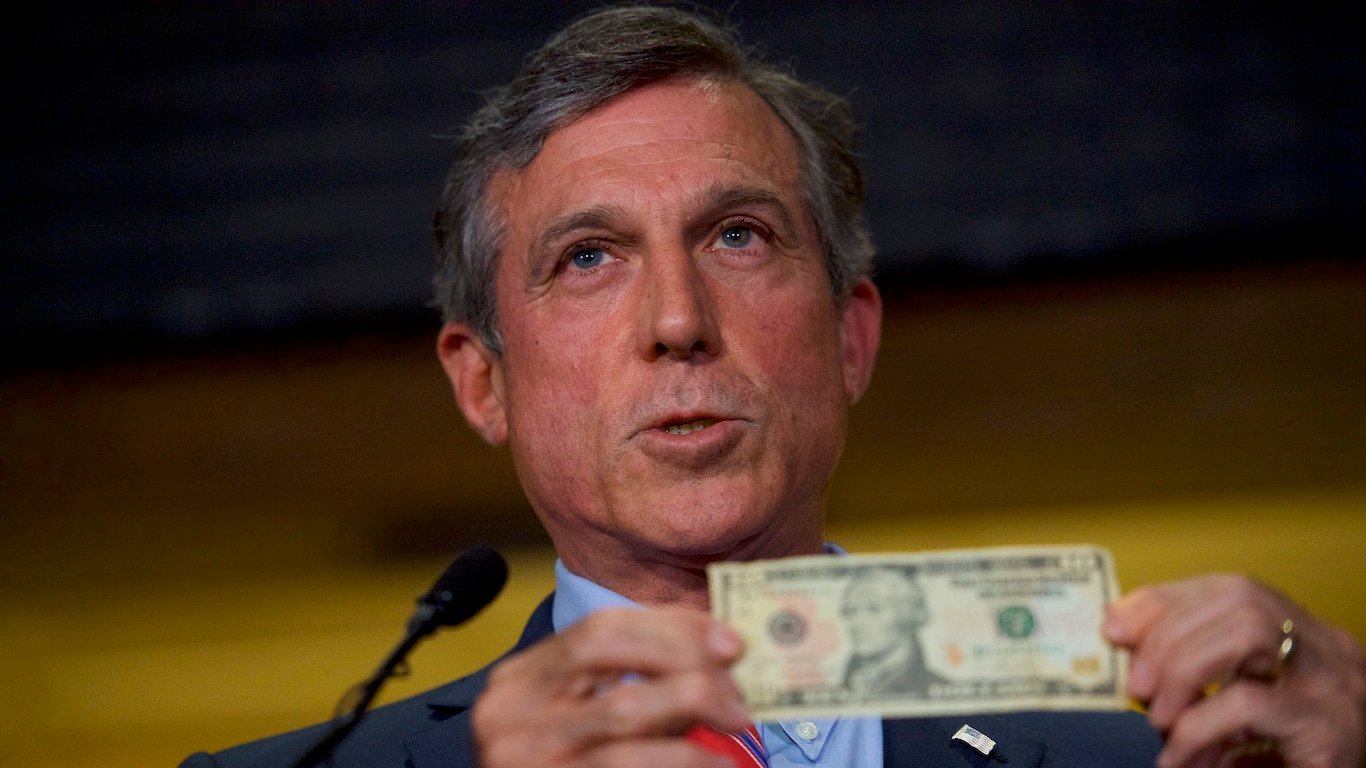
8. John Carney (D) – Delaware
> Salary: $171,000
> Present term: January 2017 – January 2021
> State tax collections: $3,697 per capita (9th highest)
> Statewide cost of living: 10.7% more expensive than avg. (14th highest)
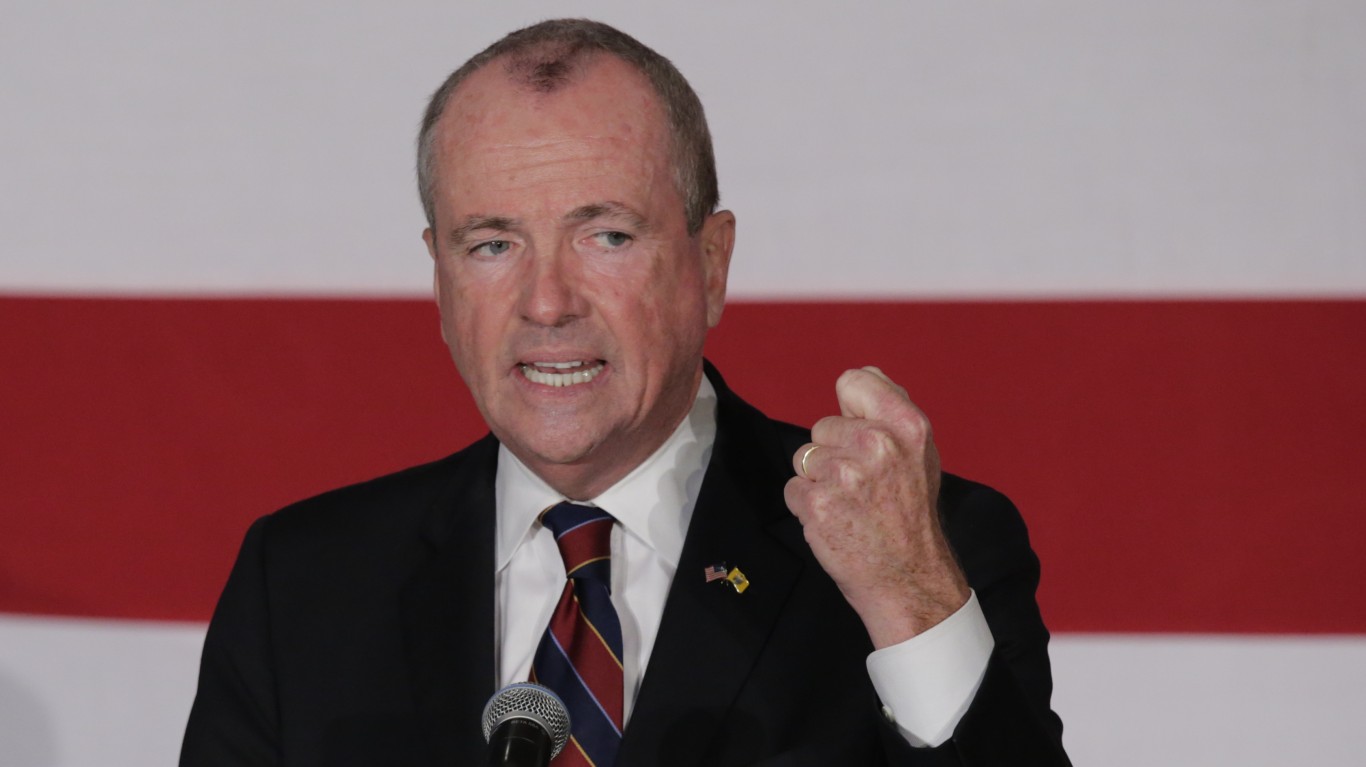
7. Phil Murphy (D) – New Jersey
> Salary: $175,000
> Present term: January 2018 – January 2022
> State tax collections: $3,514 per capita (10th highest)
> Statewide cost of living: 25.0% more expensive than avg. (4th highest)
[in-text-ad-2]

6. Ralph Northam (D) – Virginia
> Salary: $175,000
> Present term: January 2018 – January 2022
> State tax collections: $2,522 per capita (18th lowest)
> Statewide cost of living: 13.0% more expensive than avg. (12th highest)

5. Jay Inslee (D) – Washington
> Salary: $175,353
> Present term: January 2017 – January 2021
> State tax collections: $3,060 per capita (16th highest)
> Statewide cost of living: 16.6% more expensive than avg. (9th highest)
[in-text-ad]
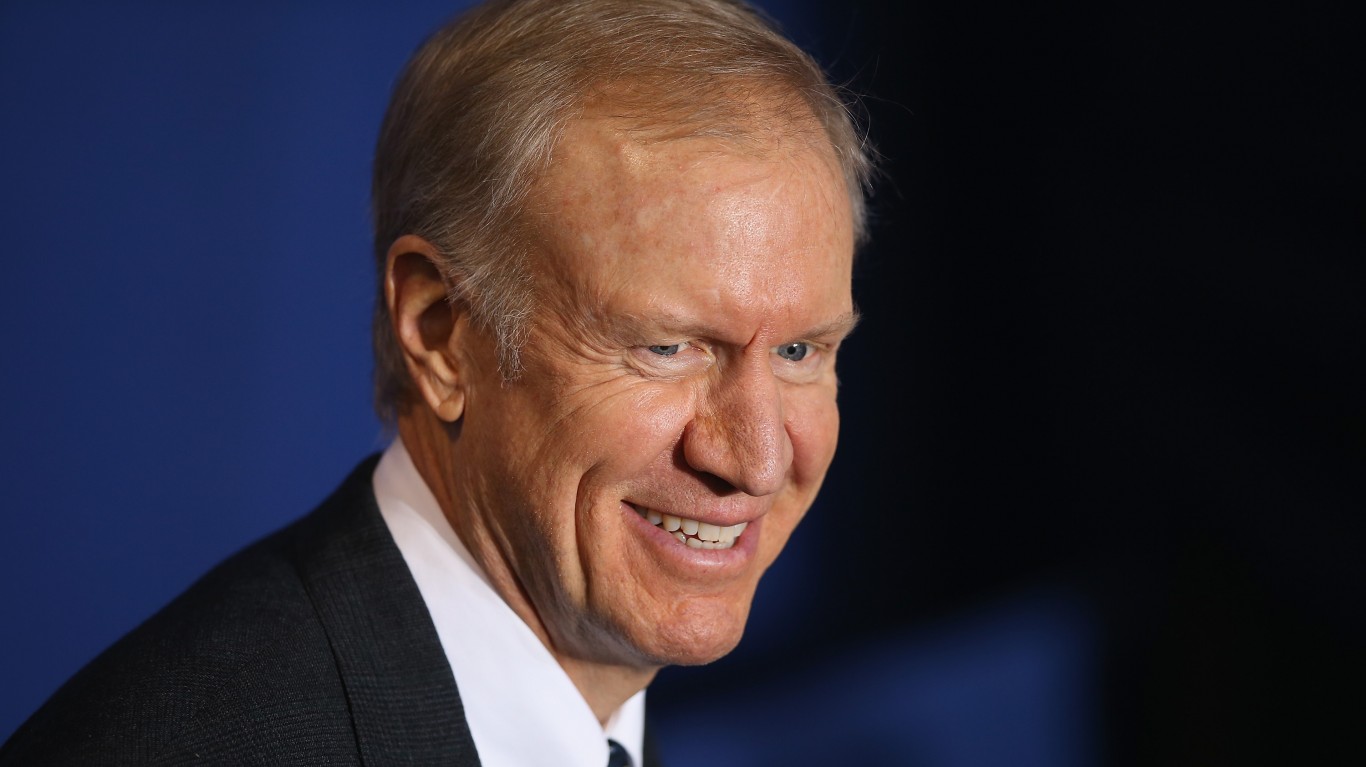
4. Bruce Rauner (R) – Illinois
> Salary: $177,412
> Present term: January 2015 – January 2019
> State tax collections: $2,854 per capita (20th highest)
> Statewide cost of living: 9.3% more expensive than avg. (18th highest)
[recirclink id=487572]
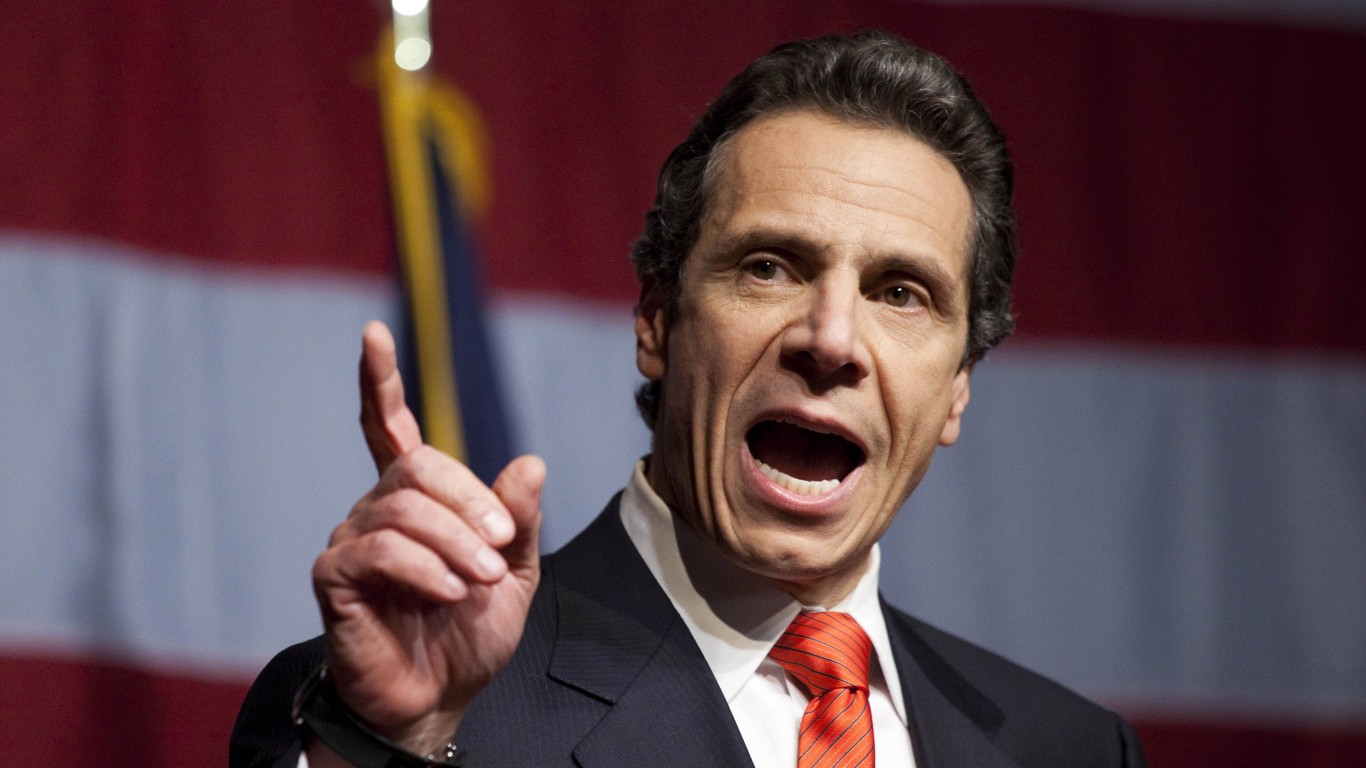
3. Andrew Cuomo (D) – New York
> Salary: $179,000
> Present term: January 2015 – January 2019
> State tax collections: $4,101 per capita (6th highest)
> Statewide cost of living: 27.7% more expensive than avg. (2nd highest)
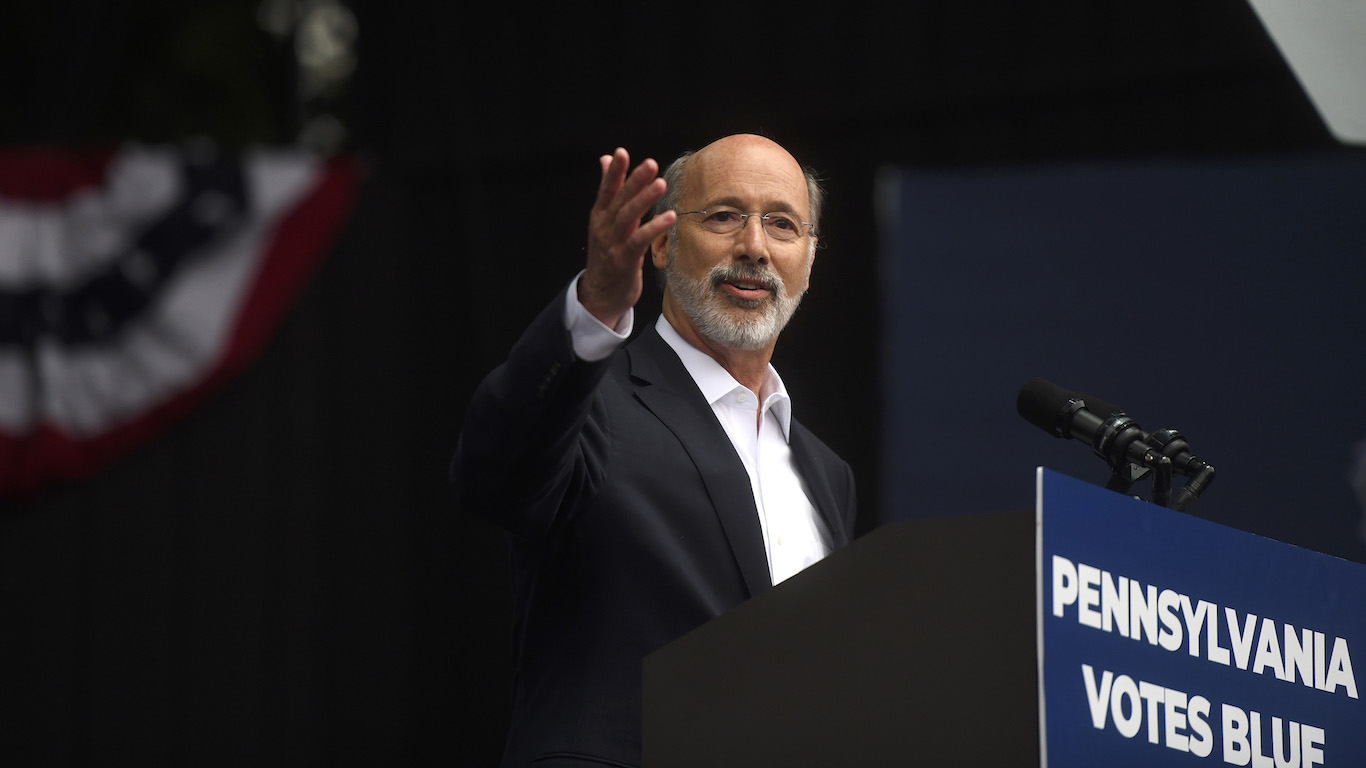
2. Tom Wolf (D) – Pennsylvania
> Salary: $194,850
> Present term: January 2015 – January 2019
> State tax collections: $2,924 per capita (19th highest)
> Statewide cost of living: 8.7% more expensive than avg. (19th highest)
[in-text-ad-2]
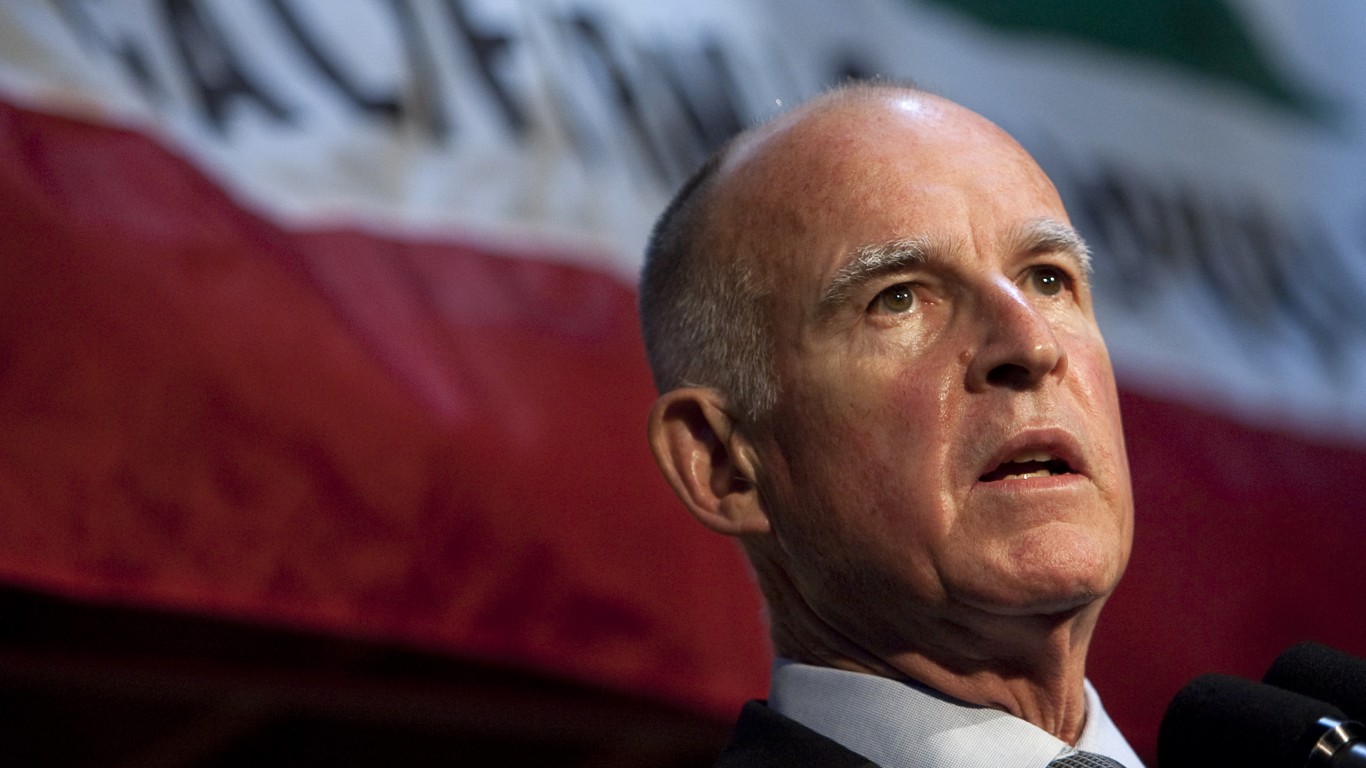
1. Jerry Brown (D) – California
> Salary: $195,803
> Present term: January 2015 – January 2019
> State tax collections: $3,950 per capita (8th highest)
> Statewide cost of living: 26.4% more expensive than avg. (3rd highest)
Detailed Findings
In all states, governors’ salaries are not tied to their party affiliation. However, the highest-paid sitting governors are disproportionately Democrats. Outgoing Illinois Gov. Bruce Rauner is the only Republican to rank among the five governors with the highest salaries.
States with high salaries for their chief executives tend to have relatively high government spending in general, as reflected by tax collections. Annual state tax collections per capita exceed the $2,869 average across all states in eight of the 10 states with the highest-paid governors. Meanwhile, per-capita state tax collections are below average in eight of the 10 states with the the lowest-salaried governors.
Overall cost of living may also be a factor in determining a governor’s salary. States such as California and New York have two of the three highest-paid governors in the country. They also have a near nation-leading cost of living — 26.4% and 27.7% more expensive than the average cost of living nationwide, respectively.
Of course, the amount of money a state allocates to its governor’s salary does not always reflect what that governor collects. For example, Rick Scott has refused the Florida governor’s salary of $130,273, to which he is entitled, every year since taking office. Illinois Gov. Bruce Rauner only accepts $1 a year in taxpayer money and does not use state benefits. The governors of Michigan, New York, North Dakota, Rhode Island, and Tennessee also take either a reduced salary or return their salary to the state.
Often, these governors are independently wealthy. For example, according to Scott’s most recent tax return, he earned $83 million through investments in 2017.
Methodology
To identify America’s highest paid governors, 24/7 Wall St. reviewed governor compensation data from The Council of State Governments. State governors were ranked by the listed salary for the position as of April 2018. Our ranking did not change to reflect governors who refuse or reduce their salaries. State tax collections per capita came from the Tax Foundation and are for fiscal 2016. Cost of living is from the Bureau of Economic Analysis and is as of 2016.
Contact [email protected] for any questions or corrections.