
The United States federalist system divides and shares powers between the federal government, each of the 50 states, and tens of thousands of county and municipal authorities. As may be expected across such a broad, decentralized spectrum, the economic impact and size of the public sector varies considerably by region.
Using data from the Bureau of Economic Analysis, 24/7 Wall St. calculated state and local government GDP in every state to identify the states with the largest and smallest governments. We ranked states based on combined state and local government GDP per capita. Differences in the size of state and local governments are driven by a range of factors, including climate, the economy, and the priorities of local voters.
Examples of the kinds of state and local government expenditures that would factor into GDP include social spending, schools, water treatment, police cars, and snow plows. State and local government employee salaries also contribute to overall state GDP, and as a result, some of the states that rank highest on this list are also the states where the most people work for the government.
The states that rank highest on this list are those that spend the most on goods and services on a per capita basis — and high government spending requires funding. High-ranking states on this list tend to have high median household incomes, which translates to a strong tax base. Several of the states with the largest governments are also the states where Americans are paying the most taxes.
There are exceptions, however. Several of the states with the largest governments have relatively low taxes per capita and fund government operations largely through resource extraction. In Alaska, for example, residents are even paid annual dividends that come from oil extraction royalties.
The size of a state’s government as measured by GDP is not necessarily an indication of how effective it is. Only four of the 10 states with the largest governments also rank among the top 10 best-run states.
Click here to see the states with the biggest and smallest governments
Click here to read our methodology

50. Florida
> State and local gov’t. GDP per capita: $3,392
> Total GDP per capita: $43,052 (10th lowest)
> State and local gov’t. employees: 10.9% of workforce (4th lowest)
> Median household income: $52,594 (12th lowest)
[in-text-ad]

49. Indiana
> State and local gov’t. GDP per capita: $3,494
> Total GDP per capita: $48,738 (19th lowest)
> State and local gov’t. employees: 12.3% of workforce (8th lowest)
> Median household income: $54,181 (17th lowest)
[recirclink id=530014]

48. Tennessee
> State and local gov’t. GDP per capita: $3,658
> Total GDP per capita: $47,695 (15th lowest)
> State and local gov’t. employees: 12.6% of workforce (12th lowest)
> Median household income: $51,340 (10th lowest)

47. Idaho
> State and local gov’t. GDP per capita: $3,686
> Total GDP per capita: $39,843 (4th lowest)
> State and local gov’t. employees: 15.1% of workforce (17th highest)
> Median household income: $52,225 (11th lowest)
[in-text-ad-2]

46. Arkansas
> State and local gov’t. GDP per capita: $3,710
> Total GDP per capita: $38,467 (2nd lowest)
> State and local gov’t. employees: 15.1% of workforce (16th highest)
> Median household income: $45,869 (3rd lowest)

45. Georgia
> State and local gov’t. GDP per capita: $3,758
> Total GDP per capita: $49,663 (22nd lowest)
> State and local gov’t. employees: 12.9% of workforce (15th lowest)
> Median household income: $56,183 (19th lowest)
[in-text-ad]

44. Kentucky
> State and local gov’t. GDP per capita: $3,760
> Total GDP per capita: $41,659 (7th lowest)
> State and local gov’t. employees: 14.2% of workforce (22nd highest)
> Median household income: $48,375 (7th lowest)
[recirclink id=510120]

43. Missouri
> State and local gov’t. GDP per capita: $3,791
> Total GDP per capita: $46,064 (13th lowest)
> State and local gov’t. employees: 13.0% of workforce (16th lowest)
> Median household income: $53,578 (15th lowest)

42. Arizona
> State and local gov’t. GDP per capita: $3,795
> Total GDP per capita: $43,096 (11th lowest)
> State and local gov’t. employees: 12.4% of workforce (9th lowest)
> Median household income: $56,581 (23rd lowest)
[in-text-ad-2]
41. Pennsylvania
> State and local gov’t. GDP per capita: $3,833
> Total GDP per capita: $55,602 (20th highest)
> State and local gov’t. employees: 10.0% of workforce (2nd lowest)
> Median household income: $59,195 (24th highest)

40. Michigan
> State and local gov’t. GDP per capita: $3,895
> Total GDP per capita: $46,858 (14th lowest)
> State and local gov’t. employees: 12.5% of workforce (10th lowest)
> Median household income: $54,909 (18th lowest)
[in-text-ad]

39. West Virginia
> State and local gov’t. GDP per capita: $3,912
> Total GDP per capita: $39,495 (3rd lowest)
> State and local gov’t. employees: 17.3% of workforce (6th highest)
> Median household income: $43,469 (the lowest)
[recirclink id=531165]

38. Maine
> State and local gov’t. GDP per capita: $3,965
> Total GDP per capita: $42,356 (9th lowest)
> State and local gov’t. employees: 13.4% of workforce (21st lowest)
> Median household income: $56,277 (20th lowest)

37. Louisiana
> State and local gov’t. GDP per capita: $3,991
> Total GDP per capita: $49,606 (21st lowest)
> State and local gov’t. employees: 14.9% of workforce (18th highest)
> Median household income: $46,145 (4th lowest)
[in-text-ad-2]

36. Mississippi
> State and local gov’t. GDP per capita: $4,027
> Total GDP per capita: $34,029 (the lowest)
> State and local gov’t. employees: 18.6% of workforce (3rd highest)
> Median household income: $43,529 (2nd lowest)

35. Utah
> State and local gov’t. GDP per capita: $4,047
> Total GDP per capita: $49,740 (23rd lowest)
> State and local gov’t. employees: 13.8% of workforce (25th lowest)
> Median household income: $68,358 (13th highest)
[in-text-ad]

34. Nevada
> State and local gov’t. GDP per capita: $4,065
> Total GDP per capita: $48,189 (18th lowest)
> State and local gov’t. employees: 10.0% of workforce (the lowest)
> Median household income: $58,003 (25th lowest)
[recirclink id=551798]

33. Alabama
> State and local gov’t. GDP per capita: $4,078
> Total GDP per capita: $40,279 (6th lowest)
> State and local gov’t. employees: 16.1% of workforce (10th highest)
> Median household income: $48,123 (6th lowest)

32. Rhode Island
> State and local gov’t. GDP per capita: $4,123
> Total GDP per capita: $50,827 (24th lowest)
> State and local gov’t. employees: 10.1% of workforce (3rd lowest)
> Median household income: $63,870 (15th highest)
[in-text-ad-2]

31. Ohio
> State and local gov’t. GDP per capita: $4,127
> Total GDP per capita: $51,456 (25th highest)
> State and local gov’t. employees: 12.5% of workforce (11th lowest)
> Median household income: $54,021 (16th lowest)

30. New Hampshire
> State and local gov’t. GDP per capita: $4,129
> Total GDP per capita: $55,744 (19th highest)
> State and local gov’t. employees: 11.8% of workforce (6th lowest)
> Median household income: $73,381 (6th highest)
[in-text-ad]

29. Montana
> State and local gov’t. GDP per capita: $4,173
> Total GDP per capita: $42,173 (8th lowest)
> State and local gov’t. employees: 16.1% of workforce (9th highest)
> Median household income: $53,386 (14th lowest)
[recirclink id=530014]

28. North Carolina
> State and local gov’t. GDP per capita: $4,194
> Total GDP per capita: $47,778 (16th lowest)
> State and local gov’t. employees: 14.4% of workforce (20th highest)
> Median household income: $52,752 (13th lowest)

27. Texas
> State and local gov’t. GDP per capita: $4,249
> Total GDP per capita: $58,417 (15th highest)
> State and local gov’t. employees: 13.8% of workforce (24th lowest)
> Median household income: $59,206 (23rd highest)
[in-text-ad-2]

26. South Dakota
> State and local gov’t. GDP per capita: $4,253
> Total GDP per capita: $51,997 (23rd highest)
> State and local gov’t. employees: 15.4% of workforce (13th highest)
> Median household income: $56,521 (22nd lowest)

25. Illinois
> State and local gov’t. GDP per capita: $4,425
> Total GDP per capita: $59,980 (12th highest)
> State and local gov’t. employees: 12.1% of workforce (7th lowest)
> Median household income: $62,992 (16th highest)
[in-text-ad]

24. Colorado
> State and local gov’t. GDP per capita: $4,474
> Total GDP per capita: $59,057 (13th highest)
> State and local gov’t. employees: 14.2% of workforce (21st highest)
> Median household income: $69,117 (11th highest)
[recirclink id=510120]

23. Virginia
> State and local gov’t. GDP per capita: $4,485
> Total GDP per capita: $55,929 (18th highest)
> State and local gov’t. employees: 13.5% of workforce (22nd lowest)
> Median household income: $71,535 (9th highest)

22. Maryland
> State and local gov’t. GDP per capita: $4,488
> Total GDP per capita: $60,886 (11th highest)
> State and local gov’t. employees: 13.1% of workforce (17th lowest)
> Median household income: $80,776 (the highest)
[in-text-ad-2]

21. South Carolina
> State and local gov’t. GDP per capita: $4,557
> Total GDP per capita: $39,883 (5th lowest)
> State and local gov’t. employees: 15.5% of workforce (12th highest)
> Median household income: $50,570 (9th lowest)

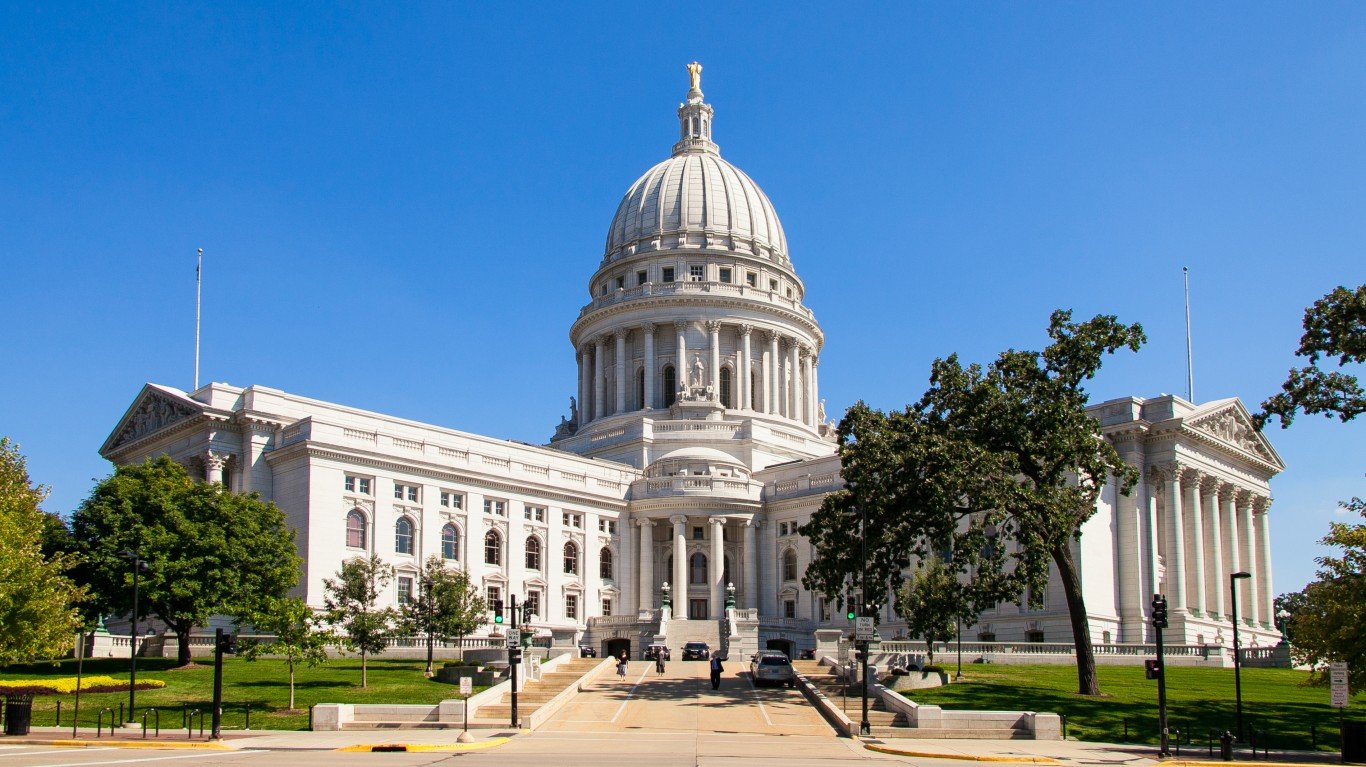
20. Wisconsin
> State and local gov’t. GDP per capita: $4,580
> Total GDP per capita: $51,575 (24th highest)
> State and local gov’t. employees: 12.6% of workforce (13th lowest)
> Median household income: $59,305 (22nd highest)
[in-text-ad]
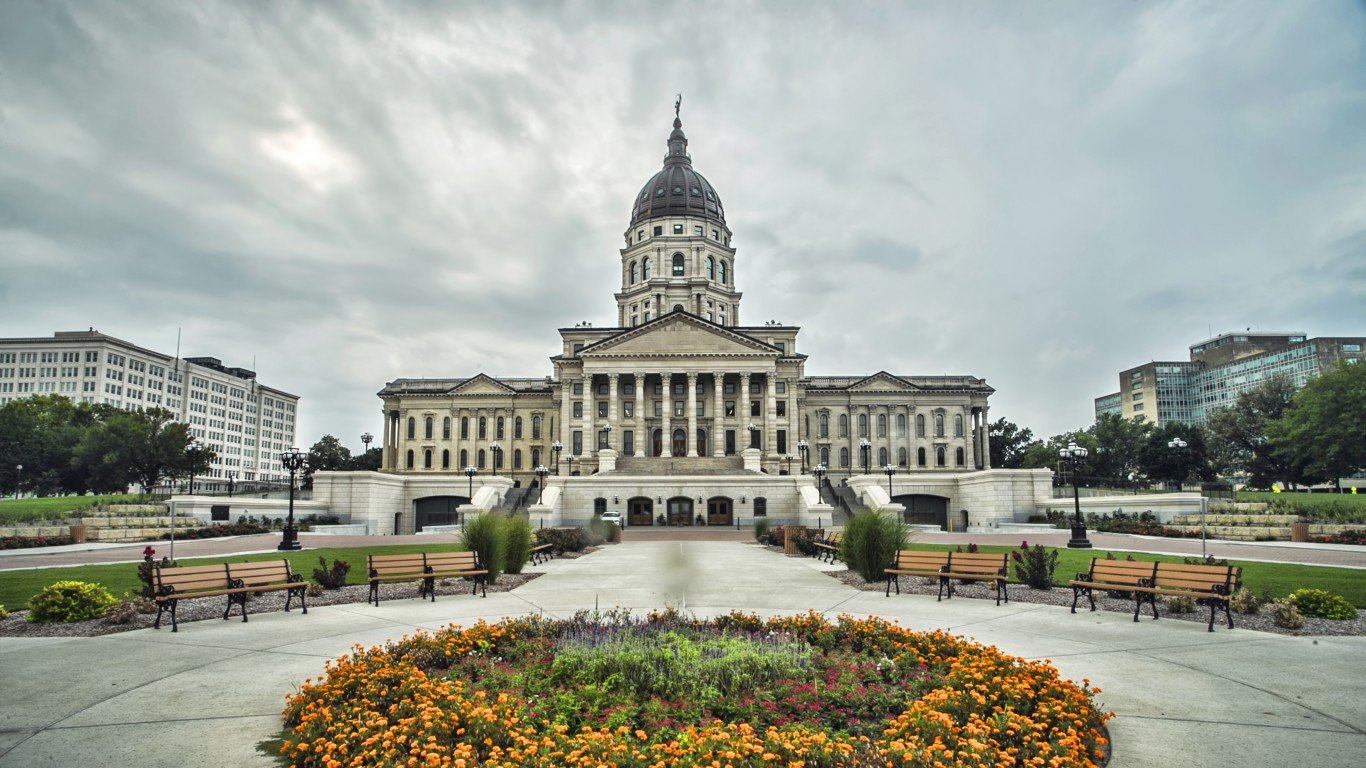
19. Kansas
> State and local gov’t. GDP per capita: $4,588
> Total GDP per capita: $52,297 (22nd highest)
> State and local gov’t. employees: 16.4% of workforce (8th highest)
> Median household income: $56,422 (21st lowest)
[recirclink id=531165]

18. Minnesota
> State and local gov’t. GDP per capita: $4,589
> Total GDP per capita: $59,057 (13th highest)
> State and local gov’t. employees: 13.3% of workforce (20th lowest)
> Median household income: $68,388 (12th highest)

17. Oklahoma
> State and local gov’t. GDP per capita: $4,680
> Total GDP per capita: $48,954 (20th lowest)
> State and local gov’t. employees: 17.5% of workforce (5th highest)
> Median household income: $50,051 (8th lowest)
[in-text-ad-2]

16. Massachusetts
> State and local gov’t. GDP per capita: $4,885
> Total GDP per capita: $72,635 (2nd highest)
> State and local gov’t. employees: 11.2% of workforce (5th lowest)
> Median household income: $77,385 (4th highest)

15. New Mexico
> State and local gov’t. GDP per capita: $4,900
> Total GDP per capita: $44,187 (12th lowest)
> State and local gov’t. employees: 18.3% of workforce (4th highest)
> Median household income: $46,744 (5th lowest)
[in-text-ad]

14. Vermont
> State and local gov’t. GDP per capita: $4,928
> Total GDP per capita: $47,921 (17th lowest)
> State and local gov’t. employees: 15.6% of workforce (11th highest)
> Median household income: $57,513 (24th lowest)
[recirclink id=551798]

13. Hawaii
> State and local gov’t. GDP per capita: $4,958
> Total GDP per capita: $56,880 (17th highest)
> State and local gov’t. employees: 14.1% of workforce (23rd highest)
> Median household income: $77,765 (3rd highest)

12. Oregon
> State and local gov’t. GDP per capita: $5,046
> Total GDP per capita: $50,996 (25th lowest)
> State and local gov’t. employees: 13.9% of workforce (25th highest)
> Median household income: $60,212 (20th highest)
[in-text-ad-2]

11. Delaware
> State and local gov’t. GDP per capita: $5,063
> Total GDP per capita: $66,023 (9th highest)
> State and local gov’t. employees: 13.2% of workforce (19th lowest)
> Median household income: $62,852 (17th highest)

10. Iowa
> State and local gov’t. GDP per capita: $5,113
> Total GDP per capita: $54,101 (21st highest)
> State and local gov’t. employees: 15.2% of workforce (15th highest)
> Median household income: $58,570 (25th highest)
[in-text-ad]

9. New Jersey
> State and local gov’t. GDP per capita: $5,153
> Total GDP per capita: $62,263 (10th highest)
> State and local gov’t. employees: 13.2% of workforce (18th lowest)
> Median household income: $80,088 (2nd highest)
[recirclink id=530014]

8. Connecticut
> State and local gov’t. GDP per capita: $5,162
> Total GDP per capita: $67,784 (4th highest)
> State and local gov’t. employees: 12.9% of workforce (14th lowest)
> Median household income: $74,168 (5th highest)

7. North Dakota
> State and local gov’t. GDP per capita: $5,433
> Total GDP per capita: $67,308 (6th highest)
> State and local gov’t. employees: 16.8% of workforce (7th highest)
> Median household income: $61,843 (18th highest)
[in-text-ad-2]

6. Nebraska
> State and local gov’t. GDP per capita: $5,621
> Total GDP per capita: $58,141 (16th highest)
> State and local gov’t. employees: 15.3% of workforce (14th highest)
> Median household income: $59,970 (21st highest)

5. California
> State and local gov’t. GDP per capita: $5,638
> Total GDP per capita: $67,698 (5th highest)
> State and local gov’t. employees: 13.6% of workforce (23rd lowest)
> Median household income: $71,805 (8th highest)
[in-text-ad]

4. Washington
> State and local gov’t. GDP per capita: $5,653
> Total GDP per capita: $67,242 (7th highest)
> State and local gov’t. employees: 14.6% of workforce (19th highest)
> Median household income: $70,979 (10th highest)
[recirclink id=510120]

3. New York
> State and local gov’t. GDP per capita: $6,072
> Total GDP per capita: $73,531 (the highest)
> State and local gov’t. employees: 14.1% of workforce (24th highest)
> Median household income: $64,894 (14th highest)

2. Wyoming
> State and local gov’t. GDP per capita: $7,415
> Total GDP per capita: $66,413 (8th highest)
> State and local gov’t. employees: 21.1% of workforce (the highest)
> Median household income: $60,434 (19th highest)
[in-text-ad-2]

1. Alaska
> State and local gov’t. GDP per capita: $7,443
> Total GDP per capita: $70,936 (3rd highest)
> State and local gov’t. employees: 19.8% of workforce (2nd highest)
> Median household income: $73,181 (7th highest)
Methodology
To determine the states with the biggest (and smallest) governments, 24/7 Wall St. ranked states based on the combined GDP per capita of state and local governments in 2017 with data from the Bureau of Economic Analysis. GDP per capita across all industries for 2018 also came from the BEA. State and local government employees as a share of total employment came from the Bureau of Labor Statistics and is for April 2019. Median household income came from the U.S. Census Bureau’s American Community Survey and is for 2017.
Contact [email protected] for any questions or corrections.