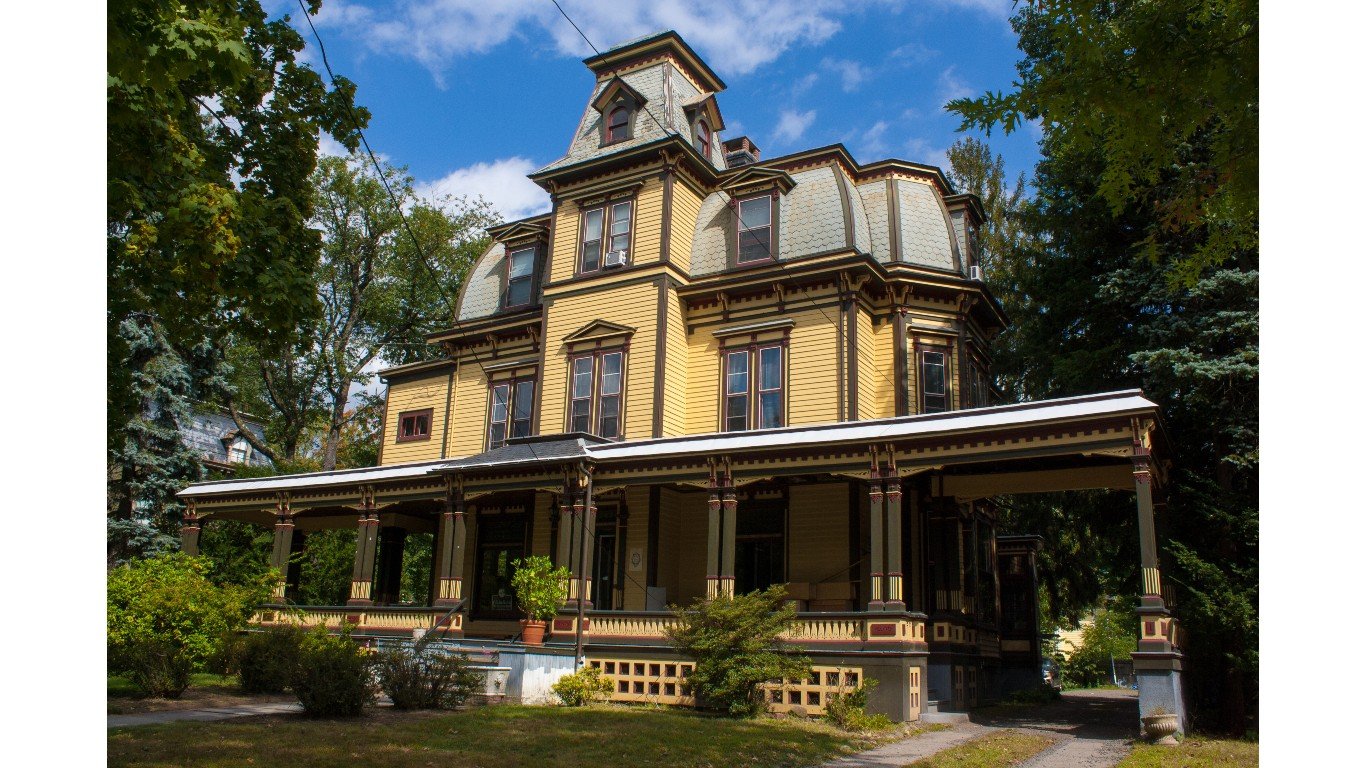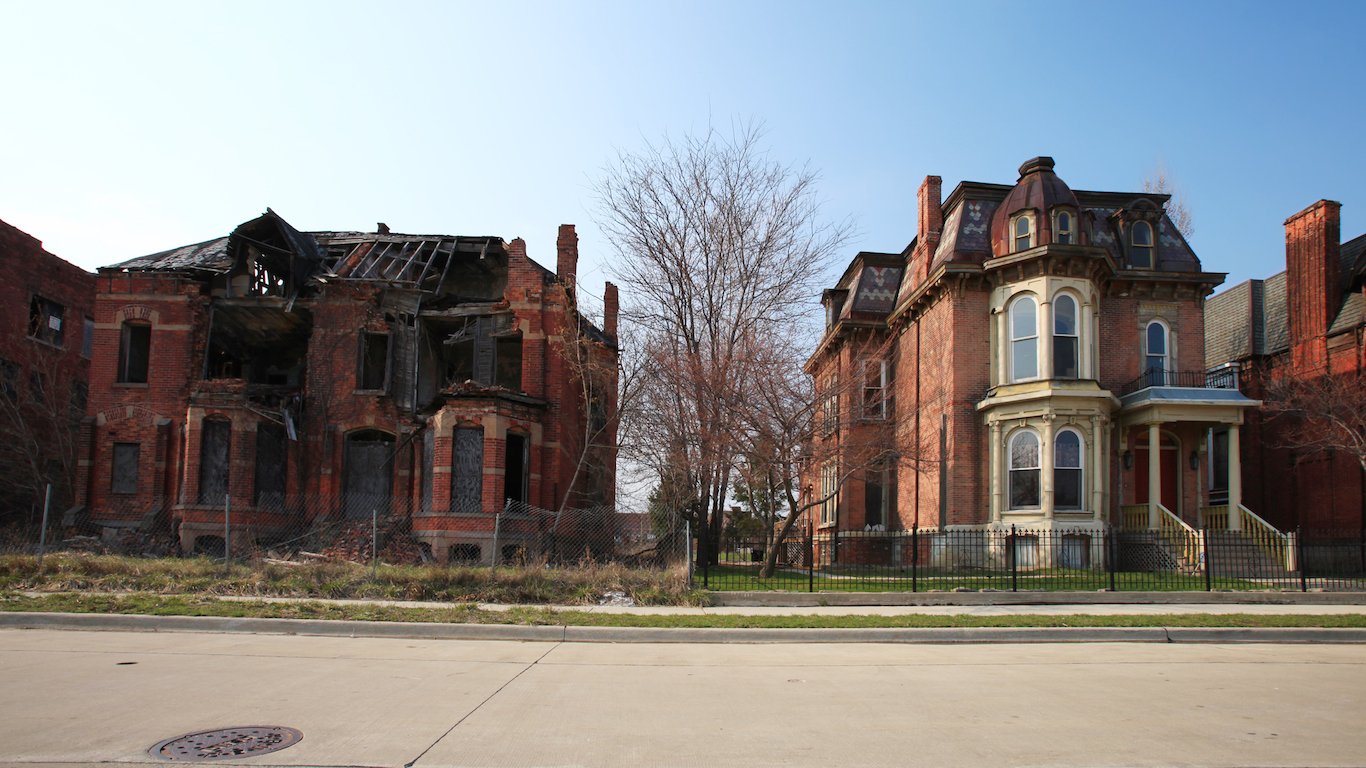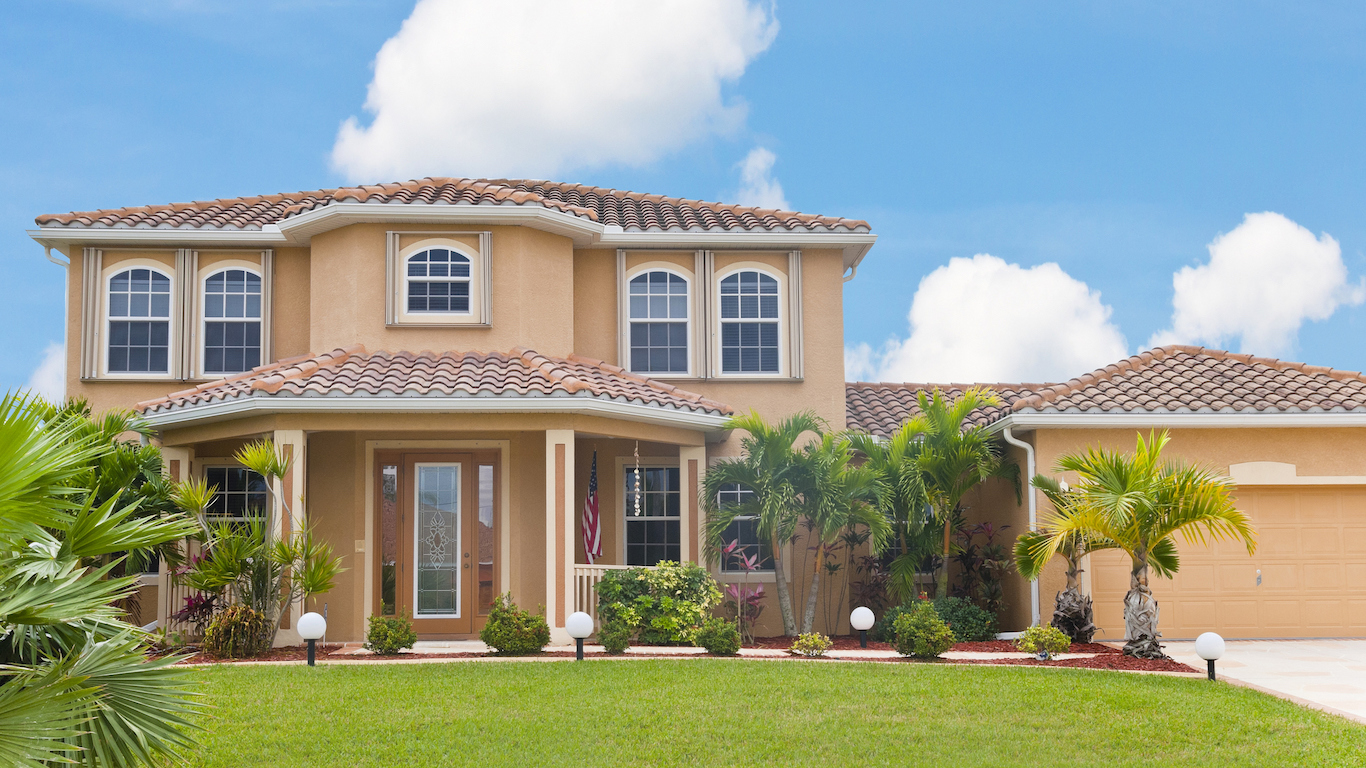
[cnxvideo id=”839968″ placement=”ros”]Many potential American homeowners dream about buying an older house, steeped in history and rustic charm. Others would much prefer a brand new home, with modern design elements and no need for major renovations.
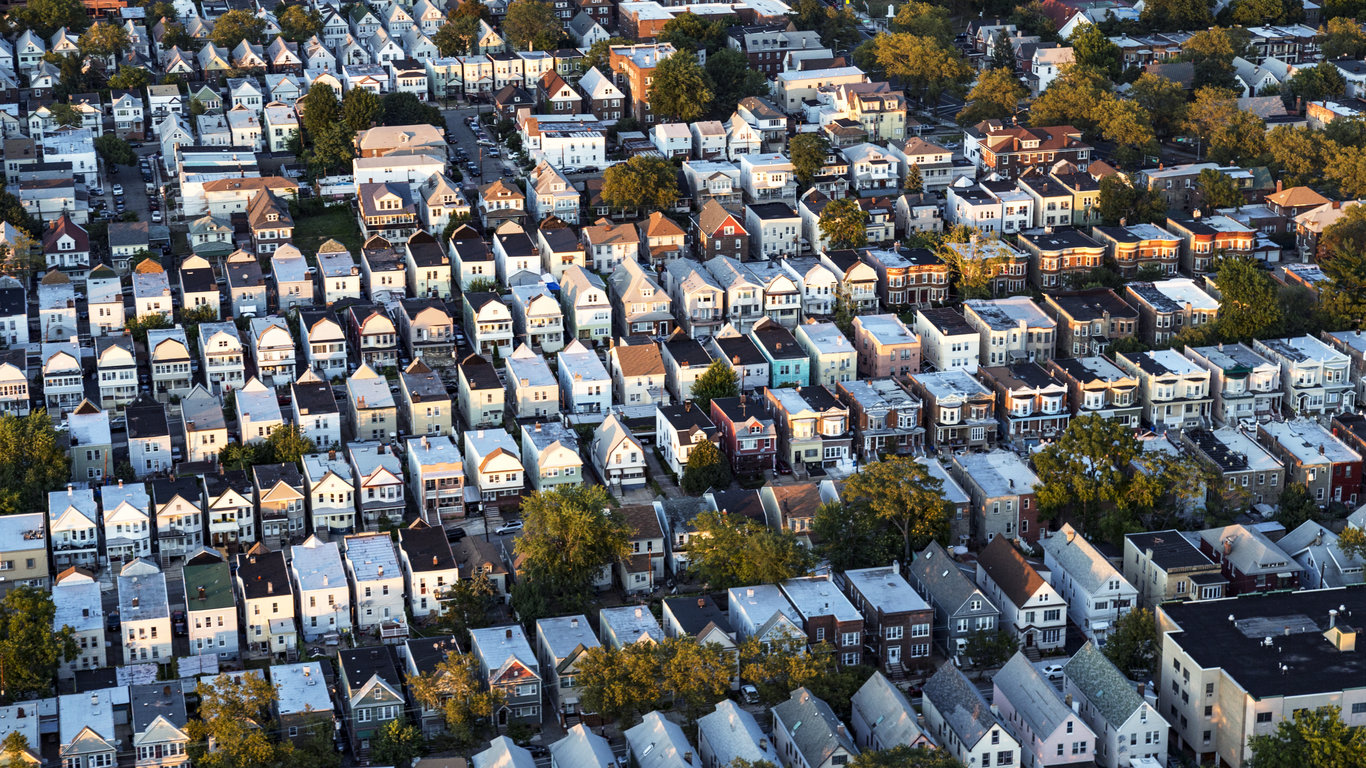
Depending on where you live, newer homes are far more common, and in some large U.S. cities, the majority of homes have been built in the last two decades.
According to data collected from the U.S. Census Bureau, there are 26 U.S. cities with a population of at least 65,000 where more than half of housing units were built since the year 2000, compared to about 19% of homes nationwide.
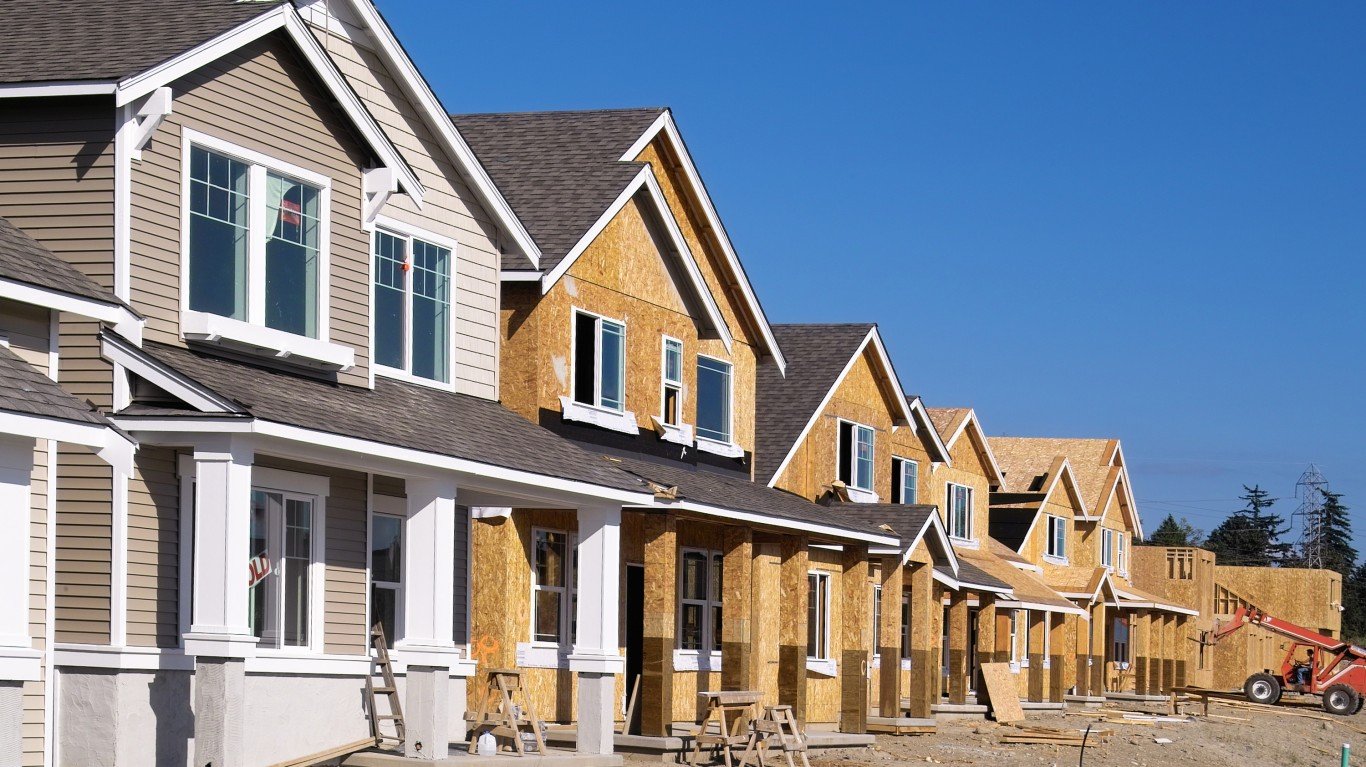
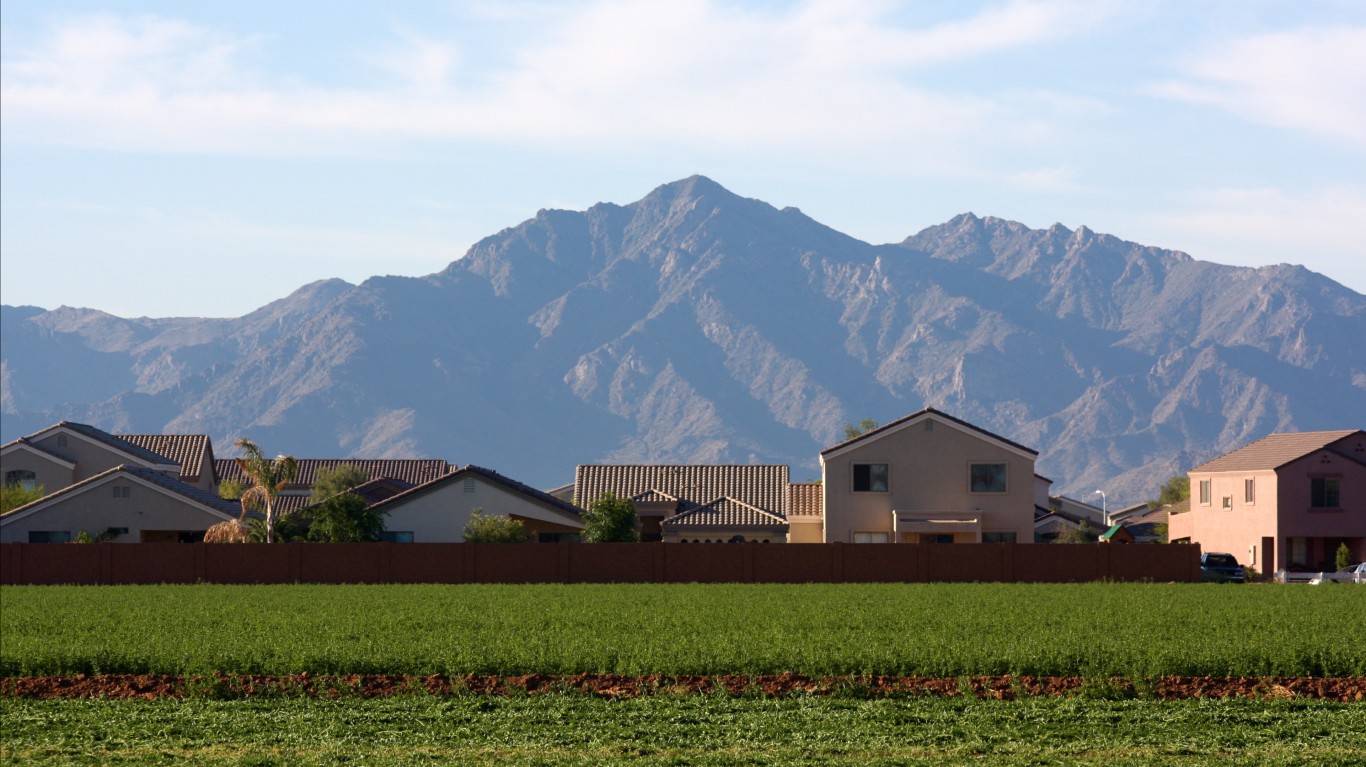
The cities with the largest shares of newer homes tend to be in Western states that have been developed more recently, relative to much of the East Coast. Such states include Arizona, Nevada, and Texas, which alone account for 15 of the 26 cities on this list.
Growing populations result in a growing demand for new homes, and some of the cities on this list, unsurprisingly, are among the fastest growing cities in the United States.
Because these housing markets tend to have rapidly growing populations, the cities on this list are in-demand places to live, and homes there generally cost more. The U.S. median home value is $217,600. In all but five of the 26 cities on this list, the median home value is greater than the national median. However, despite higher than typical home values, many of these cities are far from being among the most expensive housing markets in the state.
Click here to see cities with the newest homes
Click here to read our methodology
26. Murrieta, CA
> Share of housing units built since 2000: 50.1% (17,328)
> Share of housing units built before 1960: 0.7% (253)
> Population change since 2010: +11.1% (103,466 to 114,985)
> Median home value: $417,000
[in-text-ad]

25. Perris, CA
> Share of housing units built since 2000: 50.3% (8,388)
> Share of housing units built before 1960: 1.3% (221)
> Population change since 2010: +15.7% (68,386 to 79,133)
> Median home value: $283,300
[recirclink id=551802]
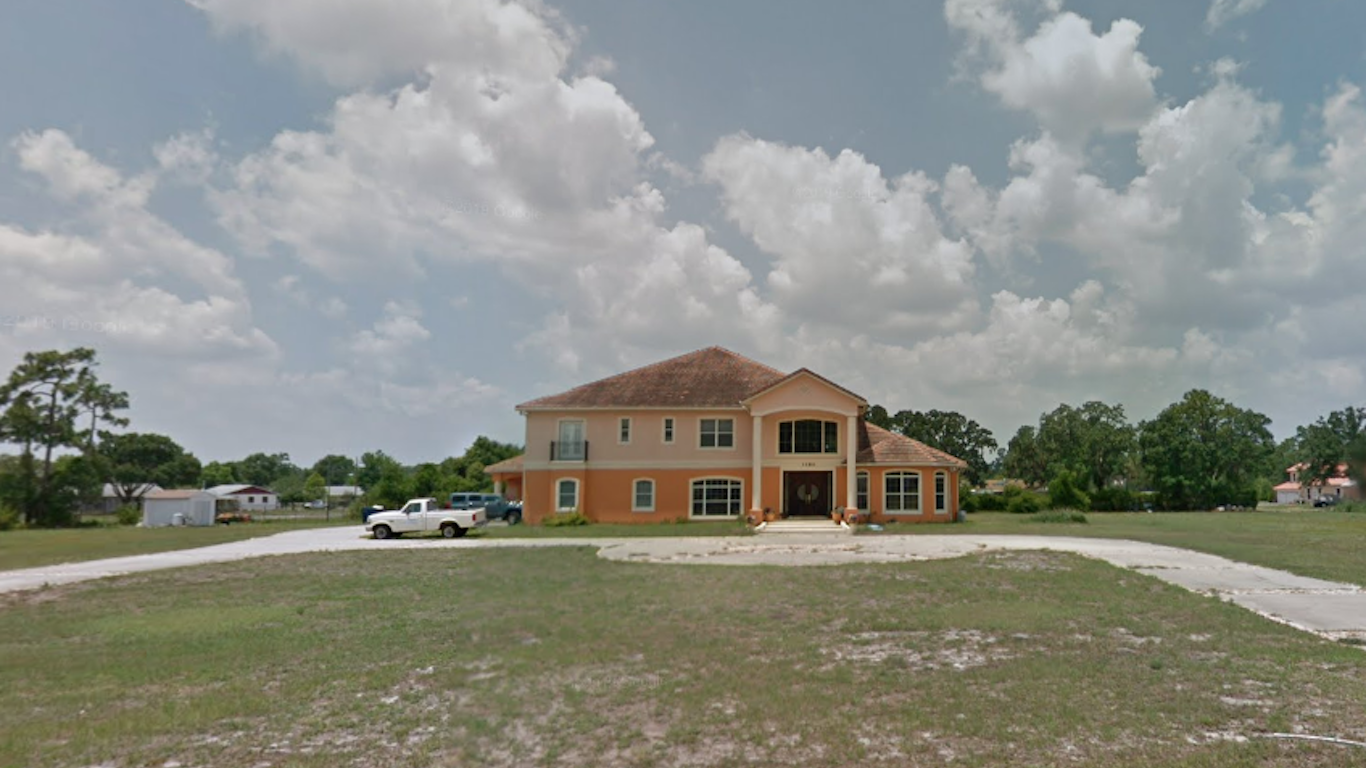
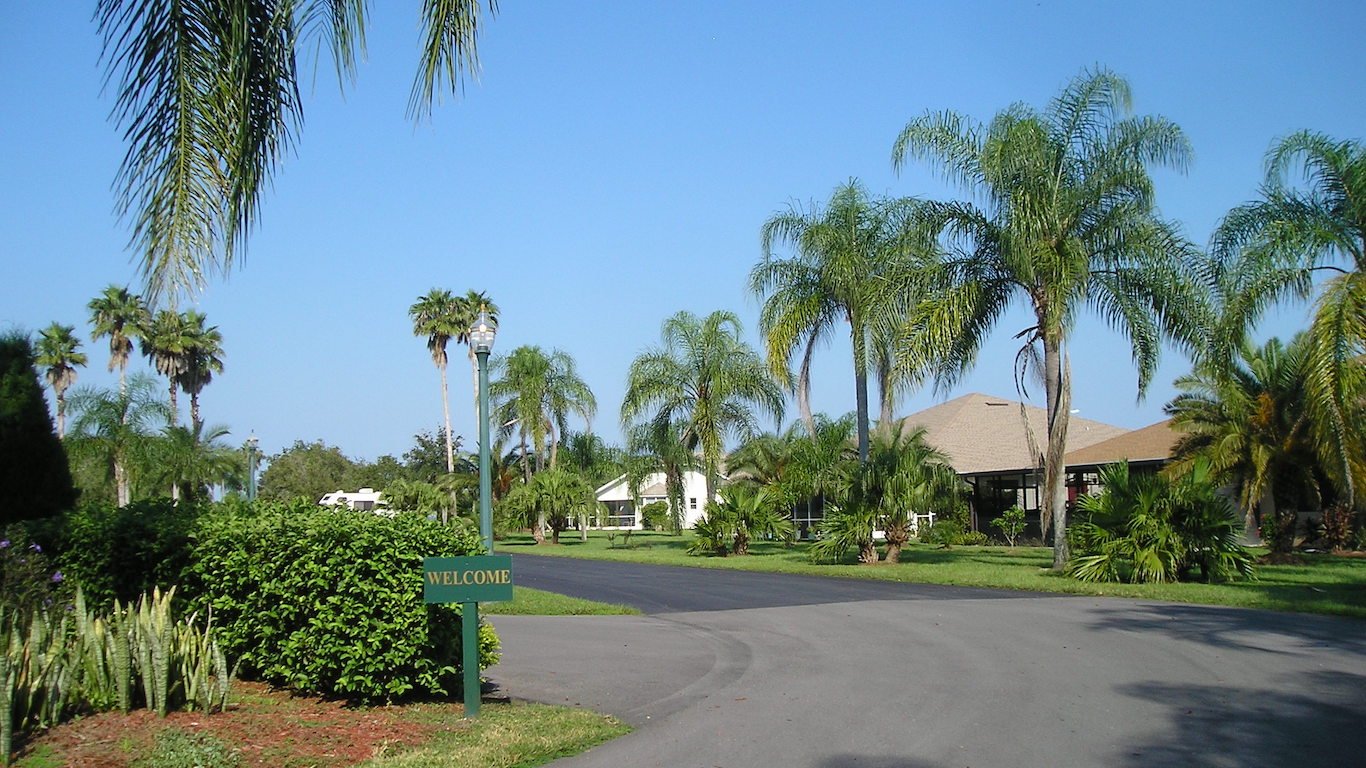
24. Alafaya, FL
> Share of housing units built since 2000: 50.6% (15,795)
> Share of housing units built before 1960: 1.0% (321)
> Population change since 2010: N/A
> Median home value: $255,600
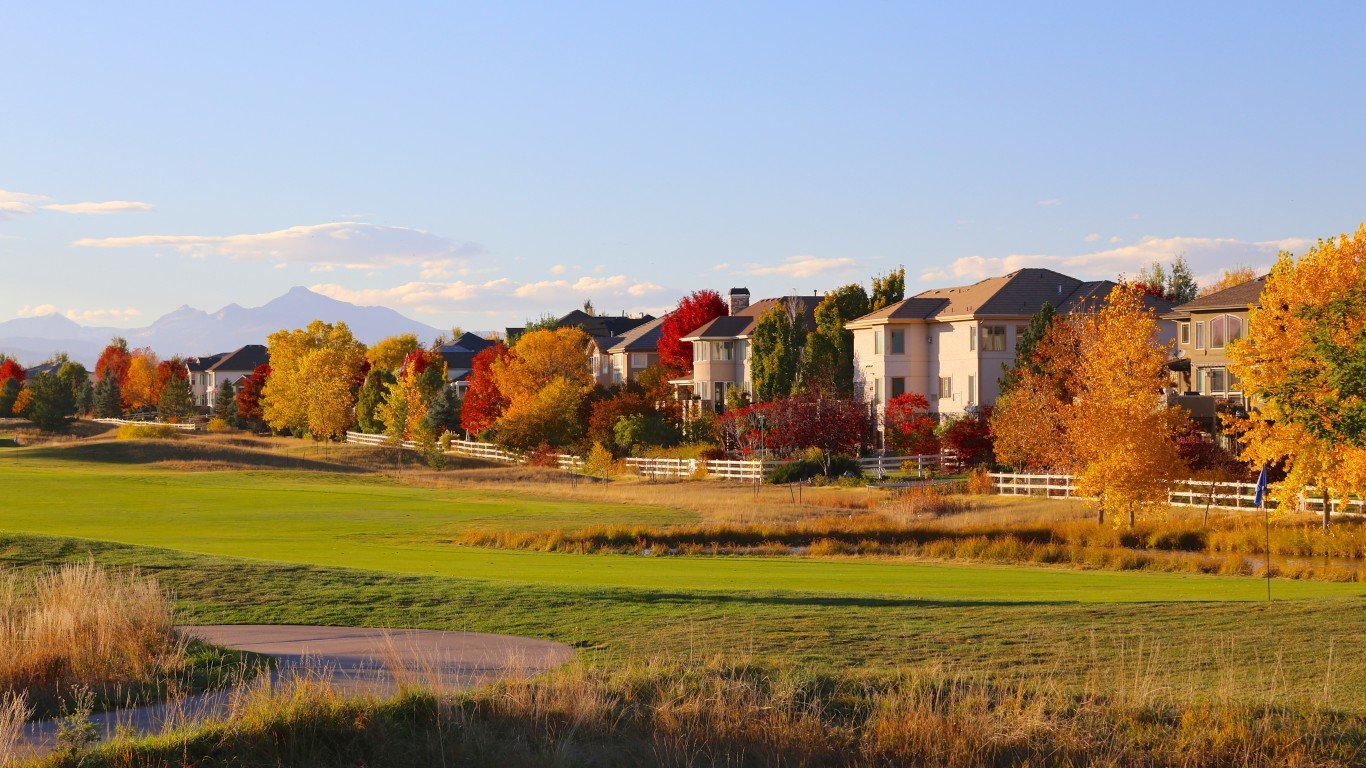
23. Broomfield, CO
> Share of housing units built since 2000: 50.6% (14,438)
> Share of housing units built before 1960: 5.4% (1,547)
> Population change since 2010: +23.9% (55,889 to 69,267)
> Median home value: $416,600
[in-text-ad-2]

22. Mission, TX
> Share of housing units built since 2000: 50.7% (15,277)
> Share of housing units built before 1960: 2.8% (830)
> Population change since 2010: +10.1% (77,058 to 84,827)
> Median home value: $104,400
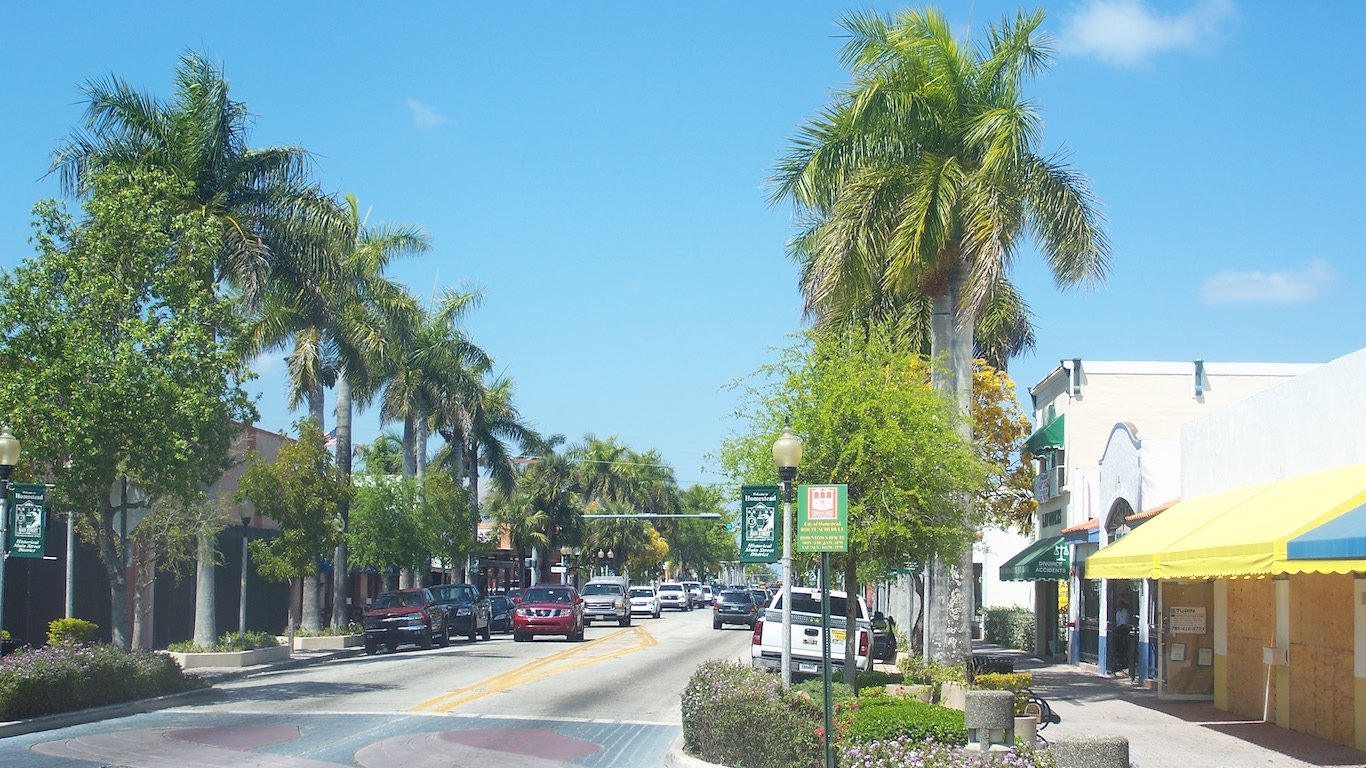
21. Homestead, FL
> Share of housing units built since 2000: 51.8% (10,075)
> Share of housing units built before 1960: 9.2% (1,799)
> Population change since 2010: +16.5% (60,512 to 70,477)
> Median home value: $223,200
[in-text-ad]
20. League City, TX
> Share of housing units built since 2000: 52.6% (19,816)
> Share of housing units built before 1960: 1.8% (684)
> Population change since 2010: +27.1% (83,560 to 106,244)
> Median home value: $253,400
[recirclink id=536210]
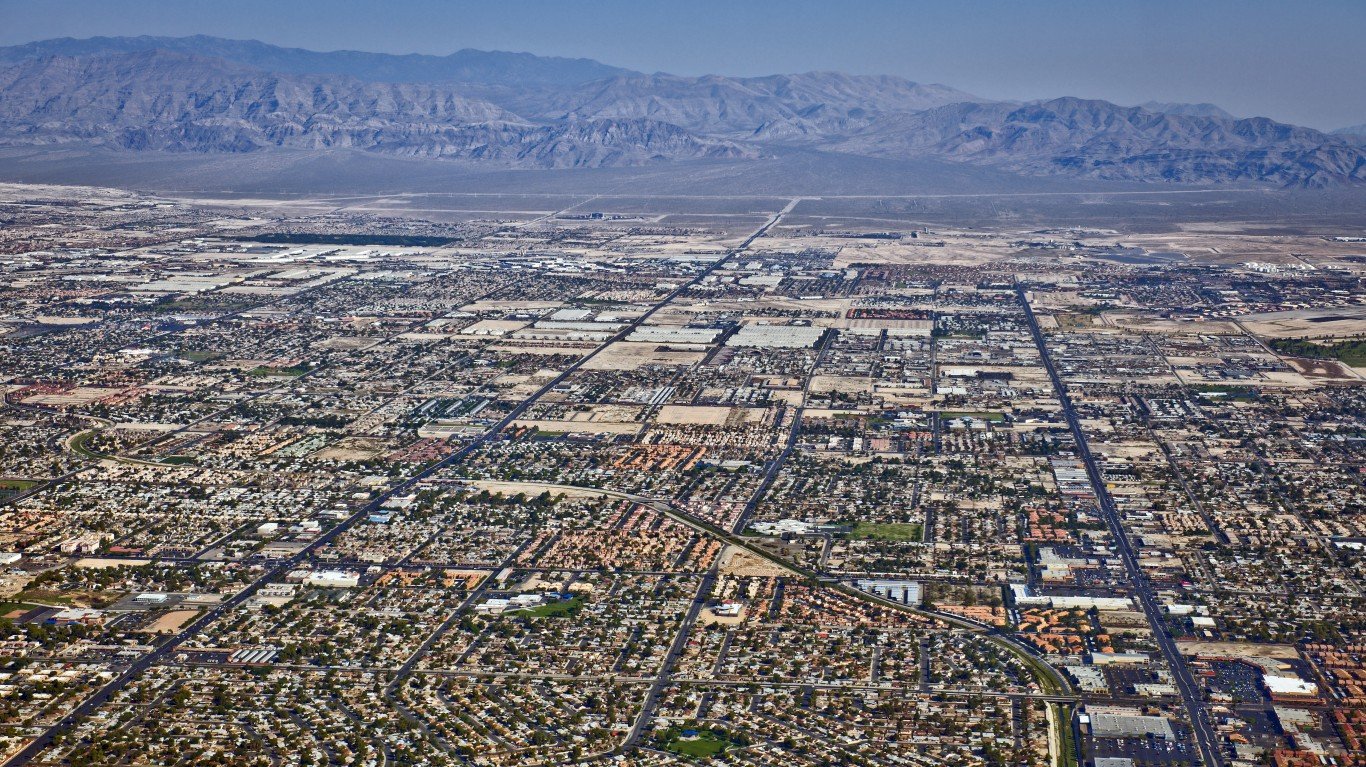
19. North Las Vegas, NV
> Share of housing units built since 2000: 53.0% (40,995)
> Share of housing units built before 1960: 4.3% (3,363)
> Population change since 2010: +13.4% (216,961 to 245,949)
> Median home value: $226,600
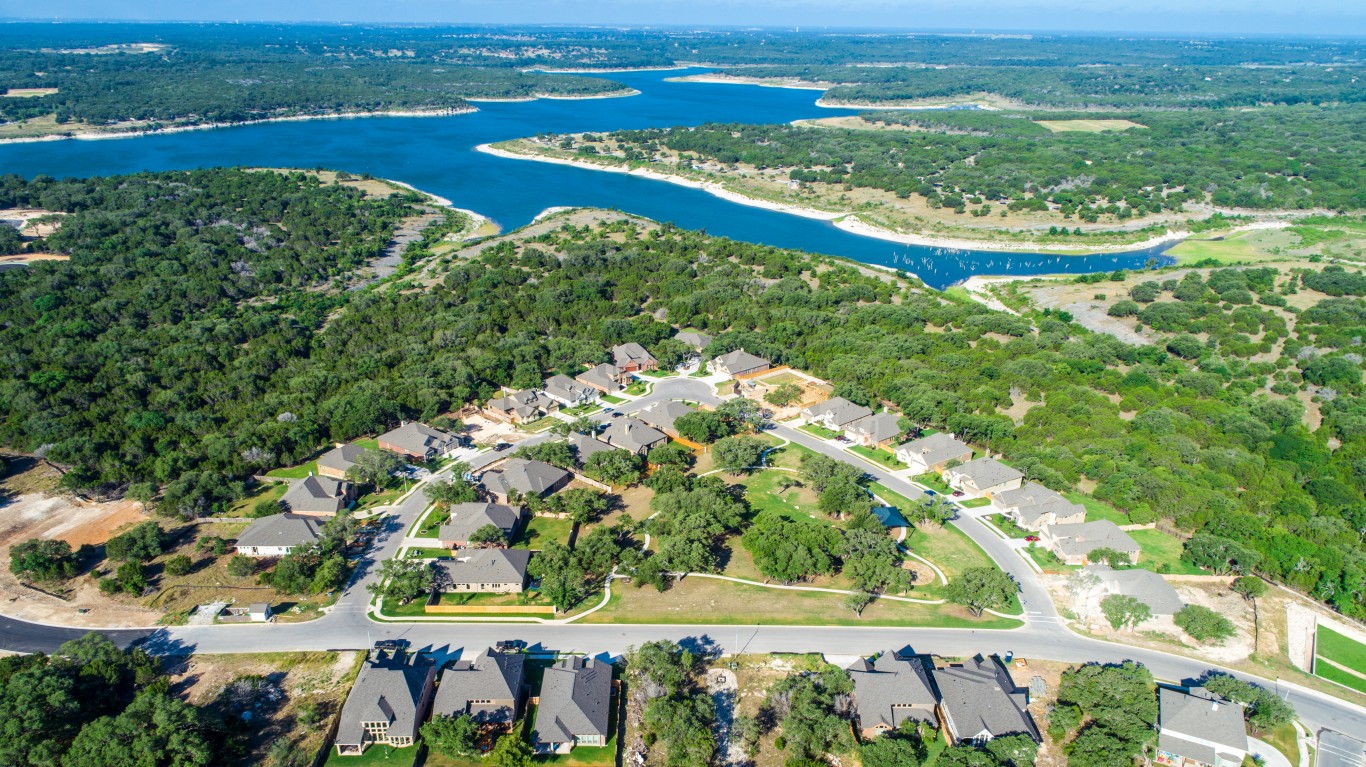
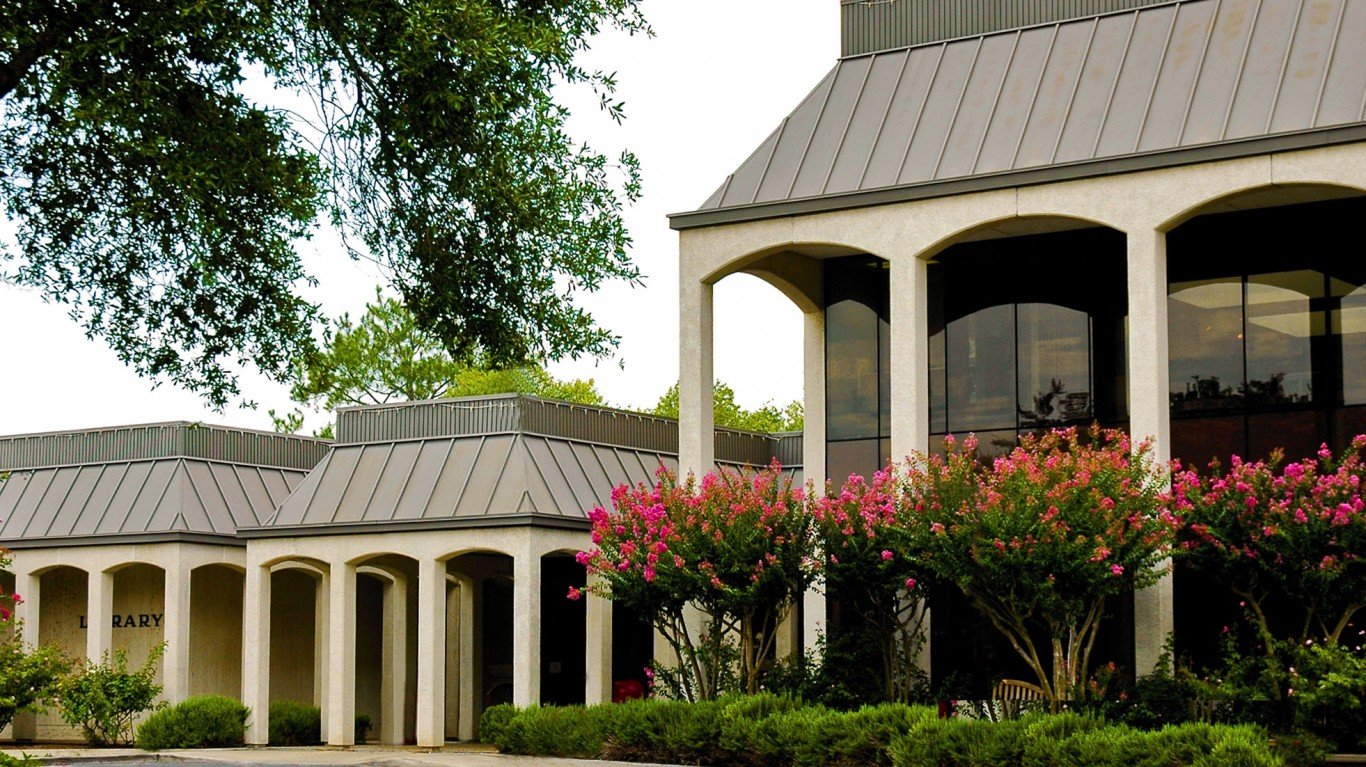
18. Georgetown, TX
> Share of housing units built since 2000: 54.8% (15,076)
> Share of housing units built before 1960: 5.2% (1,440)
> Population change since 2010: +56.5% (47,400 to 74,180)
> Median home value: $280,300
[in-text-ad-2]

17. Fishers, IN
> Share of housing units built since 2000: 55.3% (18,513)
> Share of housing units built before 1960: 0.9% (314)
> Population change since 2010: +21.6% (76,794 to 93,362)
> Median home value: $274,000
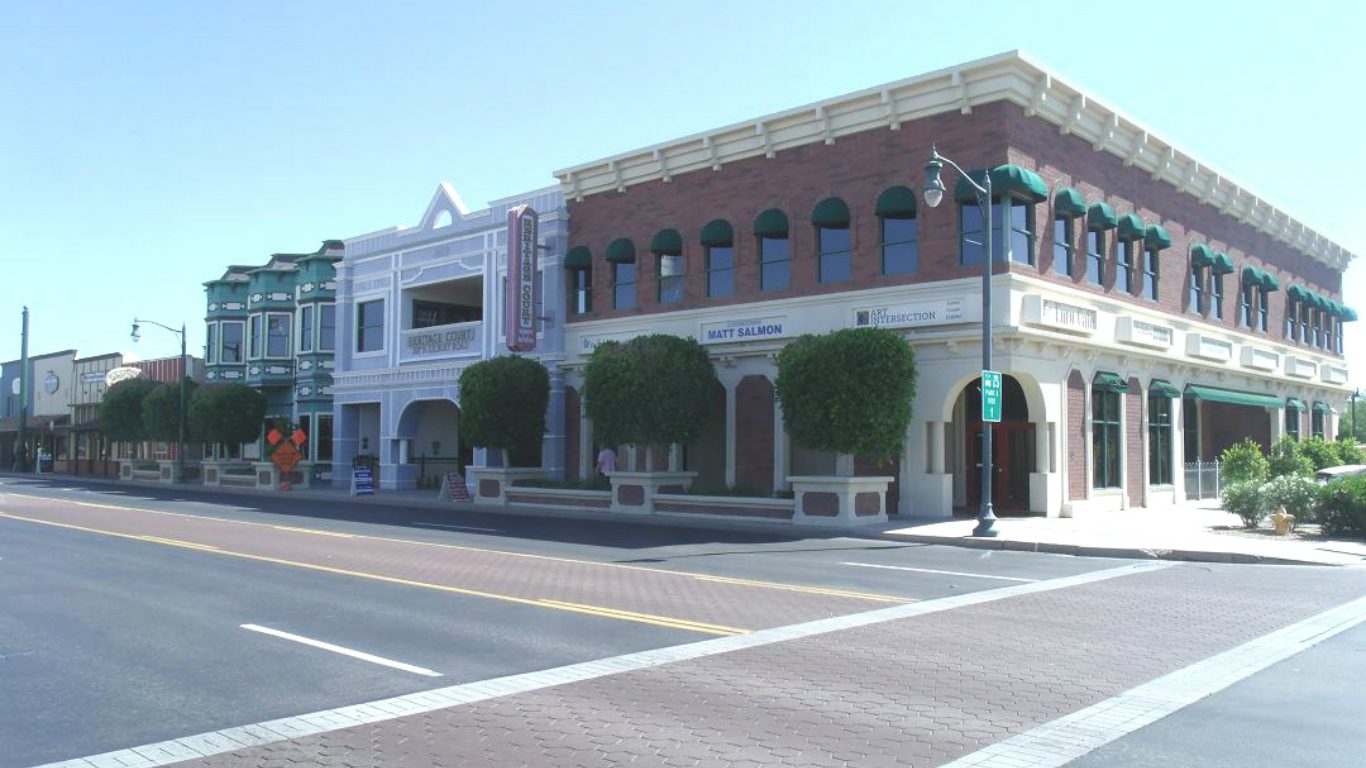
16. Gilbert, AZ
> Share of housing units built since 2000: 57.1% (49,736)
> Share of housing units built before 1960: 0.7% (578)
> Population change since 2010: +19.1% (208,453 to 248,279)
> Median home value: $320,000
[in-text-ad]
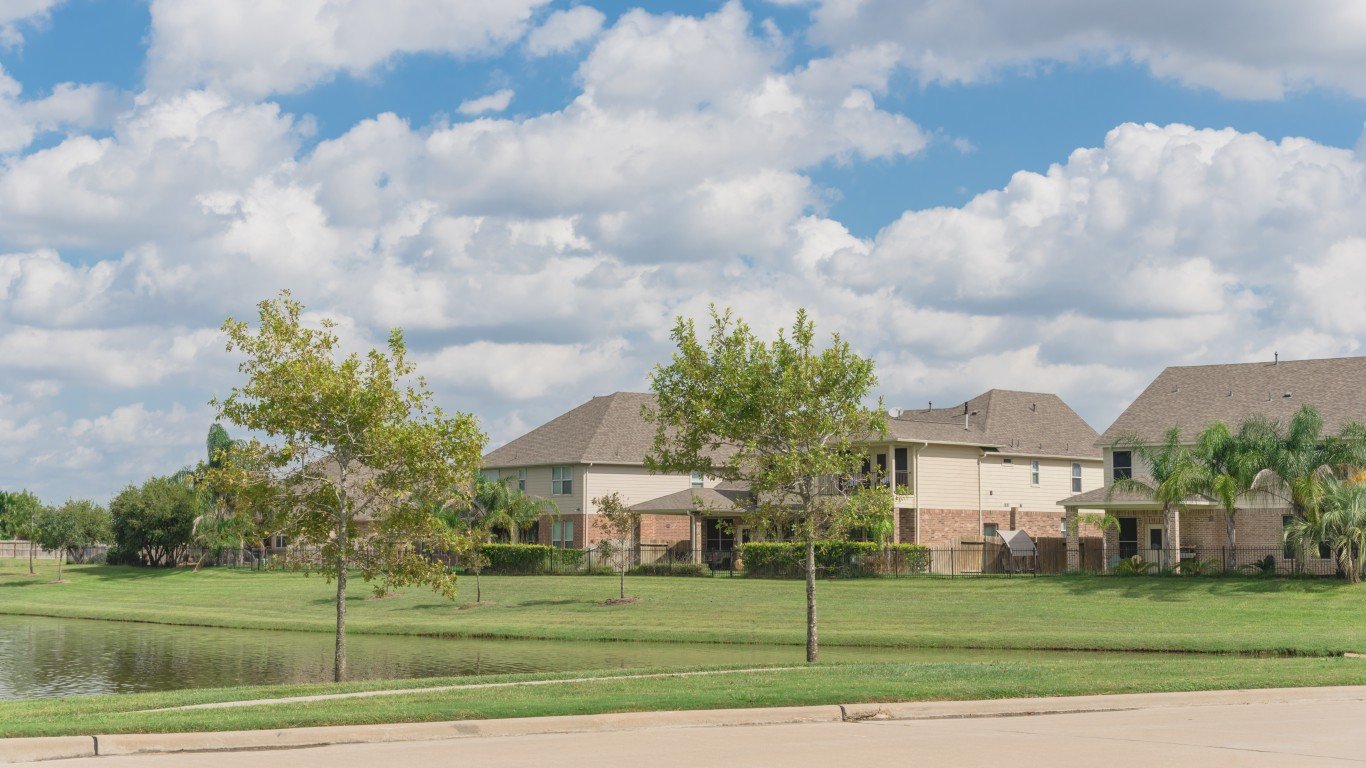
15. Pearland, TX
> Share of housing units built since 2000: 57.5% (26,090)
> Share of housing units built before 1960: 1.8% (802)
> Population change since 2010: +33.9% (91,252 to 122,149)
> Median home value: $251,400
[recirclink id=545465]

14. Mansfield, TX
> Share of housing units built since 2000: 58.5% (14,200)
> Share of housing units built before 1960: 6.2% (1,502)
> Population change since 2010: +25.9% (56,368 to 70,981)
> Median home value: $247,600

13. Meridian, ID
> Share of housing units built since 2000: 59.6% (22,552)
> Share of housing units built before 1960: 1.9% (707)
> Population change since 2010: +42.2% (75,092 to 106,804)
> Median home value: $271,800
[in-text-ad-2]
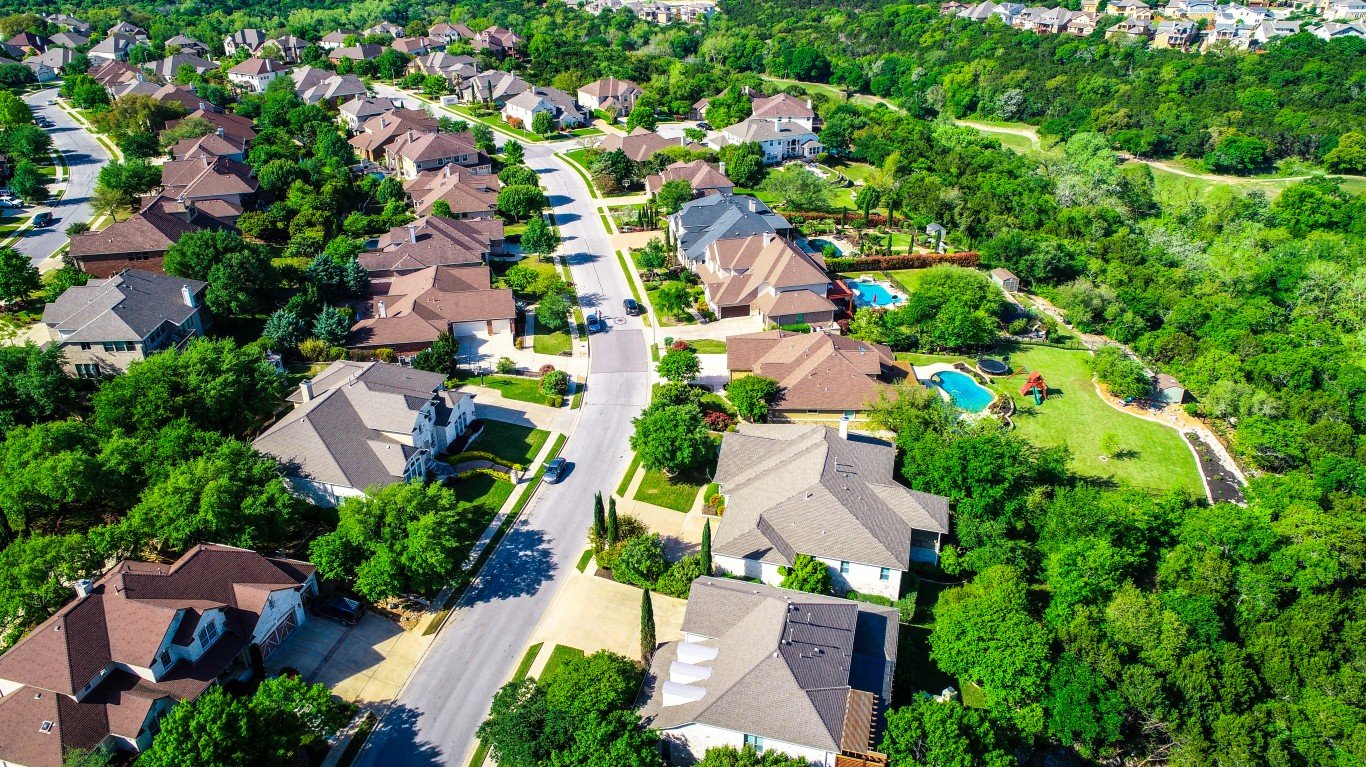
12. Cedar Park, TX
> Share of housing units built since 2000: 61.9% (14,868)
> Share of housing units built before 1960: 2.1% (508)
> Population change since 2010: +57.3% (48,937 to 76,999)
> Median home value: $307,200
11. Lehigh Acres, FL
> Share of housing units built since 2000: 63.3% (23,958)
> Share of housing units built before 1960: 2.9% (1,085)
> Population change since 2010: N/A
> Median home value: $157,600
[in-text-ad]
10. Avondale, AZ
> Share of housing units built since 2000: 64.2% (18,009)
> Share of housing units built before 1960: 3.2% (889)
> Population change since 2010: +12.6% (76,238 to 85,835)
> Median home value: $207,300
[recirclink id=542036]
9. North Port, FL
> Share of housing units built since 2000: 64.7% (17,773)
> Share of housing units built before 1960: 0.7% (192)
> Population change since 2010: +19.7% (57,357 to 68,628)
> Median home value: $175,300

8. McKinney, TX
> Share of housing units built since 2000: 66.6% (42,875)
> Share of housing units built before 1960: 5.4% (3,457)
> Population change since 2010: +46.2% (131,117 to 191,645)
> Median home value: $317,200
[in-text-ad-2]

7. South Jordan, UT
> Share of housing units built since 2000: 67.1% (14,931)
> Share of housing units built before 1960: 1.1% (235)
> Population change since 2010: +47.1% (50,418 to 74,149)
> Median home value: $385,600
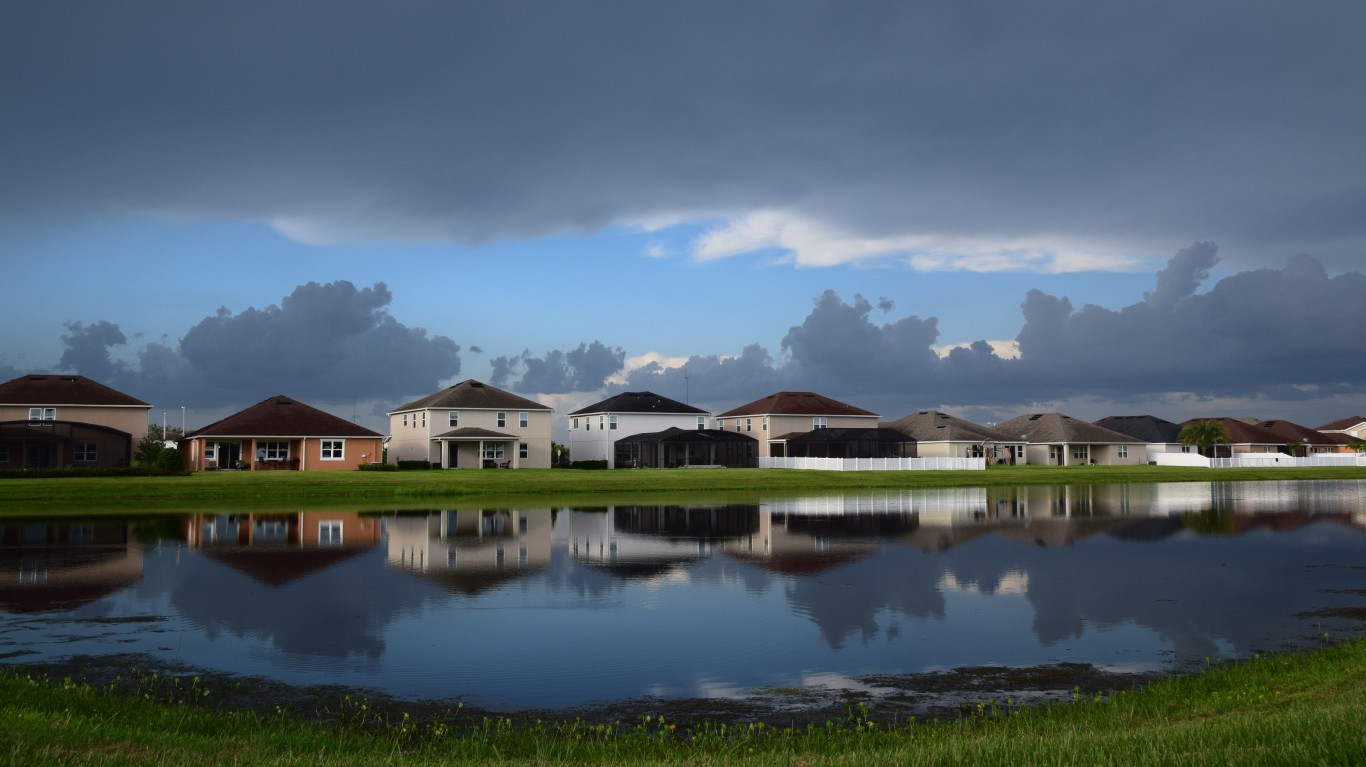
6. Riverview, FL
> Share of housing units built since 2000: 68.0% (22,830)
> Share of housing units built before 1960: 1.2% (408)
> Population change since 2010: N/A
> Median home value: $222,400
[in-text-ad]

5. Surprise, AZ
> Share of housing units built since 2000: 69.4% (40,514)
> Share of housing units built before 1960: 0.8% (496)
> Population change since 2010: +17.6% (117,517 to 138,161)
> Median home value: $231,900
[recirclink id=553985]

4. Frisco, TX
> Share of housing units built since 2000: 72.7% (45,743)
> Share of housing units built before 1960: 2.4% (1,488)
> Population change since 2010: +60.8% (116,989 to 188,170)
> Median home value: $404,100
3. Enterprise, NV
> Share of housing units built since 2000: 79.5% (50,908)
> Share of housing units built before 1960: 0.4% (247)
> Population change since 2010: N/A
> Median home value: $300,800
[in-text-ad-2]

2. Goodyear, AZ
> Share of housing units built since 2000: 83.3% (24,245)
> Share of housing units built before 1960: 1.1% (323)
> Population change since 2010: +26.9% (65,275 to 82,835)
> Median home value: $298,900

1. Buckeye, AZ
> Share of housing units built since 2000: 87.7% (18,251)
> Share of housing units built before 1960: 1.6% (342)
> Population change since 2010: +46.2% (50,876 to 74,370)
> Median home value: $216,400
Methodology
To determine the cities with the newest homes in the United States, 24/7 Wall St. reviewed the Census Bureau’s 2017 American Community Survey one-year estimates to find the percentage of housing structures built in 2000 or sooner. Only cities with a population of 65,000 or more as measured by the U.S. Census Bureau were included in the ranking. Median home values also came from the 2017 ACS. Population change figures came from the U.S. Census Bureau’s Annual Estimates of the Resident Population dataset, and are from April 1, 2010 through July 1, 2018.
Contact [email protected] for any questions or corrections.