[cnxvideo id=”882568″ placement=”ros”]
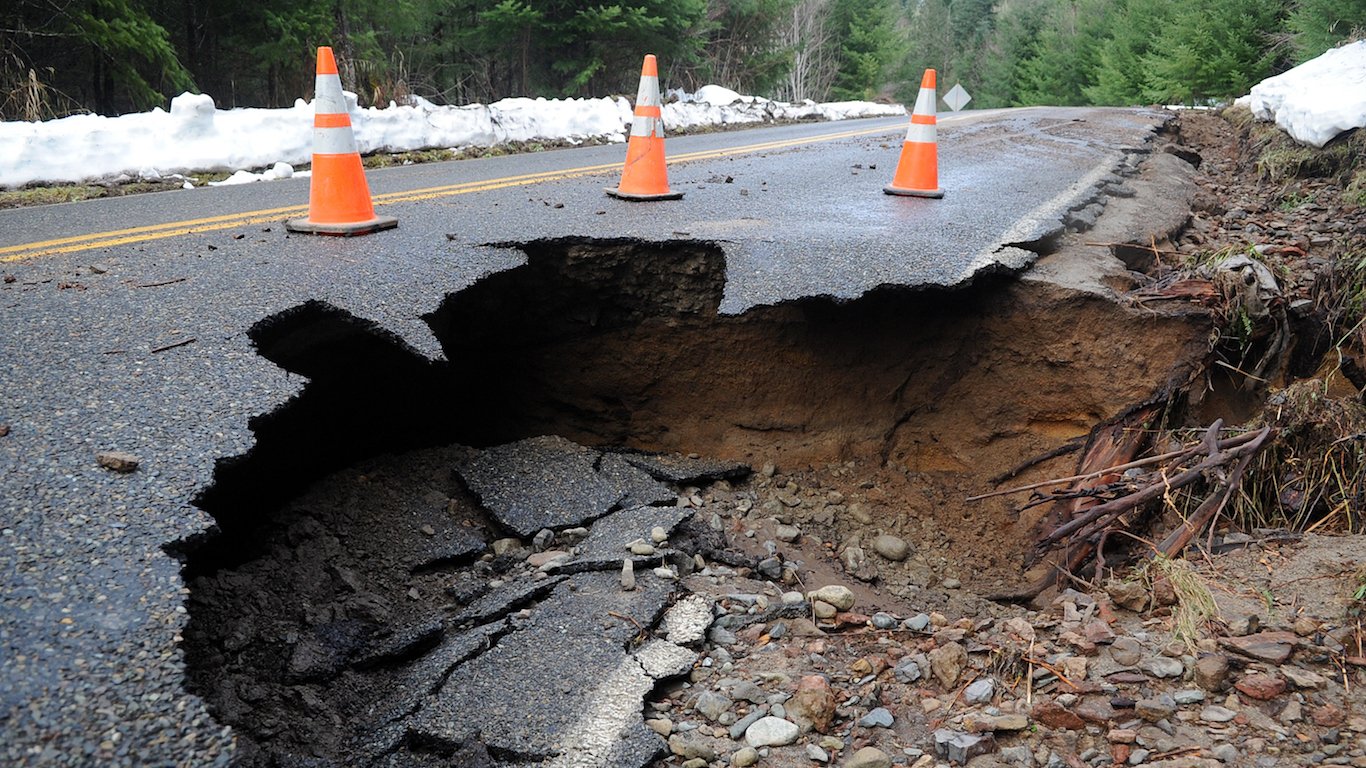
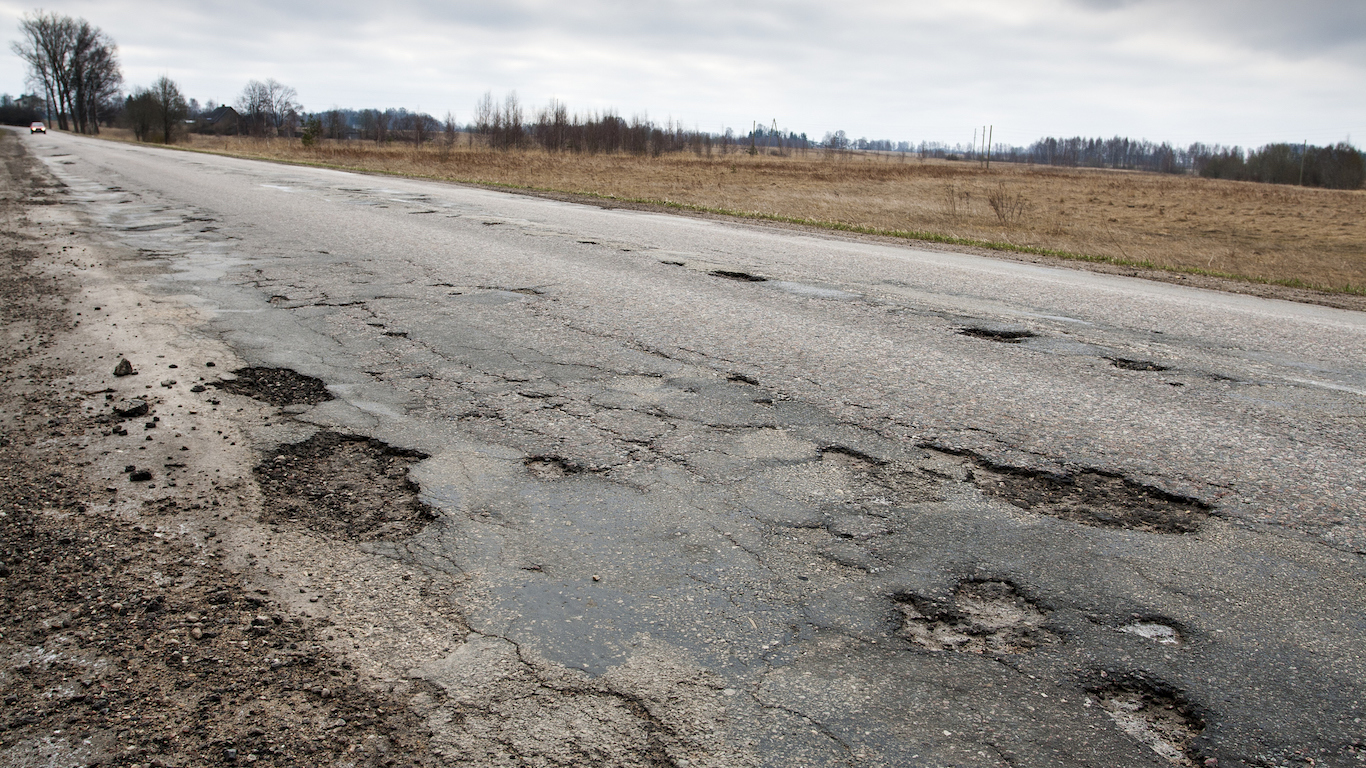
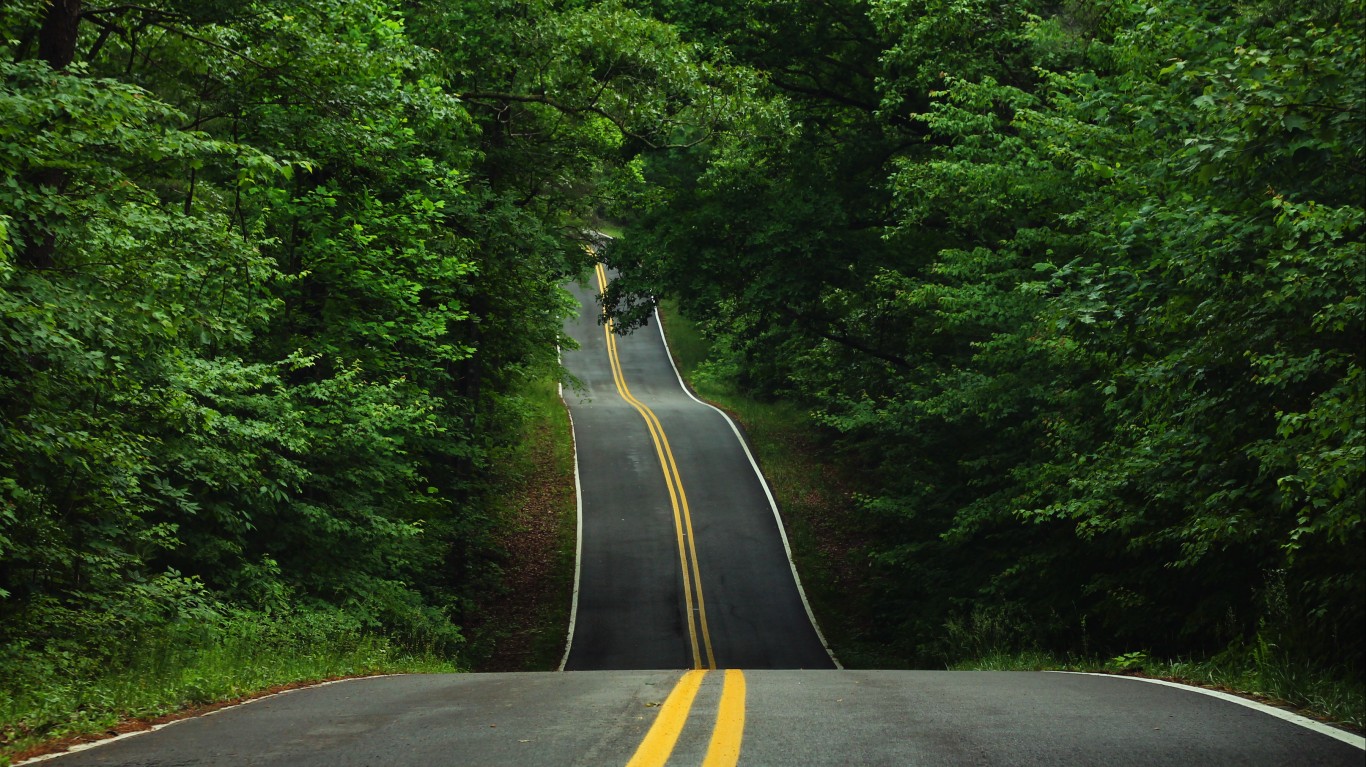
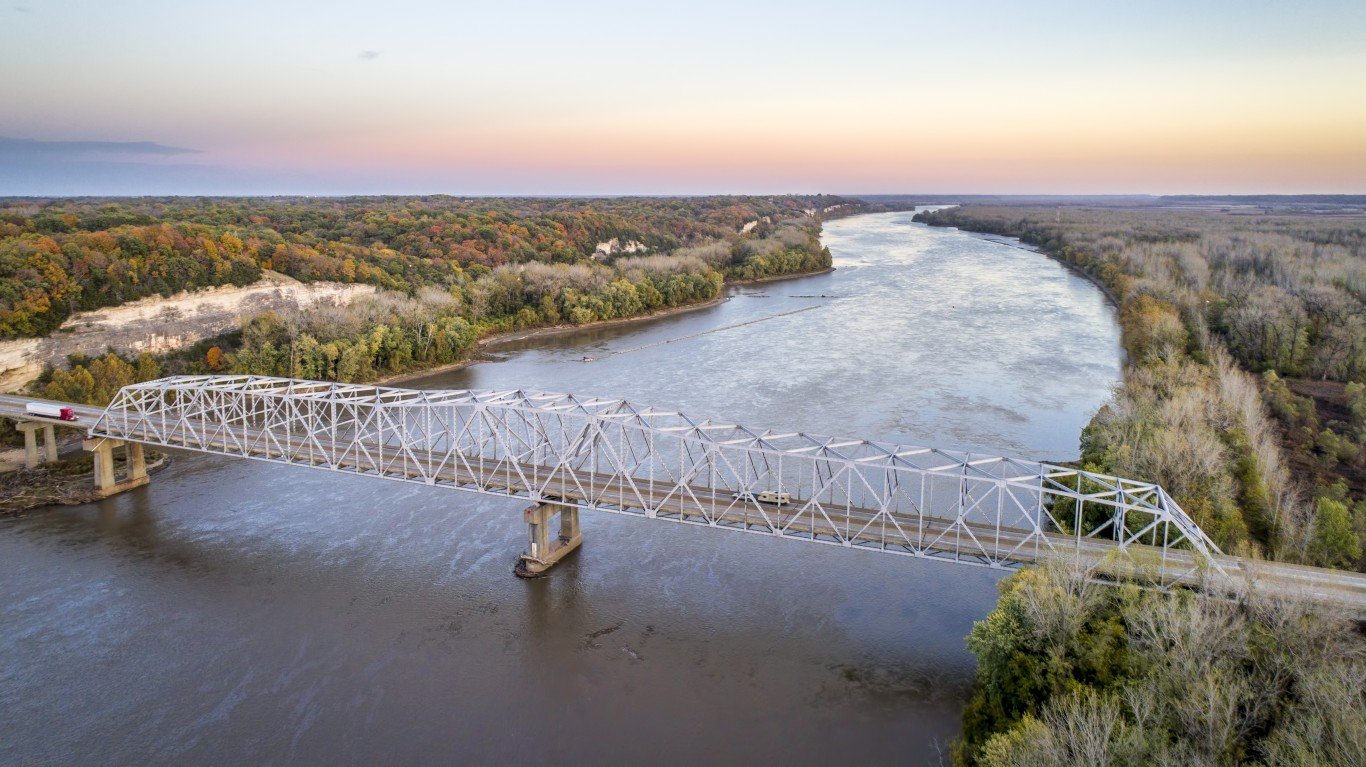
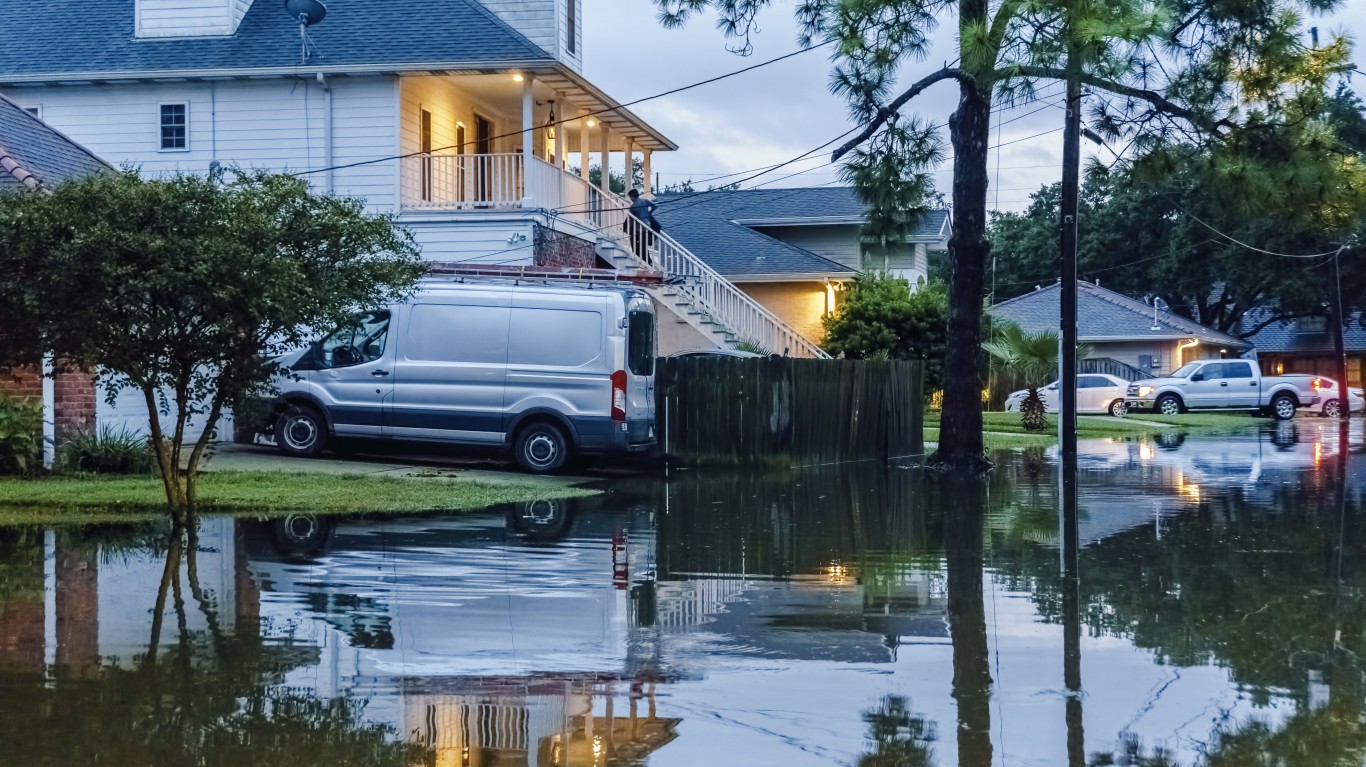
The U.S. economy is a $20.5 trillion behemoth — and the nation’s infrastructure is the scaffolding upon which it depends. In many parts of the country, however, years of neglect have left critical transportation infrastructure in a state of serious, often dangerous, disrepair.
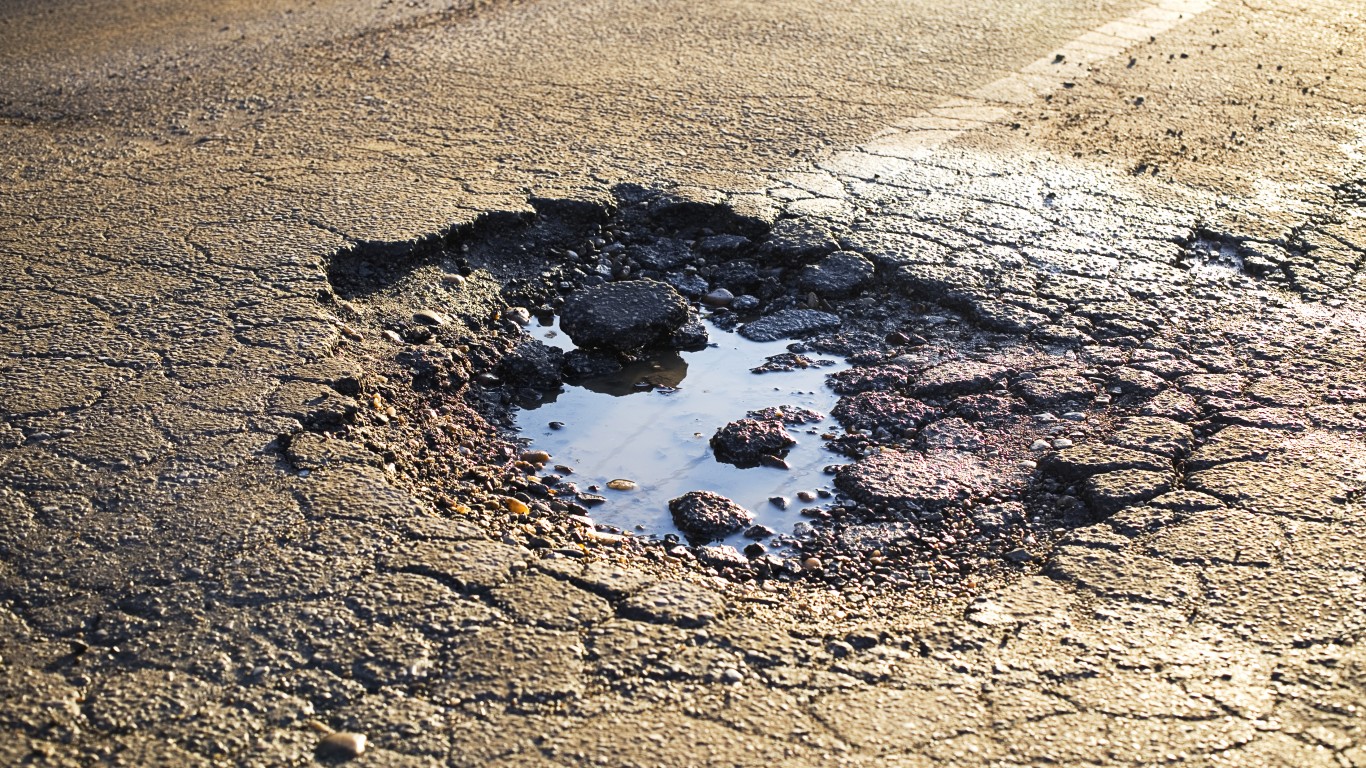
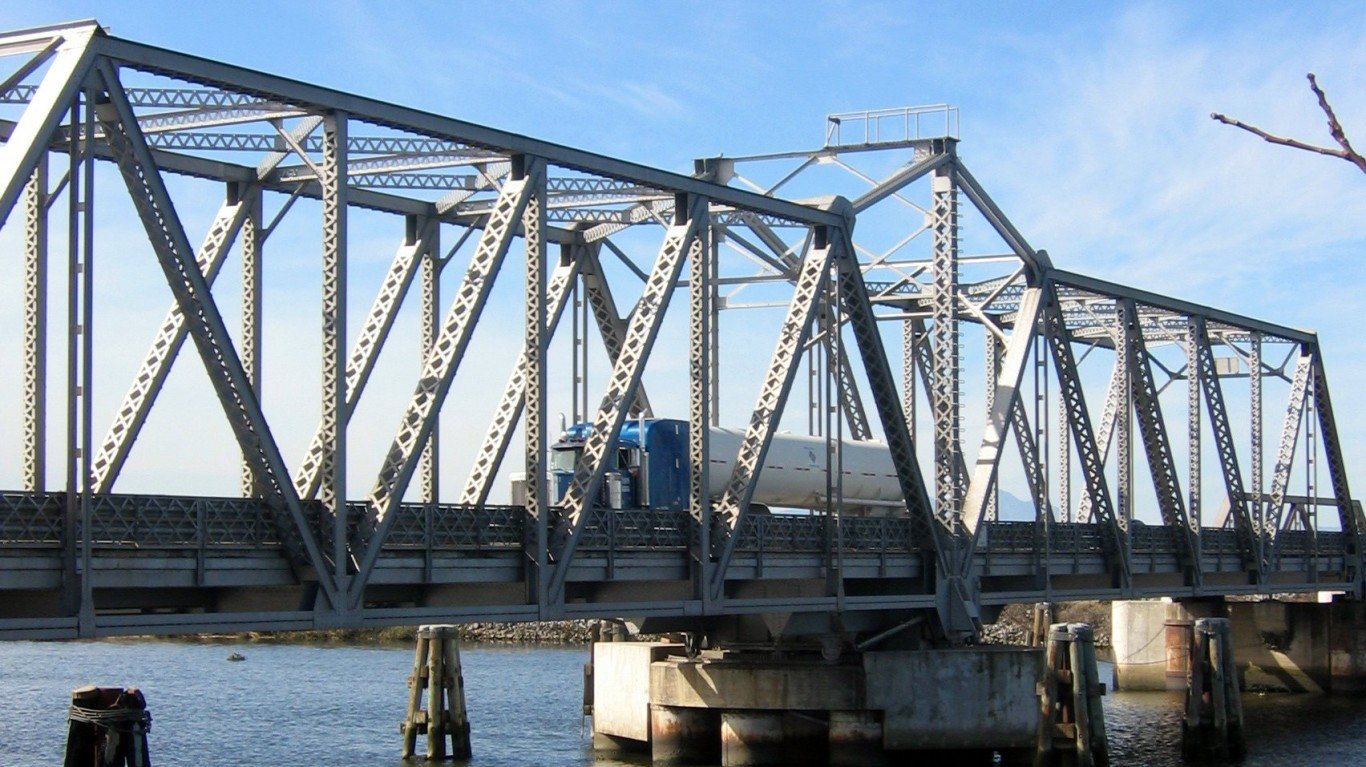
The effects of deteriorating infrastructure range in severity, from potholes adding unnecessary wear-and-tear to personal vehicles to catastrophic failures, like the I-35 bridge collapse that killed 13 people in Minneapolis in 2007. According to some estimates, delays due to roadway congestion — which are often caused by inadequate infrastructure — take a more than $120 billion toll on the economy every year.
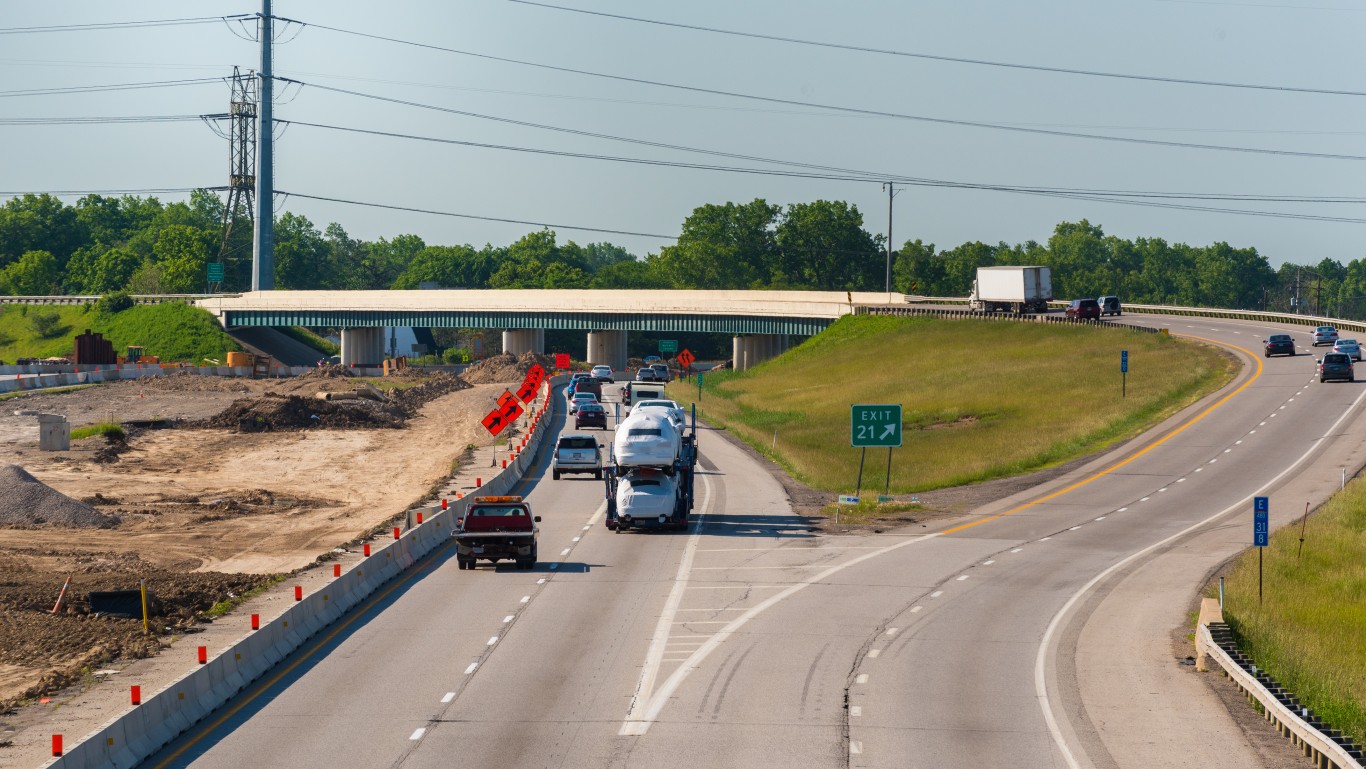
Though the U.S. economy has grown at a steady pace over the past century, infrastructure spending has not kept up. Federal, state, and local governments invested the equivalent of 4.2% of GDP in infrastructure projects in the late 1930s, according to a report published by Congressional Research Service, the policy research arm of the U.S. Congress. As of 2016, infrastructure spending totaled just 1.5% of GDP.
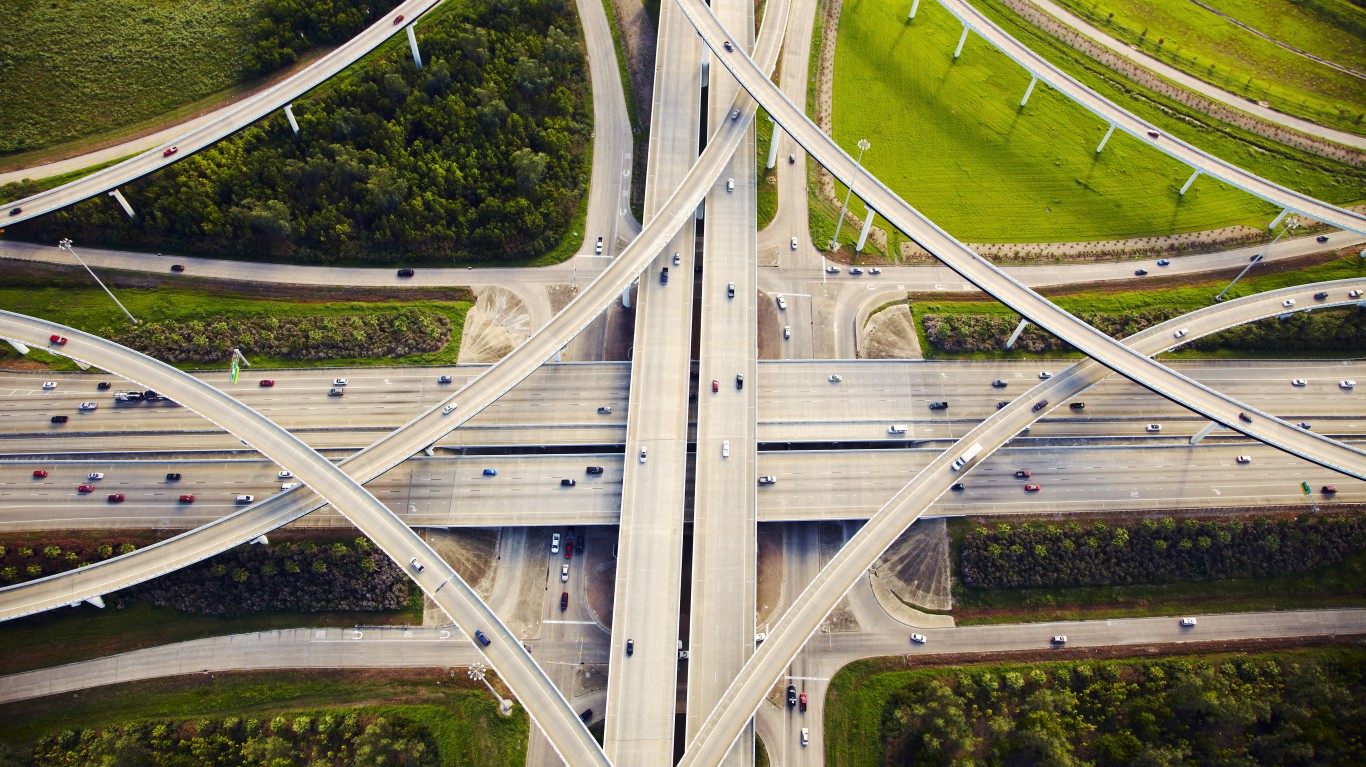
Today, state and local spending account for the vast majority of infrastructure investment, and some states are doing a better job than others at maintaining roads and bridges. Using data from the Federal Highway Administration, 24/7 Wall St. reviewed the share of bridges that are structurally deficient and the share of roadway that is unserviceable to identify the states that are falling apart.
While well-maintained roads and bridges can go a long way in improving safety conditions for motorists and passengers, they are only a small part of the equation — and the states with the worst roads are not necessarily the same as the states with the most dangerous roads.
Additionally, though road maintenance and repair is funded largely through taxes on the sale of gasoline, high gas taxes do not necessarily translate to better road conditions. Of the 10 states with the smallest share of roadway in poor condition, Florida is the only one to also rank among the states with the highest gas taxes.
Click here to see the states that are falling apart
Click here to read our methodology

50. Nevada
> Roads in poor condition: 1.3% (3rd lowest)
> Structurally deficient bridges: 1.4% (2nd lowest)
> State highway spending per driver: $281 (6th lowest)
> Avg. travel time to work: 24.2 minutes (22nd lowest)
[in-text-ad]
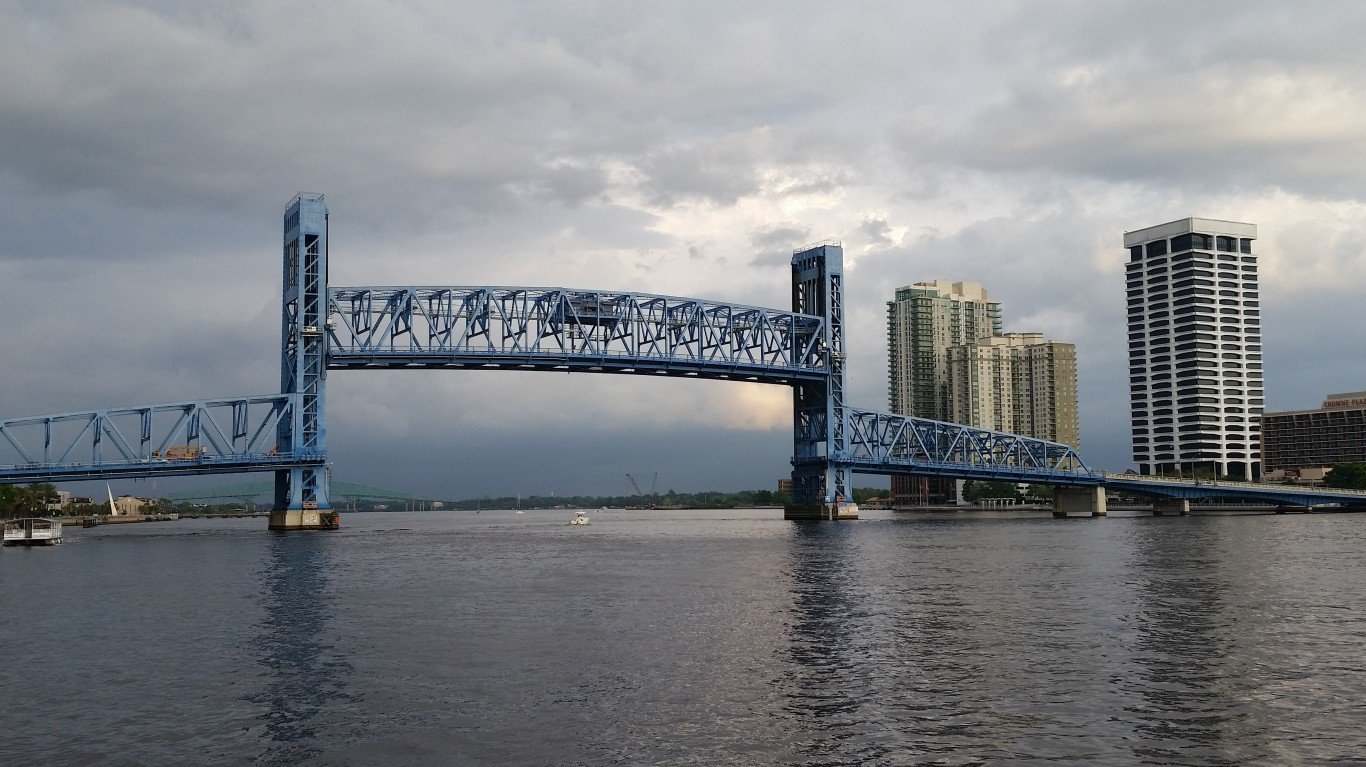
49. Florida
> Roads in poor condition: 1.3% (the lowest)
> Structurally deficient bridges: 2.6% (6th lowest)
> State highway spending per driver: $457 (22nd lowest)
> Avg. travel time to work: 27.8 minutes (10th highest)
[recirclink id=538799]
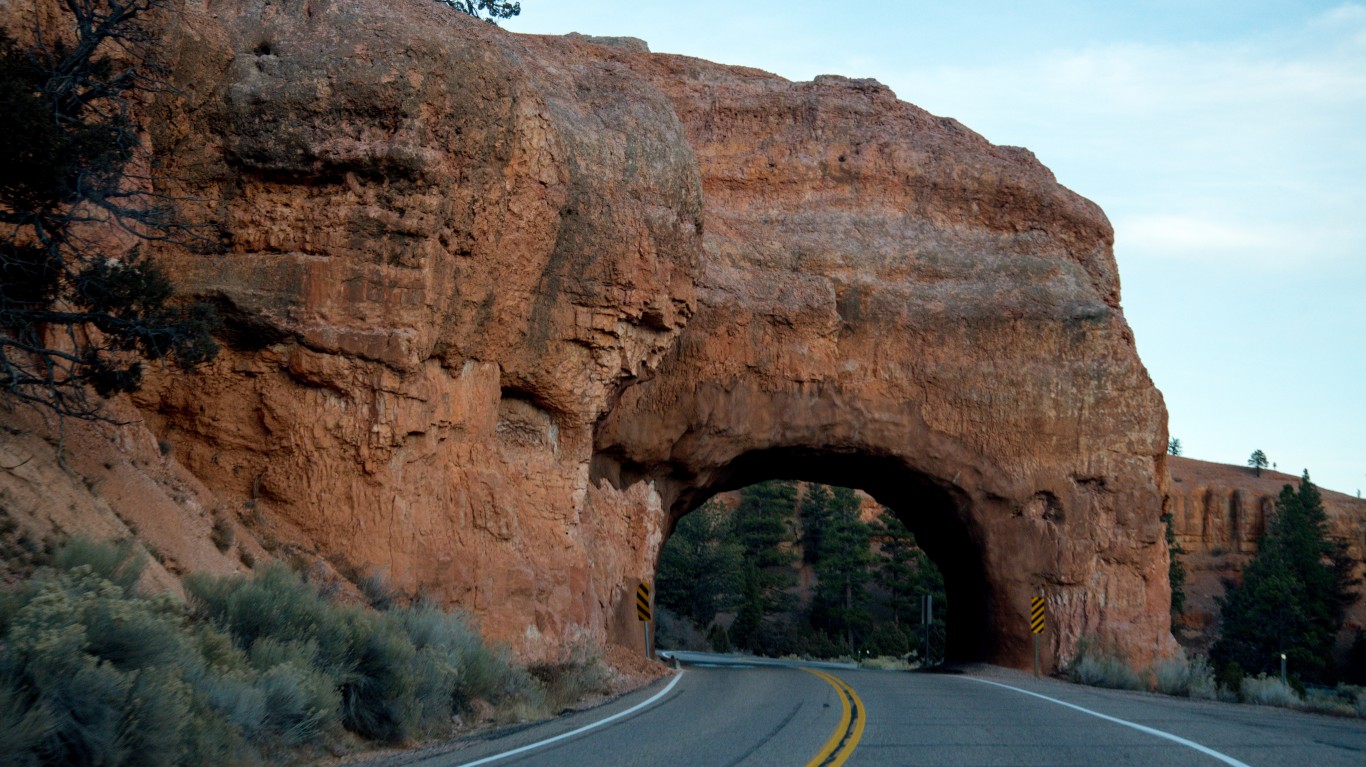
48. Utah
> Roads in poor condition: 2.4% (9th lowest)
> Structurally deficient bridges: 2.2% (4th lowest)
> State highway spending per driver: $399 (14th lowest)
> Avg. travel time to work: 22.0 minutes (12th lowest)
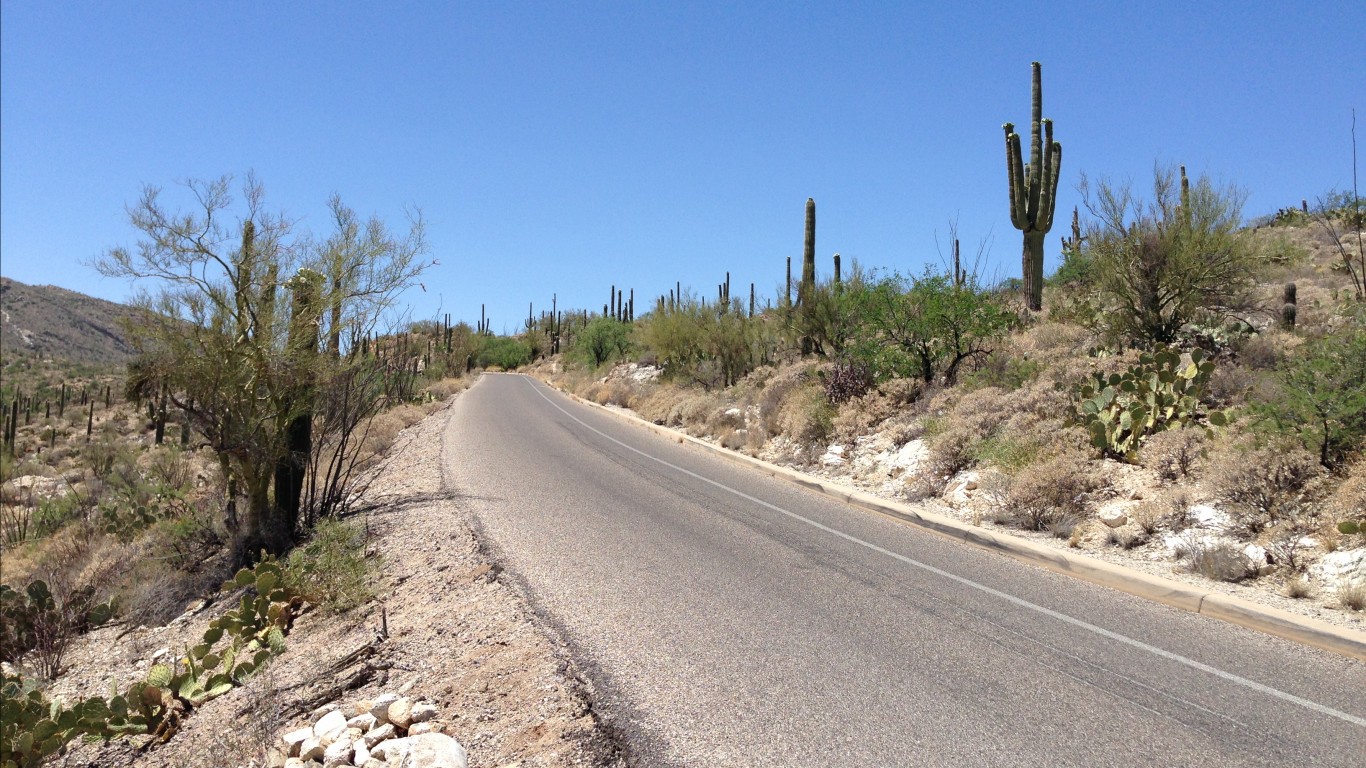
47. Arizona
> Roads in poor condition: 3.1% (16th lowest)
> Structurally deficient bridges: 1.8% (3rd lowest)
> State highway spending per driver: $239 (2nd lowest)
> Avg. travel time to work: 25.6 minutes (19th highest)
[in-text-ad-2]
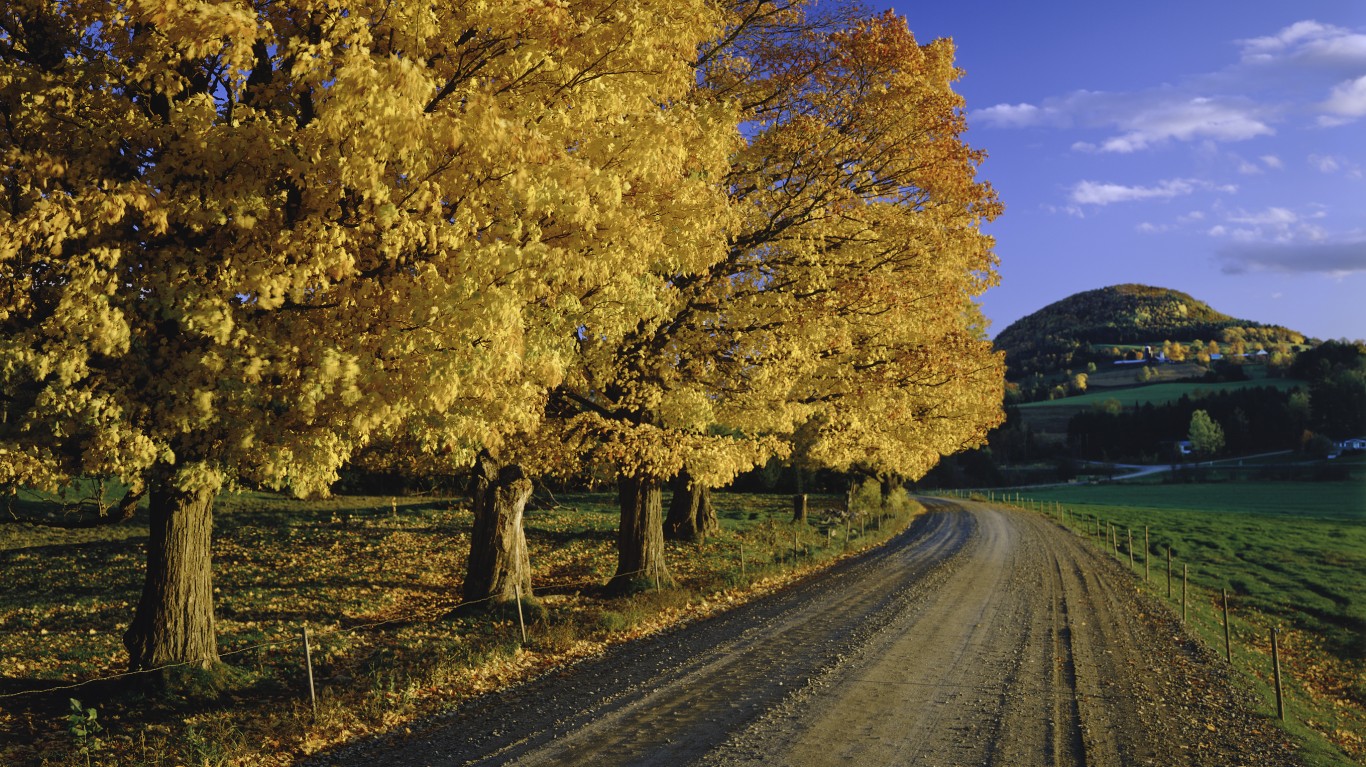
46. Vermont
> Roads in poor condition: 3.5% (19th lowest)
> Structurally deficient bridges: 2.4% (5th lowest)
> State highway spending per driver: $906 (6th highest)
> Avg. travel time to work: 23.2 minutes (15th lowest)
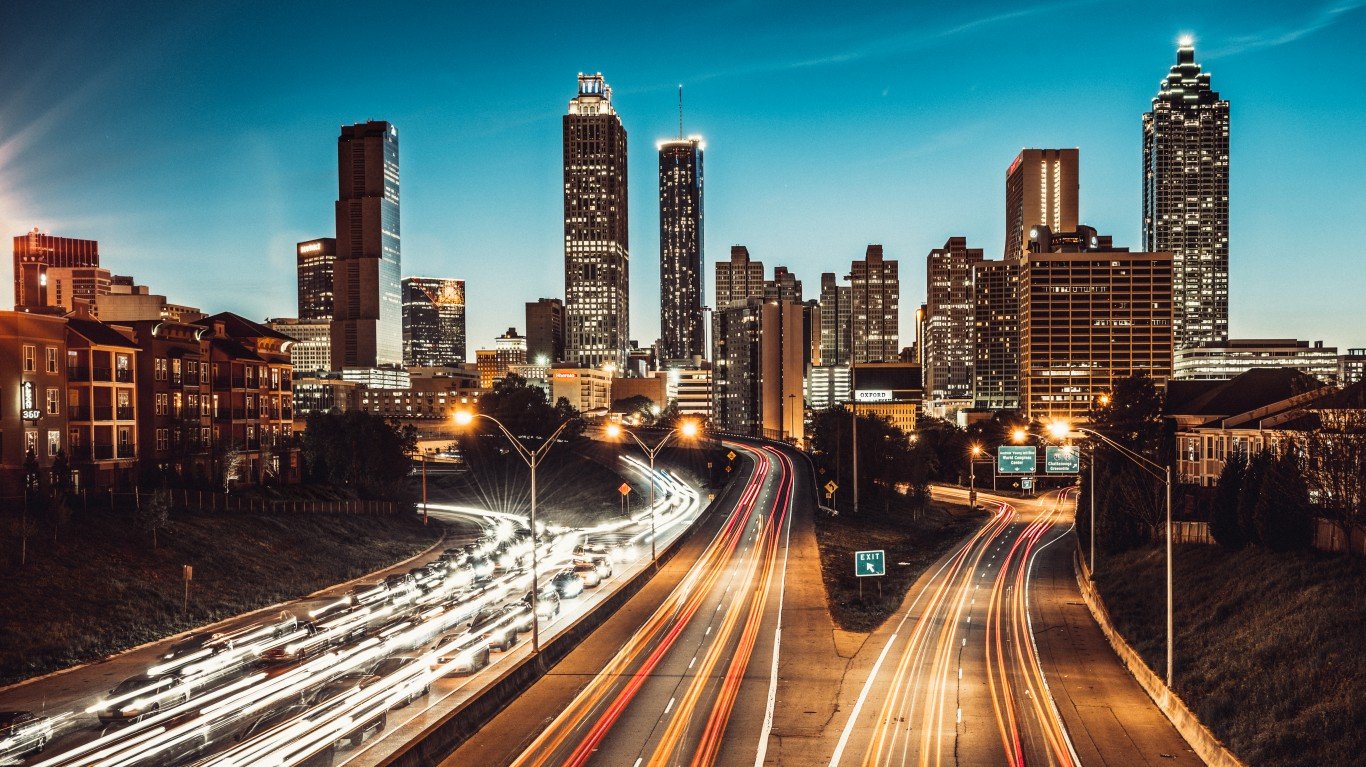
45. Georgia
> Roads in poor condition: 2.8% (12th lowest)
> Structurally deficient bridges: 3.3% (7th lowest)
> State highway spending per driver: $254 (3rd lowest)
> Avg. travel time to work: 28.8 minutes (7th highest)
[in-text-ad]
44. Alabama
> Roads in poor condition: 2.1% (5th lowest)
> Structurally deficient bridges: 4.3% (9th lowest)
> State highway spending per driver: $405 (15th lowest)
> Avg. travel time to work: 24.6 minutes (25th highest)
[recirclink id=537241]
43. Kansas
> Roads in poor condition: 1.3% (2nd lowest)
> Structurally deficient bridges: 5.2% (17th lowest)
> State highway spending per driver: $537 (21st highest)
> Avg. travel time to work: 19.1 minutes (6th lowest)

42. Texas
> Roads in poor condition: 5.5% (23rd highest)
> Structurally deficient bridges: 1.3% (the lowest)
> State highway spending per driver: $509 (23rd highest)
> Avg. travel time to work: 26.5 minutes (14th highest)
[in-text-ad-2]
41. Tennessee
> Roads in poor condition: 2.4% (10th lowest)
> Structurally deficient bridges: 4.3% (10th lowest)
> State highway spending per driver: $270 (5th lowest)
> Avg. travel time to work: 25.1 minutes (21st highest)
40. Virginia
> Roads in poor condition: 2.7% (11th lowest)
> Structurally deficient bridges: 4.6% (13th lowest)
> State highway spending per driver: $541 (20th highest)
> Avg. travel time to work: 28.6 minutes (8th highest)
[in-text-ad]
39. Delaware
> Roads in poor condition: 3.9% (21st lowest)
> Structurally deficient bridges: 3.9% (8th lowest)
> State highway spending per driver: $671 (13th highest)
> Avg. travel time to work: 26.5 minutes (14th highest)
[recirclink id=521324]
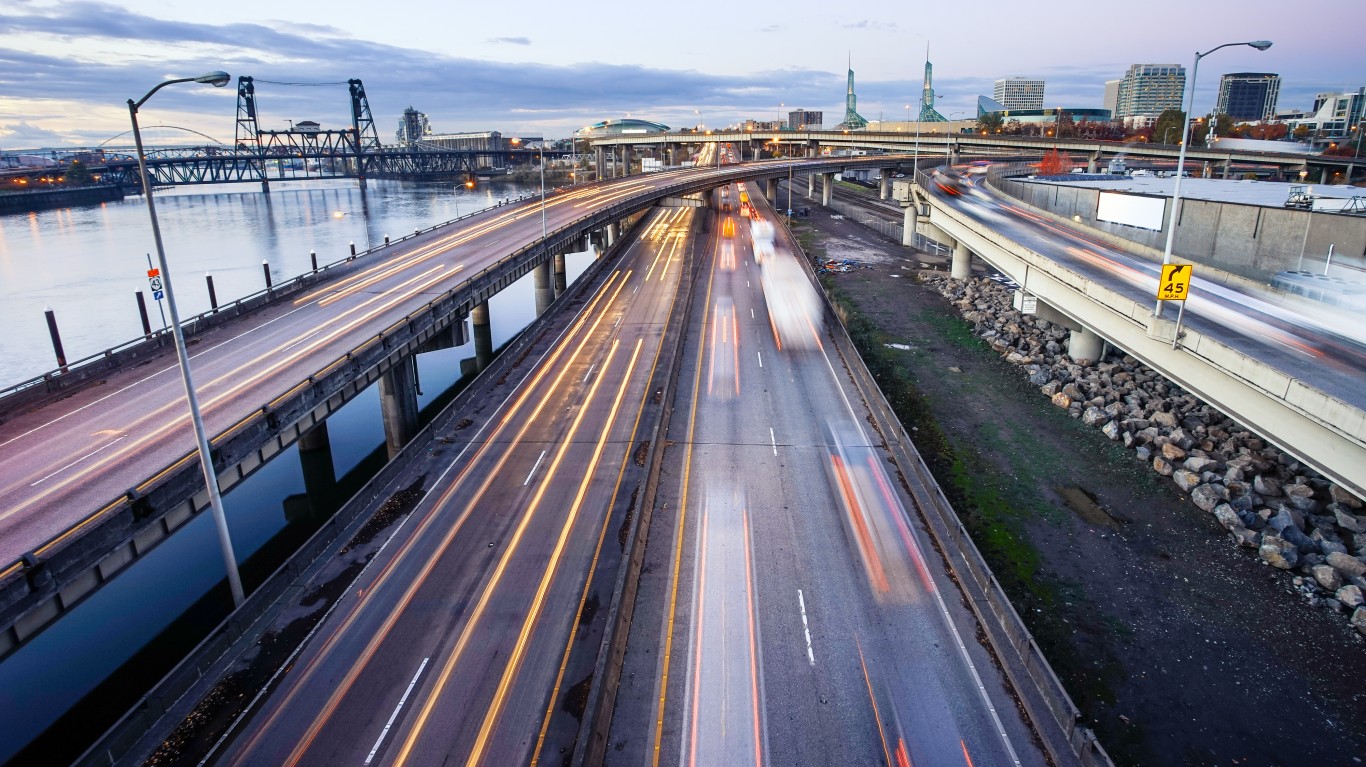
38. Oregon
> Roads in poor condition: 3.1% (15th lowest)
> Structurally deficient bridges: 5.2% (16th lowest)
> State highway spending per driver: $318 (10th lowest)
> Avg. travel time to work: 24.3 minutes (24th lowest)
37. New Mexico
> Roads in poor condition: 3.0% (14th lowest)
> Structurally deficient bridges: 5.8% (20th lowest)
> State highway spending per driver: $662 (14th highest)
> Avg. travel time to work: 22.3 minutes (14th lowest)
[in-text-ad-2]
36. Minnesota
> Roads in poor condition: 4.1% (22nd lowest)
> Structurally deficient bridges: 5.0% (14th lowest)
> State highway spending per driver: $555 (18th highest)
> Avg. travel time to work: 23.8 minutes (20th lowest)

35. Kentucky
> Roads in poor condition: 2.3% (8th lowest)
> Structurally deficient bridges: 7.1% (25th lowest)
> State highway spending per driver: $825 (8th highest)
> Avg. travel time to work: 23.3 minutes (16th lowest)
[in-text-ad]
34. Indiana
> Roads in poor condition: 3.4% (18th lowest)
> Structurally deficient bridges: 6.2% (21st lowest)
> State highway spending per driver: $383 (12th lowest)
> Avg. travel time to work: 23.6 minutes (18th lowest)
[recirclink id=510120]
33. Idaho
> Roads in poor condition: 2.8% (13th lowest)
> Structurally deficient bridges: 7.0% (23rd lowest)
> State highway spending per driver: $500 (24th highest)
> Avg. travel time to work: 21.0 minutes (9th lowest)
32. Wyoming
> Roads in poor condition: 1.9% (4th lowest)
> Structurally deficient bridges: 8.2% (21st highest)
> State highway spending per driver: $1,241 (3rd highest)
> Avg. travel time to work: 17.6 minutes (3rd lowest)
[in-text-ad-2]
31. Arkansas
> Roads in poor condition: 6.3% (18th highest)
> Structurally deficient bridges: 4.6% (11th lowest)
> State highway spending per driver: $495 (25th lowest)
> Avg. travel time to work: 21.6 minutes (10th lowest)
30. Missouri
> Roads in poor condition: 2.2% (6th lowest)
> Structurally deficient bridges: 8.6% (18th highest)
> State highway spending per driver: $314 (9th lowest)
> Avg. travel time to work: 23.7 minutes (19th lowest)
[in-text-ad]
29. Montana
> Roads in poor condition: 3.5% (20th lowest)
> Structurally deficient bridges: 7.4% (23rd highest)
> State highway spending per driver: $934 (4th highest)
> Avg. travel time to work: 18.1 minutes (4th lowest)
[recirclink id=538799]
28. Colorado
> Roads in poor condition: 5.9% (21st highest)
> Structurally deficient bridges: 5.4% (18th lowest)
> State highway spending per driver: $305 (7th lowest)
> Avg. travel time to work: 25.9 minutes (18th highest)
27. Ohio
> Roads in poor condition: 5.8% (22nd highest)
> Structurally deficient bridges: 5.6% (19th lowest)
> State highway spending per driver: $415 (17th lowest)
> Avg. travel time to work: 23.6 minutes (18th lowest)
[in-text-ad-2]
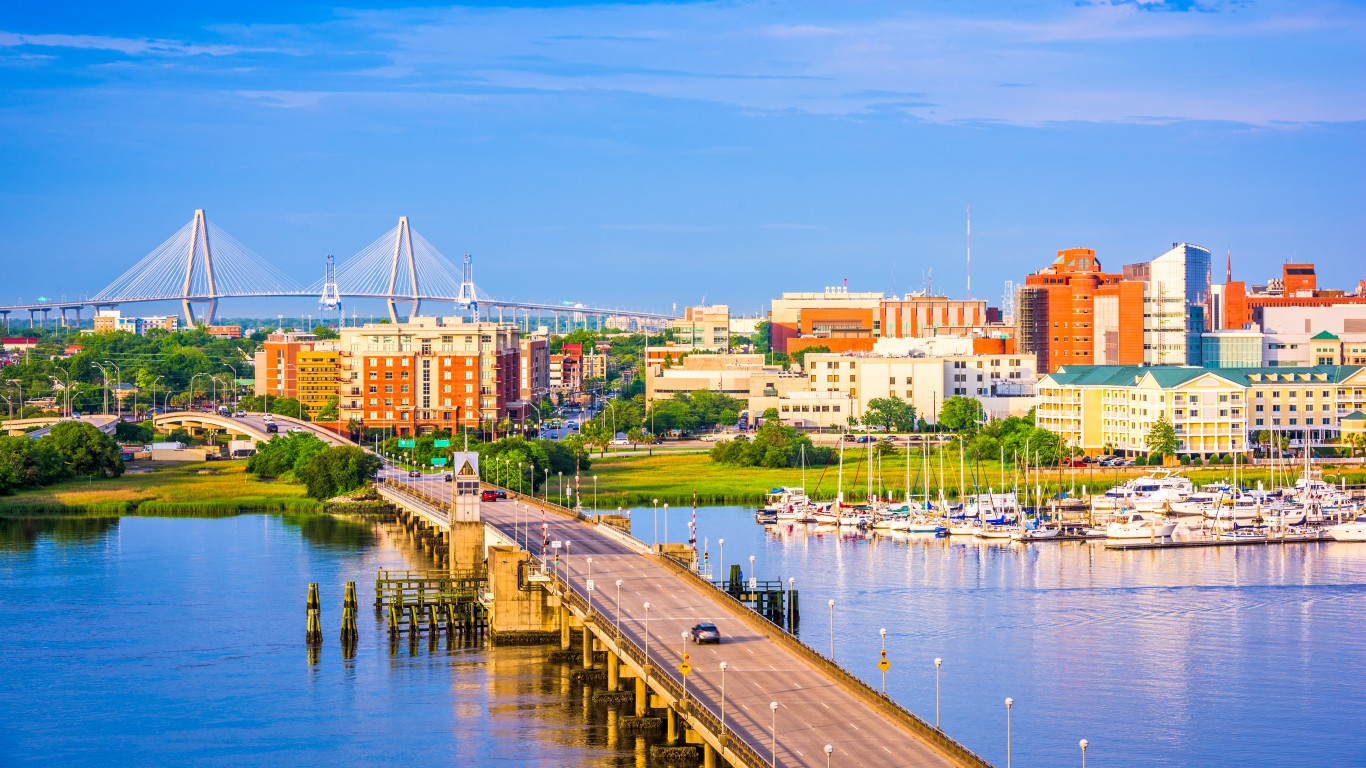
26. South Carolina
> Roads in poor condition: 4.4% (23rd lowest)
> Structurally deficient bridges: 8.5% (20th highest)
> State highway spending per driver: $313 (8th lowest)
> Avg. travel time to work: 24.6 minutes (25th highest)
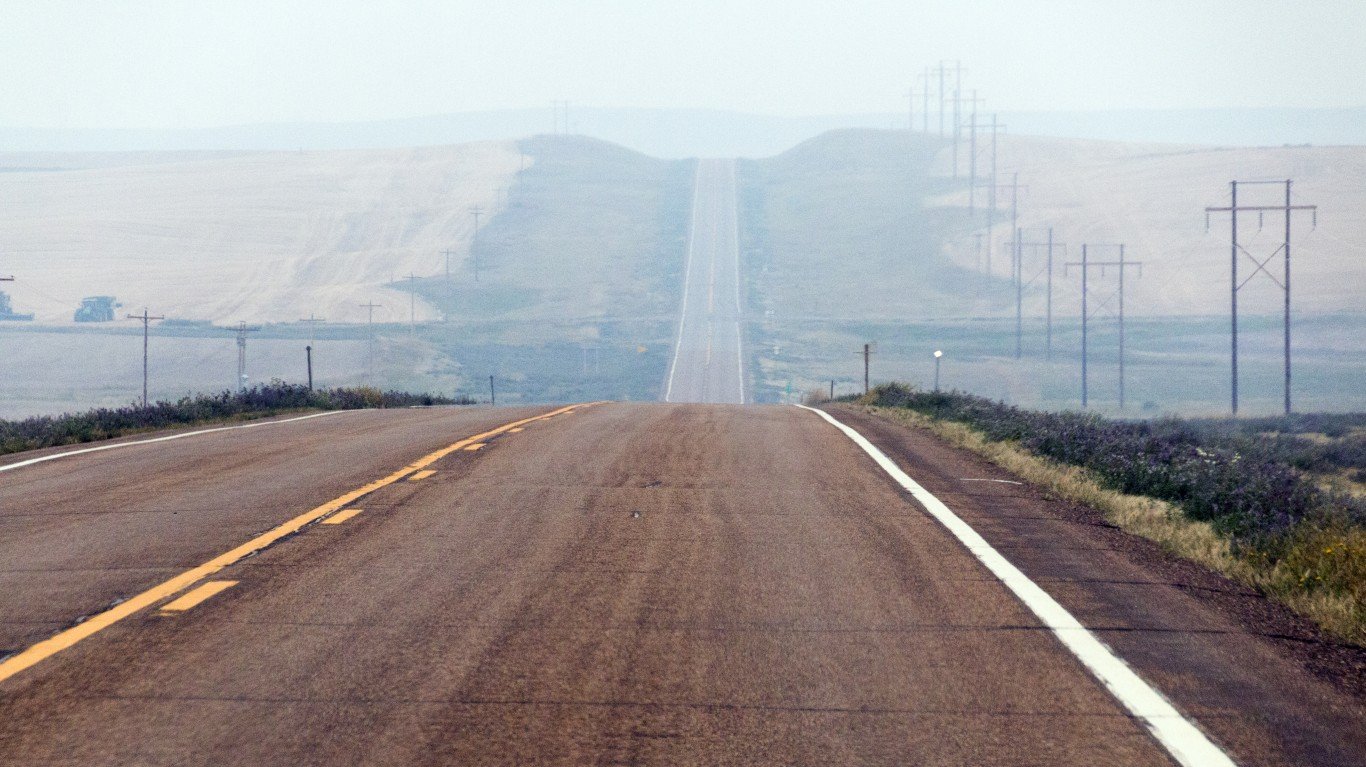
25. North Dakota
> Roads in poor condition: 2.2% (7th lowest)
> Structurally deficient bridges: 10.8% (9th highest)
> State highway spending per driver: $1,743 (2nd highest)
> Avg. travel time to work: 16.5 minutes (the lowest)
[in-text-ad]
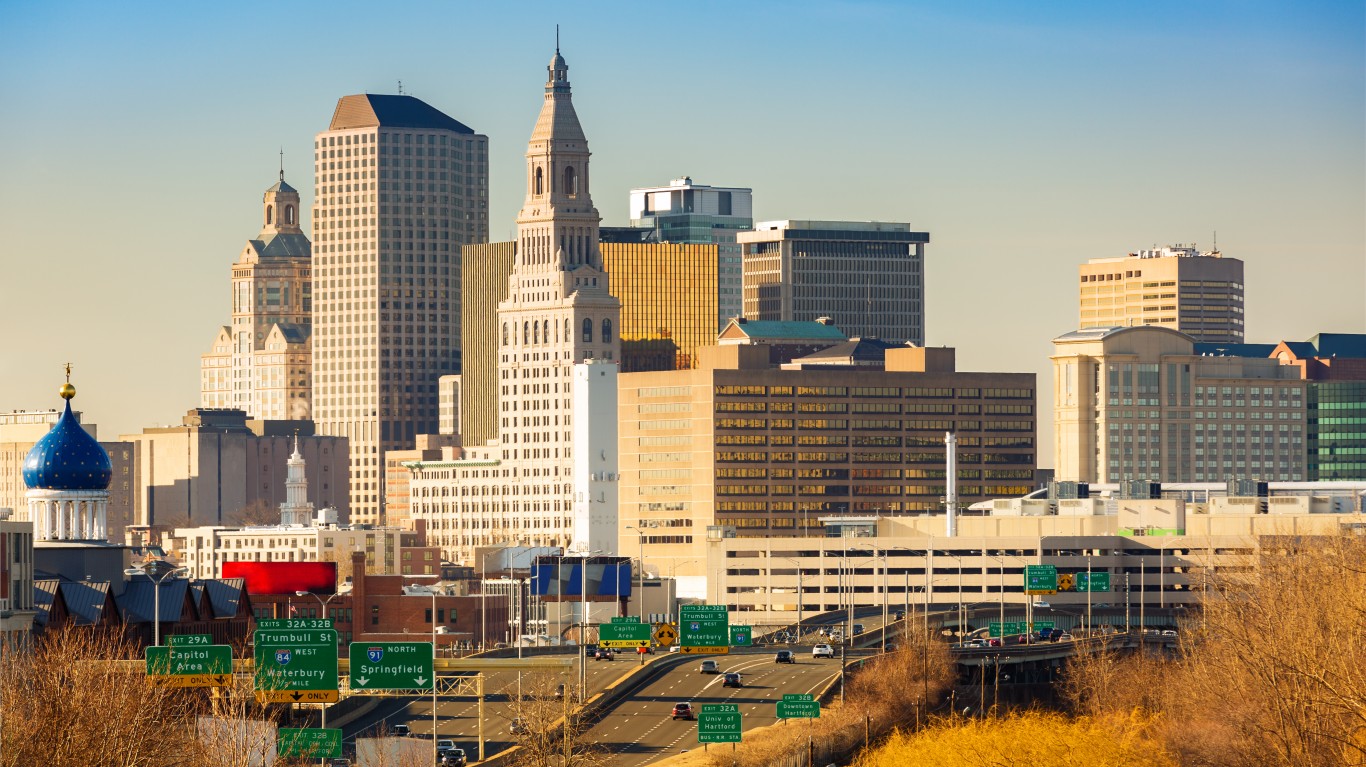
24. Connecticut
> Roads in poor condition: 6.2% (19th highest)
> Structurally deficient bridges: 7.2% (25th highest)
> State highway spending per driver: $446 (19th lowest)
> Avg. travel time to work: 26.4 minutes (16th highest)
[recirclink id=537241]

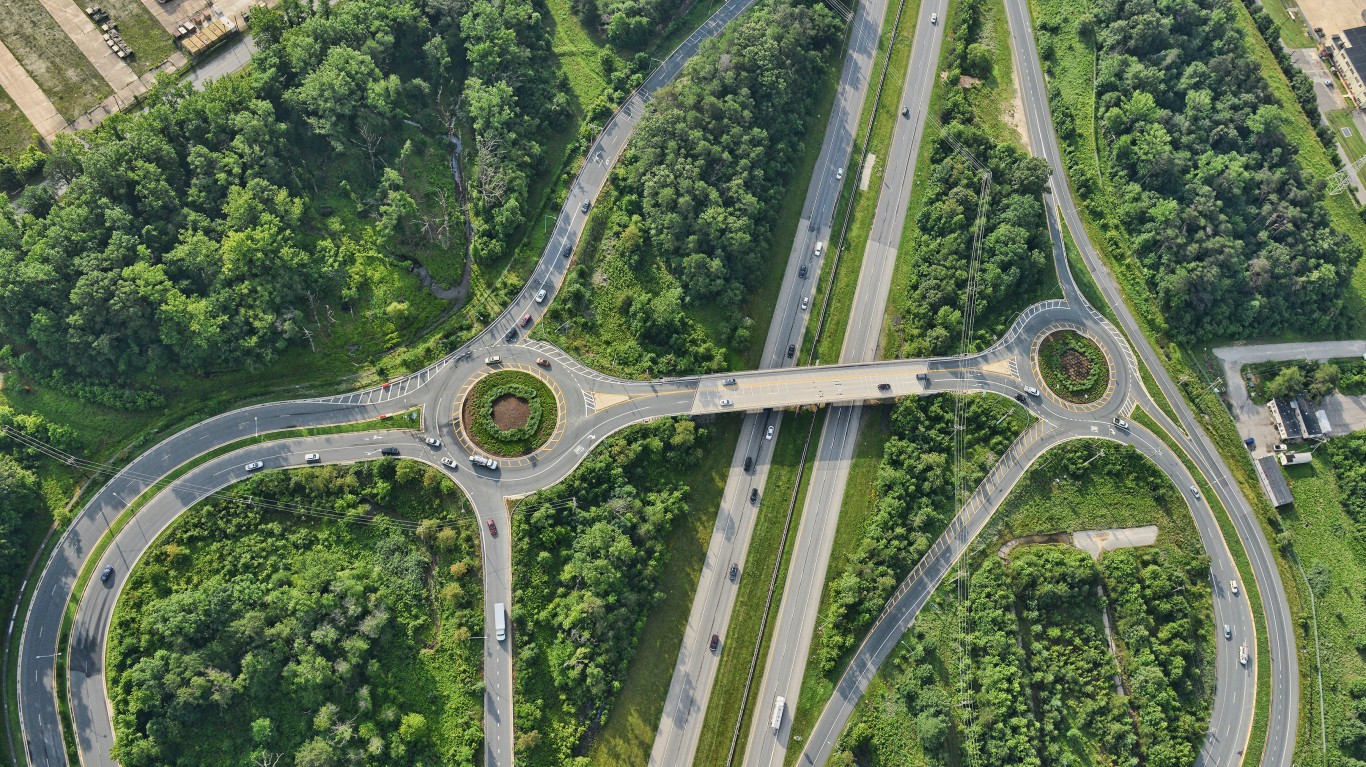
23. North Carolina
> Roads in poor condition: 3.3% (17th lowest)
> Structurally deficient bridges: 10.2% (11th highest)
> State highway spending per driver: $480 (24th lowest)
> Avg. travel time to work: 24.9 minutes (23rd highest)

22. New Hampshire
> Roads in poor condition: 4.8% (25th lowest)
> Structurally deficient bridges: 9.0% (16th highest)
> State highway spending per driver: $422 (18th lowest)
> Avg. travel time to work: 27.3 minutes (11th highest)
[in-text-ad-2]
21. Maryland
> Roads in poor condition: 9.2% (10th highest)
> Structurally deficient bridges: 5.1% (15th lowest)
> State highway spending per driver: $548 (19th highest)
> Avg. travel time to work: 33.3 minutes (2nd highest)
20. Washington
> Roads in poor condition: 10.7% (9th highest)
> Structurally deficient bridges: 4.6% (12th lowest)
> State highway spending per driver: $385 (13th lowest)
> Avg. travel time to work: 27.9 minutes (9th highest)
[in-text-ad]
19. Nebraska
> Roads in poor condition: 6.4% (17th highest)
> Structurally deficient bridges: 8.8% (17th highest)
> State highway spending per driver: $561 (17th highest)
> Avg. travel time to work: 18.5 minutes (5th lowest)
[recirclink id=521324]
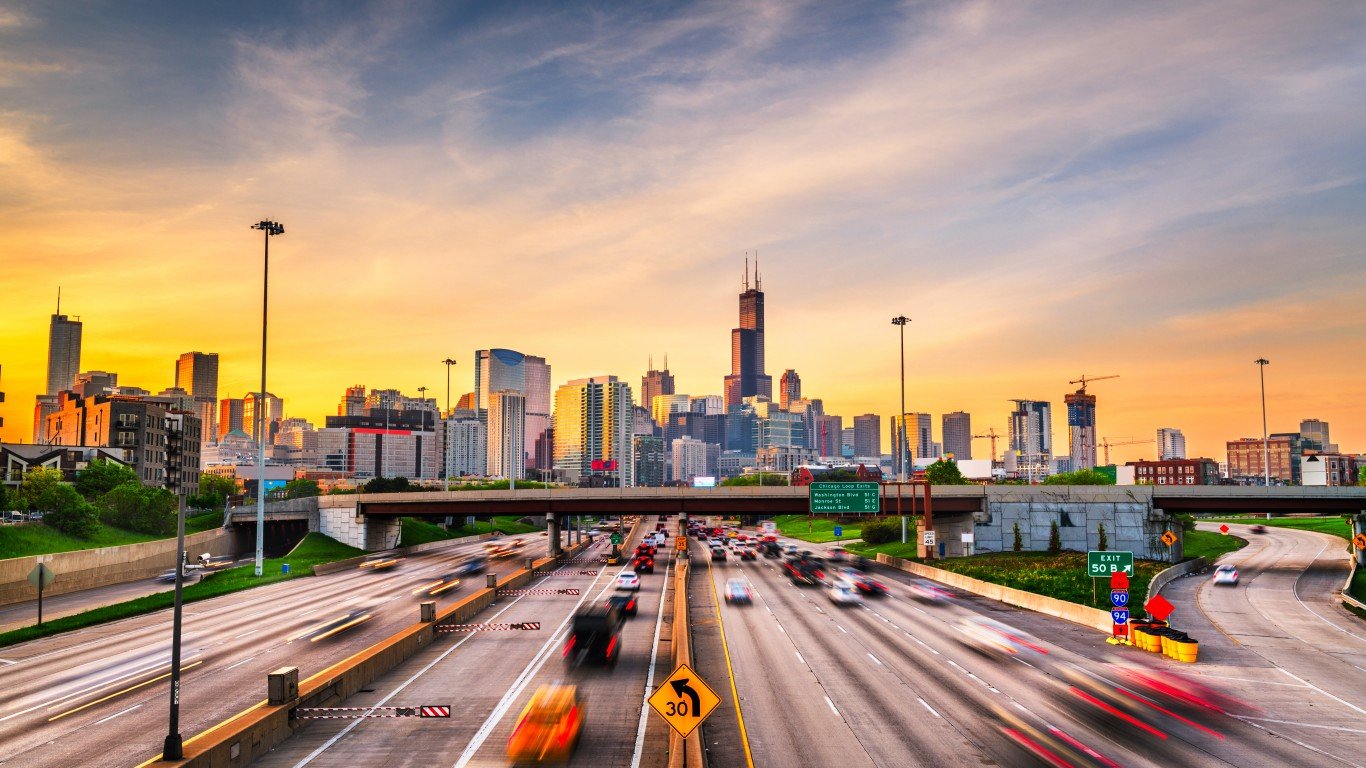
18. Illinois
> Roads in poor condition: 6.9% (16th highest)
> Structurally deficient bridges: 8.5% (19th highest)
> State highway spending per driver: $723 (10th highest)
> Avg. travel time to work: 29.1 minutes (6th highest)
17. Mississippi
> Roads in poor condition: 6.0% (20th highest)
> Structurally deficient bridges: 9.4% (14th highest)
> State highway spending per driver: $468 (23rd lowest)
> Avg. travel time to work: 24.9 minutes (23rd highest)
[in-text-ad-2]
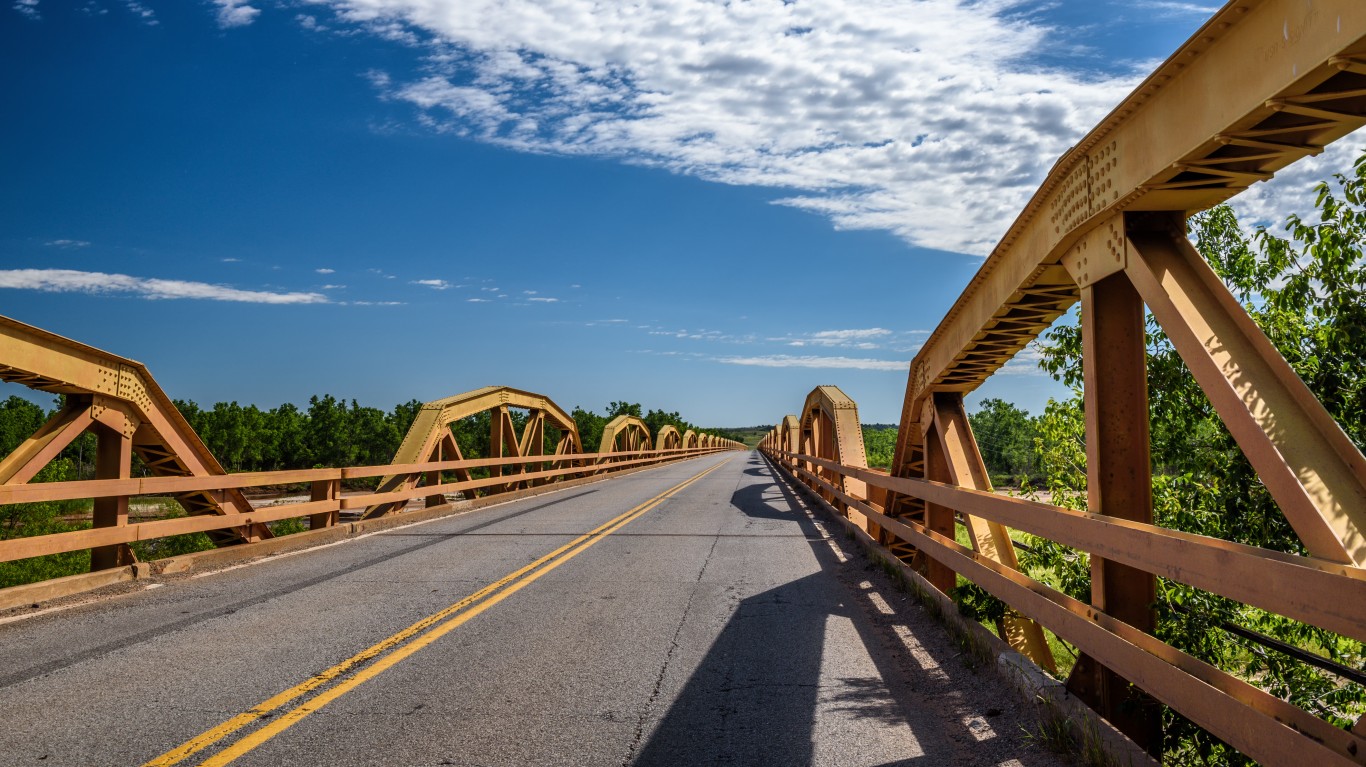
16. Oklahoma
> Roads in poor condition: 5.3% (24th highest)
> Structurally deficient bridges: 11.0% (8th highest)
> State highway spending per driver: $689 (11th highest)
> Avg. travel time to work: 21.9 minutes (11th lowest)
15. Wisconsin
> Roads in poor condition: 11.1% (8th highest)
> Structurally deficient bridges: 7.4% (24th highest)
> State highway spending per driver: $449 (20th lowest)
> Avg. travel time to work: 22.2 minutes (13th lowest)
[in-text-ad]

14. Michigan
> Roads in poor condition: 7.6% (12th highest)
> Structurally deficient bridges: 10.7% (10th highest)
> State highway spending per driver: $172 (the lowest)
> Avg. travel time to work: 24.3 minutes (24th lowest)
[recirclink id=510120]
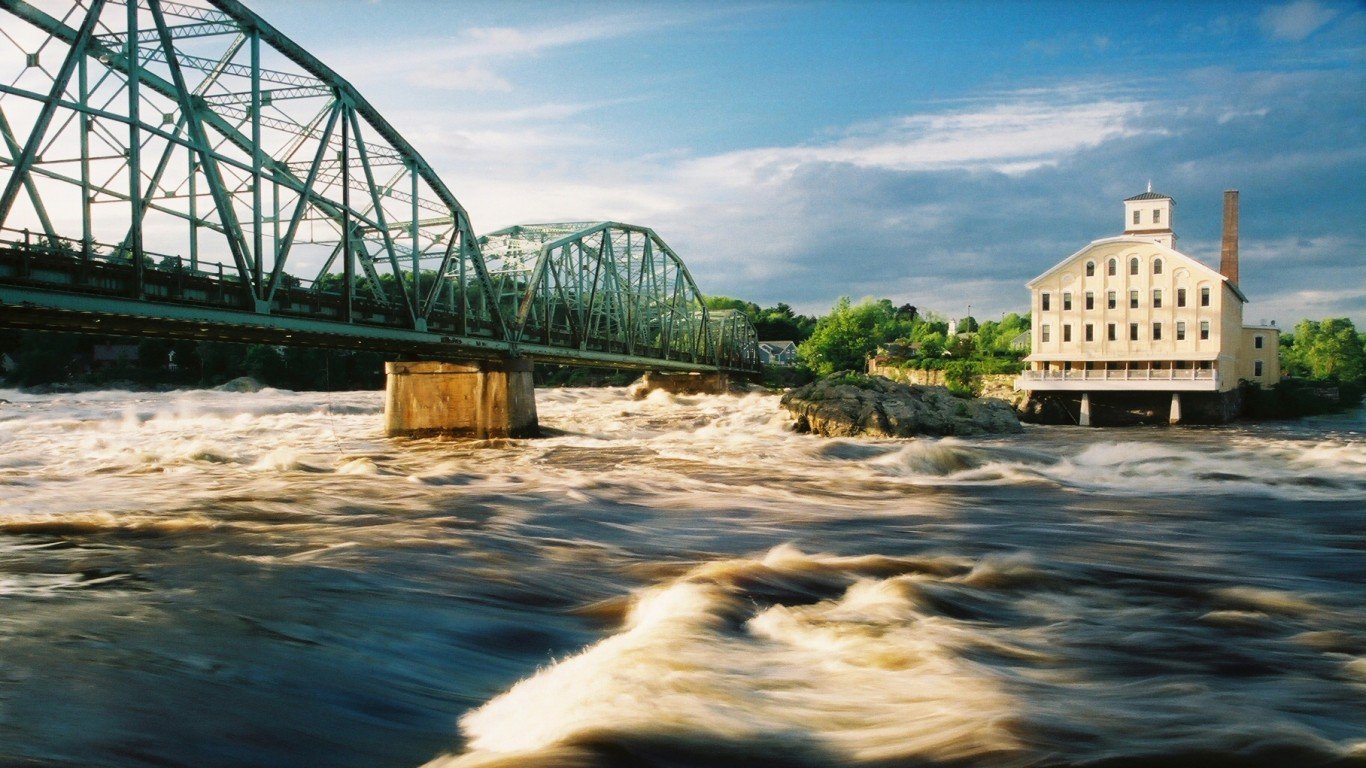
13. Maine
> Roads in poor condition: 7.3% (14th highest)
> Structurally deficient bridges: 13.1% (6th highest)
> State highway spending per driver: $610 (15th highest)
> Avg. travel time to work: 24.0 minutes (21st lowest)
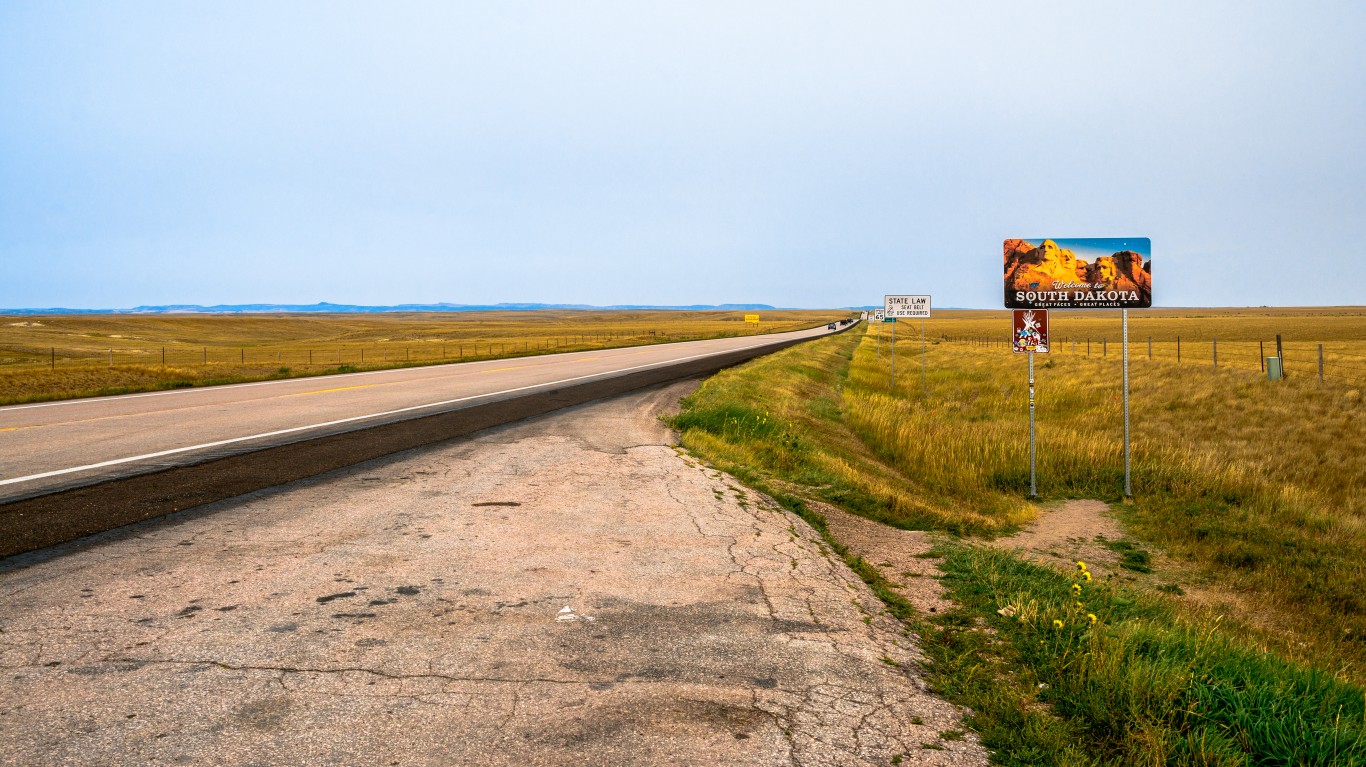
12. South Dakota
> Roads in poor condition: 4.6% (24th lowest)
> Structurally deficient bridges: 16.7% (4th highest)
> State highway spending per driver: $878 (7th highest)
> Avg. travel time to work: 17.3 minutes (2nd lowest)
[in-text-ad-2]
11. Louisiana
> Roads in poor condition: 9.1% (11th highest)
> Structurally deficient bridges: 13.0% (7th highest)
> State highway spending per driver: $450 (21st lowest)
> Avg. travel time to work: 25.3 minutes (20th highest)
10. Hawaii
> Roads in poor condition: 16.1% (5th highest)
> Structurally deficient bridges: 6.9% (22nd lowest)
> State highway spending per driver: $590 (16th highest)
> Avg. travel time to work: 27.0 minutes (13th highest)
[in-text-ad]
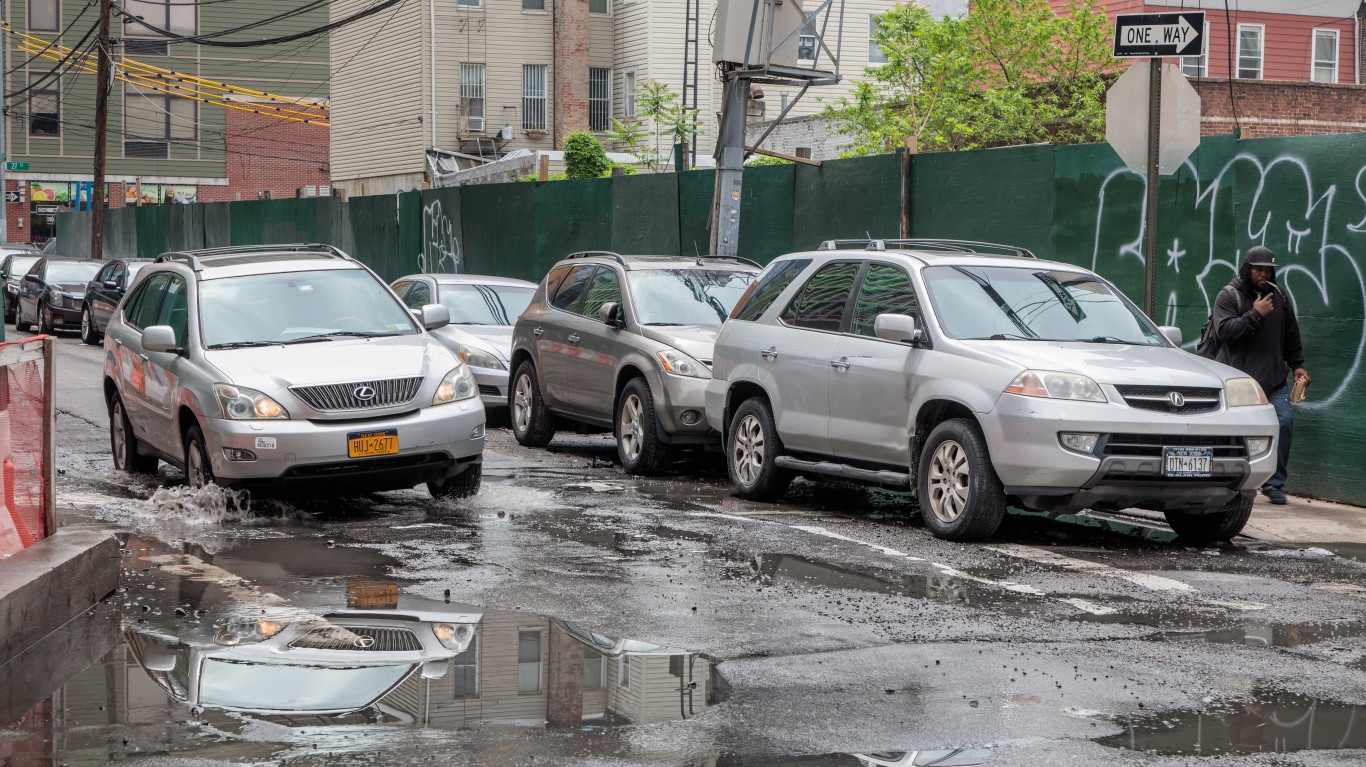
9. New York
> Roads in poor condition: 13.4% (7th highest)
> Structurally deficient bridges: 10.0% (12th highest)
> State highway spending per driver: $366 (11th lowest)
> Avg. travel time to work: 33.7 minutes (the highest)
[recirclink id=538799]
8. California
> Roads in poor condition: 16.9% (3rd highest)
> Structurally deficient bridges: 7.0% (24th lowest)
> State highway spending per driver: $269 (4th lowest)
> Avg. travel time to work: 29.8 minutes (4th highest)
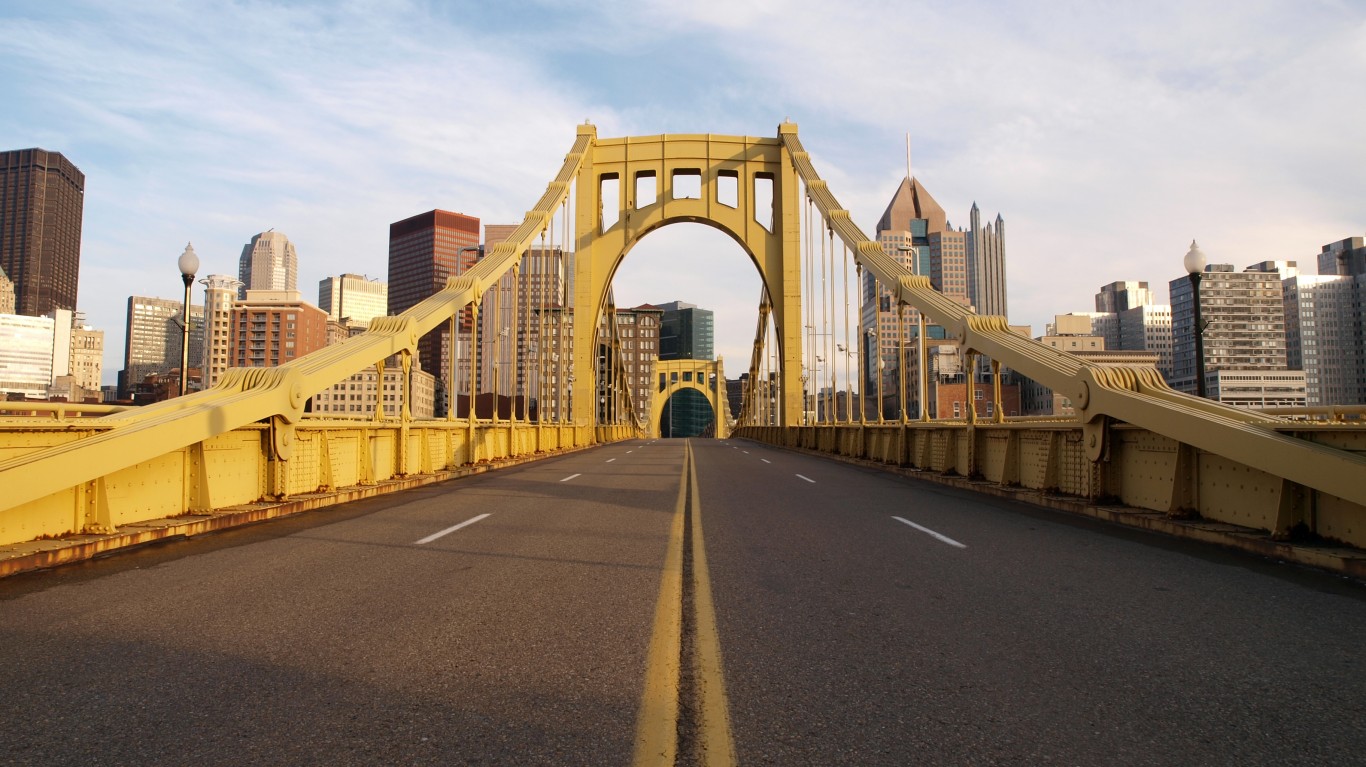
7. Pennsylvania
> Roads in poor condition: 7.1% (15th highest)
> Structurally deficient bridges: 16.6% (5th highest)
> State highway spending per driver: $773 (9th highest)
> Avg. travel time to work: 27.1 minutes (12th highest)
[in-text-ad-2]
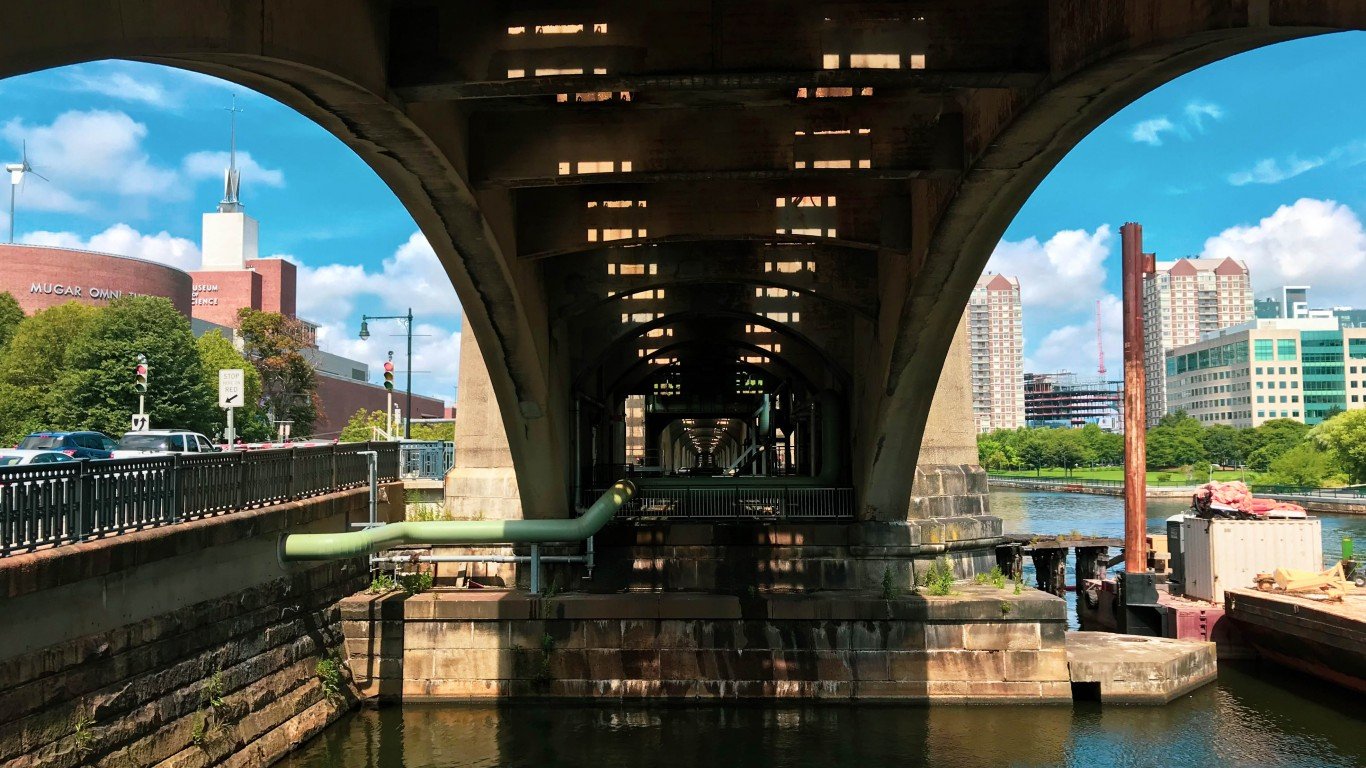
6. Massachusetts
> Roads in poor condition: 15.4% (6th highest)
> Structurally deficient bridges: 9.2% (15th highest)
> State highway spending per driver: $495 (25th highest)
> Avg. travel time to work: 29.8 minutes (4th highest)
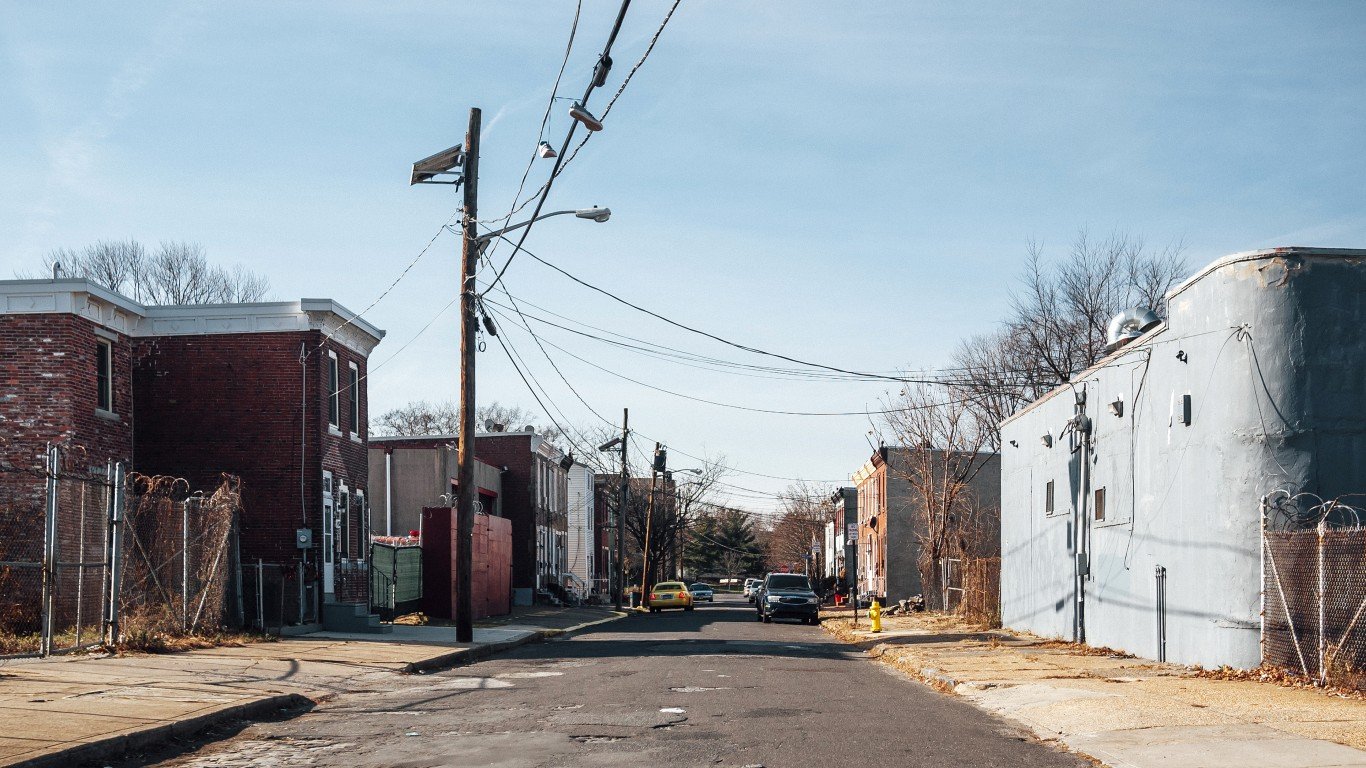
5. New Jersey
> Roads in poor condition: 16.8% (4th highest)
> Structurally deficient bridges: 8.1% (22nd highest)
> State highway spending per driver: $516 (22nd highest)
> Avg. travel time to work: 32.1 minutes (3rd highest)
[in-text-ad]
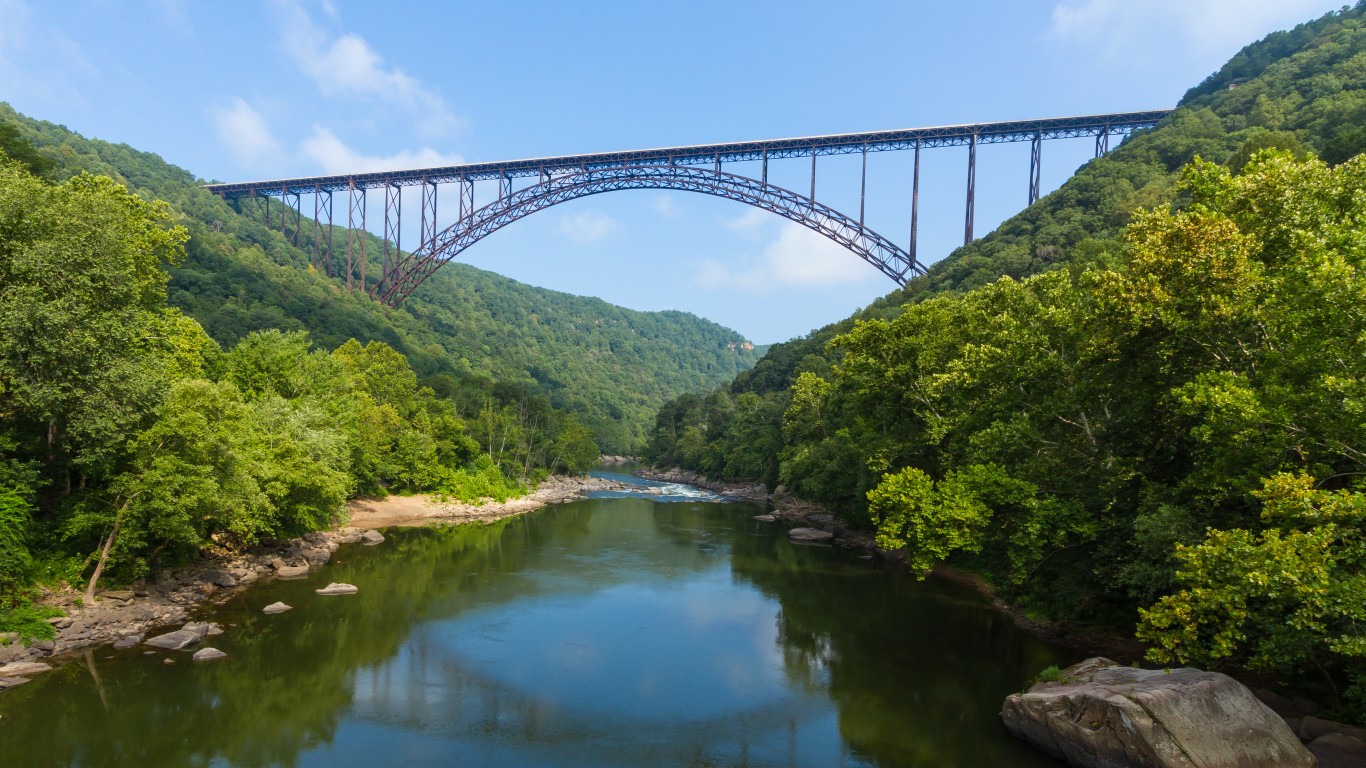
4. West Virginia
> Roads in poor condition: 4.8% (25th highest)
> Structurally deficient bridges: 19.9% (2nd highest)
> State highway spending per driver: $910 (5th highest)
> Avg. travel time to work: 26.0 minutes (17th highest)
[recirclink id=537241]
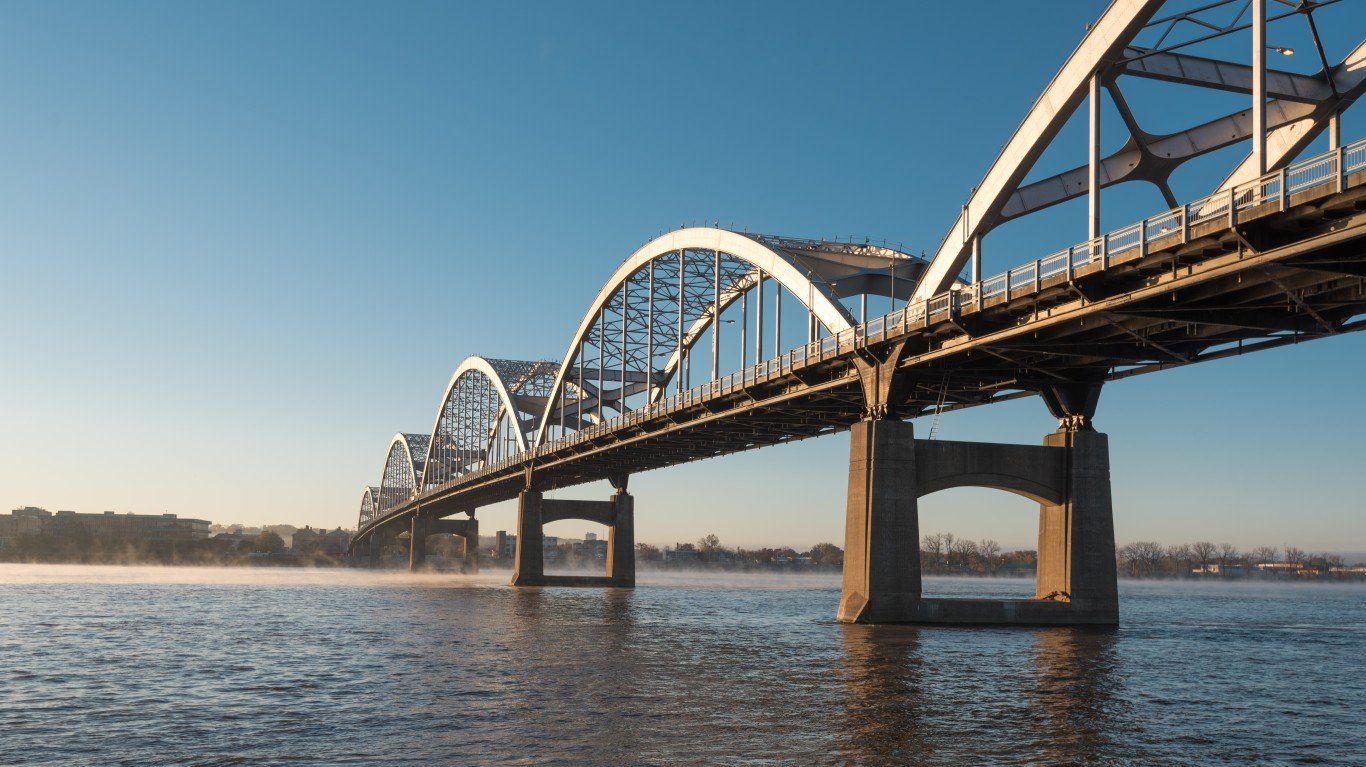
3. Iowa
> Roads in poor condition: 7.5% (13th highest)
> Structurally deficient bridges: 19.4% (3rd highest)
> State highway spending per driver: $684 (12th highest)
> Avg. travel time to work: 19.4 minutes (7th lowest)
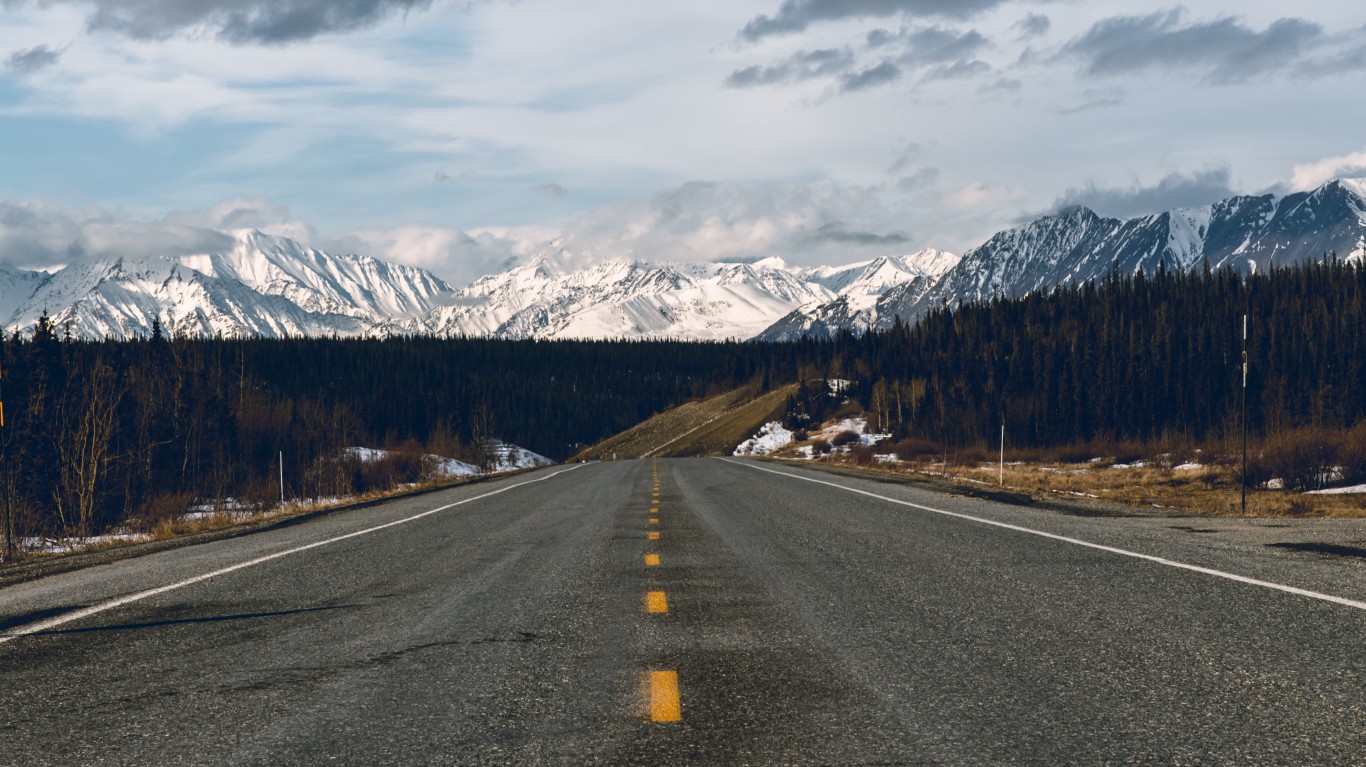
2. Alaska
> Roads in poor condition: 18.7% (2nd highest)
> Structurally deficient bridges: 9.7% (13th highest)
> State highway spending per driver: $2,374 (the highest)
> Avg. travel time to work: 19.6 minutes (8th lowest)
[in-text-ad-2]
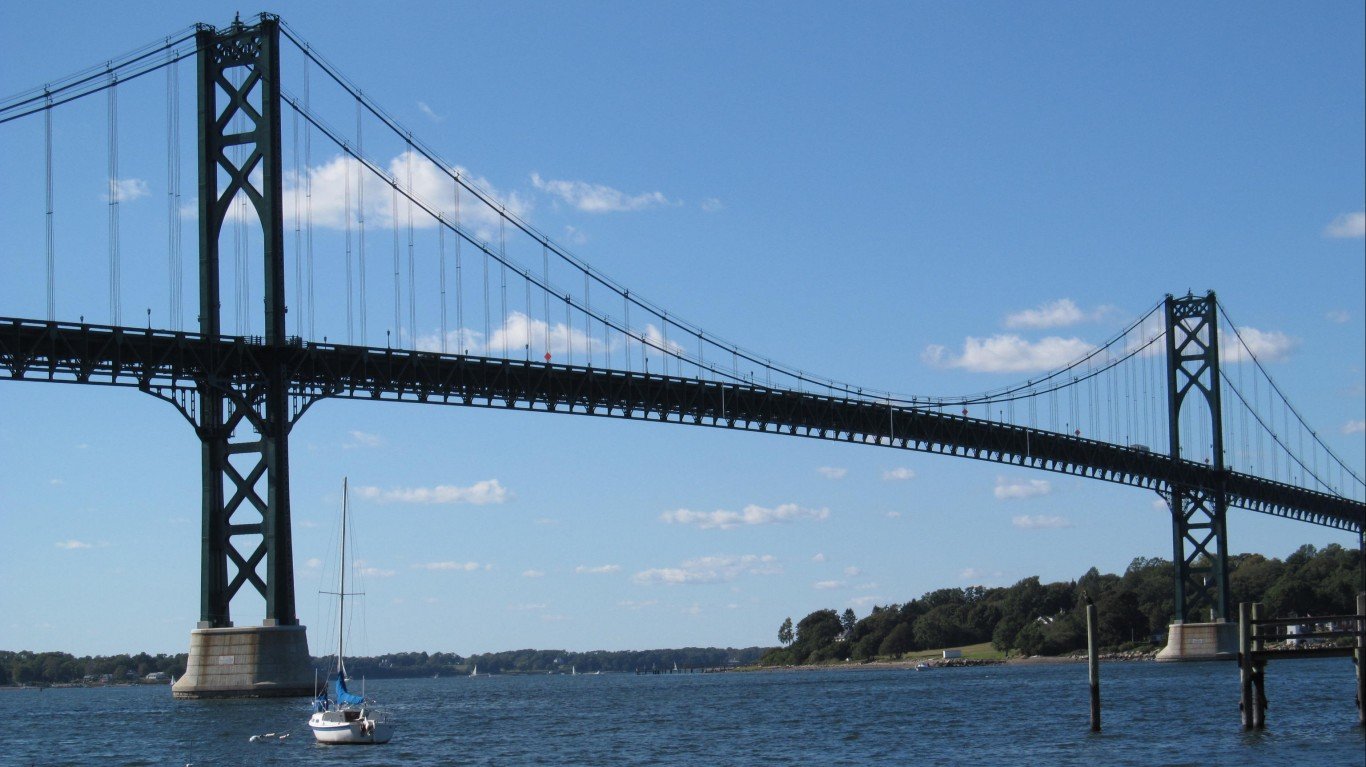
1. Rhode Island
> Roads in poor condition: 24.6% (the highest)
> Structurally deficient bridges: 23.1% (the highest)
> State highway spending per driver: $408 (16th lowest)
> Avg. travel time to work: 25.1 minutes (21st highest)
Methodology
To identify the states with the worst infrastructure, 24/7 Wall St. created an index accounting for the share in each state of roads in poor condition and the share of bridges classified as structurally deficient. The share of roadways in poor condition and the share of bridges considered structurally deficient came from the Federal Highway Administration’s report Highway Statistics 2017. Highway spending as a share of total government spending came from the U.S. Census Bureau’s 2016 Annual Survey of State Government Finances.
Contact [email protected] for any questions or corrections.