The core question in American politics, underlying all facets of public policy debate, is the proper size and function of government. The range of opinions on the matter is evidenced not only in our national political discourse, but also in the wide variance in spending at state and local government levels.
State and local governments build parks and libraries, maintain law and order, and clear and maintain roadways. They operate municipal waste systems and are entrusted with educating our children. States also provide for the welfare of residents through a variety of support systems. Larger urban areas provide public transportation systems as well.
Differences in government spending per capita at the state and local level are driven by the priorities of local voters, economic conditions, and often also by geographic area and local climate.
24/7 Wall St. reviewed per capita government expenditure data from the U.S. Census Bureau to determine what your state spends on you. The average spending per capita varies from as little as $7,430 in one state to nearly triple that amount in others.
Generally, the states with higher government spending tend to be home to higher income residents. To be sure, many of the states with the highest per capita spending are also America’s richest states. This is no coincidence, as higher incomes provide a stronger tax base, and high-spending states also often are the same states where Americans are paying the most in taxes — although taxes on individuals are not the only source of government revenue.
Per capita government spending generally reflects the overall size and economic impact of the public sector, and many of the states spending the most are also the states with the largest governments, and vice-versa.
Click here to see what your state spends on you
Click here to read our methodology

50. Idaho
> State & local gov’t. spending per capita: $7,430
> State & local tax collections per capita: $2,627 (21st lowest)
> State & local gov’t. employees: 15.1% of workforce (17th highest)
> Median household income: $52,225 (11th lowest)
[in-text-ad]

49. Georgia
> State & local gov’t. spending per capita: $7,971
> State & local tax collections per capita: $2,150 (11th lowest)
> State & local gov’t. employees: 12.9% of workforce (15th lowest)
> Median household income: $56,183 (19th lowest)
[recirclink id=538799]

48. Florida
> State & local gov’t. spending per capita: $8,113
> State & local tax collections per capita: $1,917 (4th lowest)
> State & local gov’t. employees: 10.9% of workforce (4th lowest)
> Median household income: $52,594 (12th lowest)
47. Nevada
> State & local gov’t. spending per capita: $8,347
> State & local tax collections per capita: $2,877 (20th highest)
> State & local gov’t. employees: 10.0% of workforce (the lowest)
> Median household income: $58,003 (25th lowest)
[in-text-ad-2]

46. Arizona
> State & local gov’t. spending per capita: $8,509
> State & local tax collections per capita: $1,979 (6th lowest)
> State & local gov’t. employees: 12.4% of workforce (9th lowest)
> Median household income: $56,581 (23rd lowest)

45. Tennessee
> State & local gov’t. spending per capita: $8,684
> State & local tax collections per capita: $2,069 (8th lowest)
> State & local gov’t. employees: 12.6% of workforce (12th lowest)
> Median household income: $51,340 (10th lowest)
[in-text-ad]

44. Indiana
> State & local gov’t. spending per capita: $8,732
> State & local tax collections per capita: $2,708 (24th lowest)
> State & local gov’t. employees: 12.3% of workforce (8th lowest)
> Median household income: $54,181 (17th lowest)
[recirclink id=537241]

43. North Carolina
> State & local gov’t. spending per capita: $8,766
> State & local tax collections per capita: $2,614 (19th lowest)
> State & local gov’t. employees: 14.4% of workforce (20th highest)
> Median household income: $52,752 (13th lowest)

42. Oklahoma
> State & local gov’t. spending per capita: $8,800
> State & local tax collections per capita: $2,180 (12th lowest)
> State & local gov’t. employees: 17.5% of workforce (5th highest)
> Median household income: $50,051 (8th lowest)
[in-text-ad-2]

41. Missouri
> State & local gov’t. spending per capita: $8,804
> State & local tax collections per capita: $2,044 (7th lowest)
> State & local gov’t. employees: 13.0% of workforce (16th lowest)
> Median household income: $53,578 (15th lowest)

40. Utah
> State & local gov’t. spending per capita: $8,955
> State & local tax collections per capita: $2,525 (15th lowest)
> State & local gov’t. employees: 13.8% of workforce (25th lowest)
> Median household income: $68,358 (13th highest)
[in-text-ad]

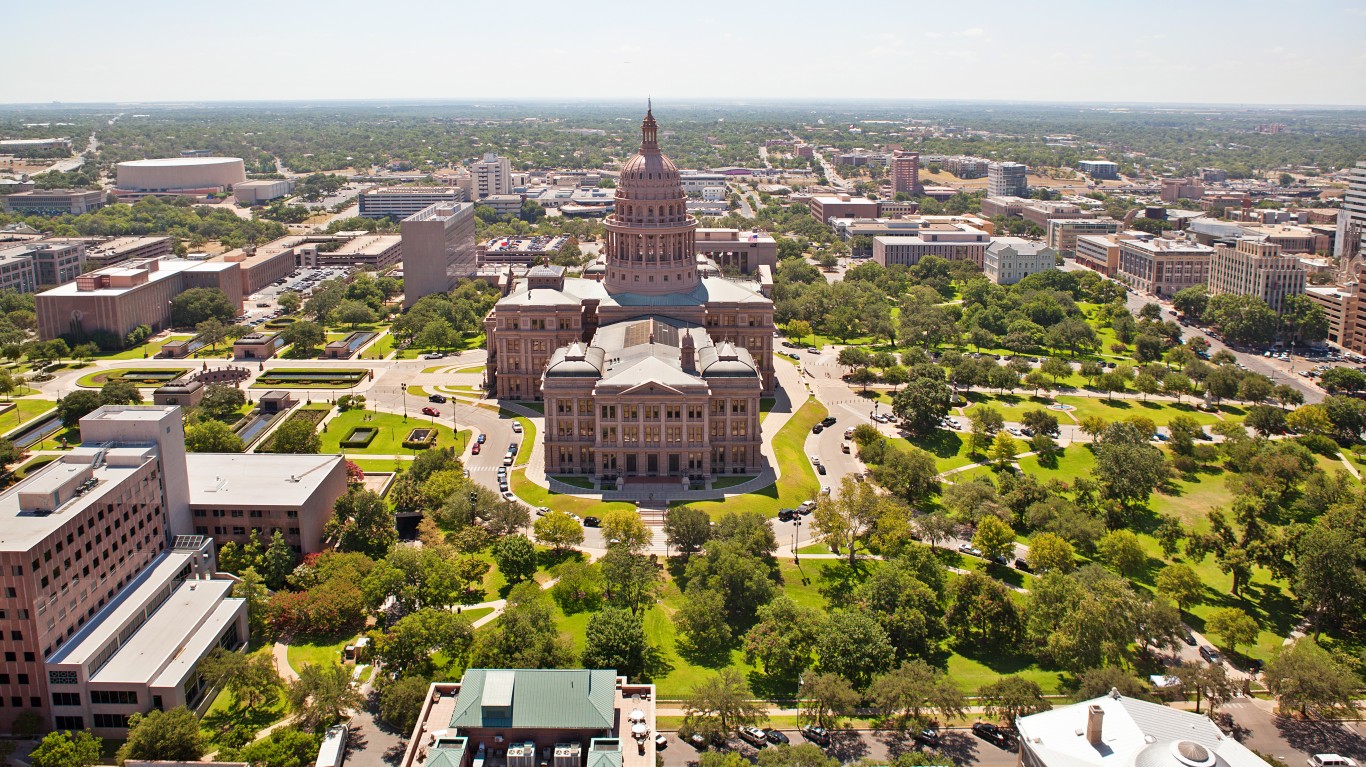
39. Texas
> State & local gov’t. spending per capita: $9,059
> State & local tax collections per capita: $1,894 (3rd lowest)
> State & local gov’t. employees: 13.8% of workforce (24th lowest)
> Median household income: $59,206 (23rd highest)
[recirclink id=521324]

38. Arkansas
> State & local gov’t. spending per capita: $9,136
> State & local tax collections per capita: $3,168 (14th highest)
> State & local gov’t. employees: 15.1% of workforce (16th highest)
> Median household income: $45,869 (3rd lowest)

37. South Dakota
> State & local gov’t. spending per capita: $9,207
> State & local tax collections per capita: $2,103 (9th lowest)
> State & local gov’t. employees: 15.4% of workforce (13th highest)
> Median household income: $56,521 (22nd lowest)
[in-text-ad-2]

36. Alabama
> State & local gov’t. spending per capita: $9,310
> State & local tax collections per capita: $2,137 (10th lowest)
> State & local gov’t. employees: 16.1% of workforce (10th highest)
> Median household income: $48,123 (6th lowest)

35. New Hampshire
> State & local gov’t. spending per capita: $9,430
> State & local tax collections per capita: $1,859 (2nd lowest)
> State & local gov’t. employees: 11.8% of workforce (6th lowest)
> Median household income: $73,381 (6th highest)
[in-text-ad]

34. Virginia
> State & local gov’t. spending per capita: $9,529
> State & local tax collections per capita: $2,623 (20th lowest)
> State & local gov’t. employees: 13.5% of workforce (22nd lowest)
> Median household income: $71,535 (9th highest)
[recirclink id=510120]

33. South Carolina
> State & local gov’t. spending per capita: $9,581
> State & local tax collections per capita: $1,956 (5th lowest)
> State & local gov’t. employees: 15.5% of workforce (12th highest)
> Median household income: $50,570 (9th lowest)

32. Montana
> State & local gov’t. spending per capita: $9,599
> State & local tax collections per capita: $2,527 (16th lowest)
> State & local gov’t. employees: 16.1% of workforce (9th highest)
> Median household income: $53,386 (14th lowest)
[in-text-ad-2]
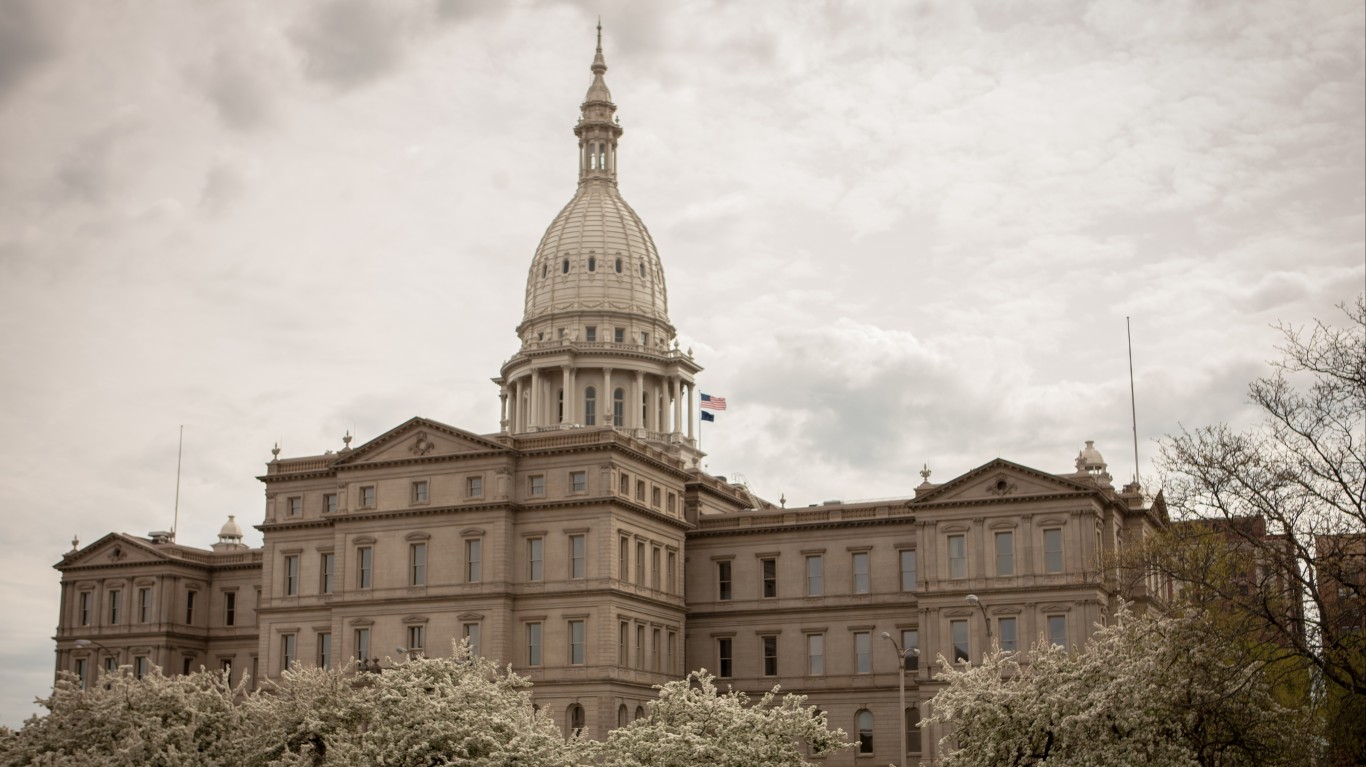
31. Michigan
> State & local gov’t. spending per capita: $9,732
> State & local tax collections per capita: $2,874 (22nd highest)
> State & local gov’t. employees: 12.5% of workforce (10th lowest)
> Median household income: $54,909 (18th lowest)

30. Maine
> State & local gov’t. spending per capita: $9,744
> State & local tax collections per capita: $3,168 (13th highest)
> State & local gov’t. employees: 13.4% of workforce (21st lowest)
> Median household income: $56,277 (20th lowest)
[in-text-ad]

29. West Virginia
> State & local gov’t. spending per capita: $9,860
> State & local tax collections per capita: $2,804 (25th highest)
> State & local gov’t. employees: 17.3% of workforce (6th highest)
> Median household income: $43,469 (the lowest)
[recirclink id=538799]
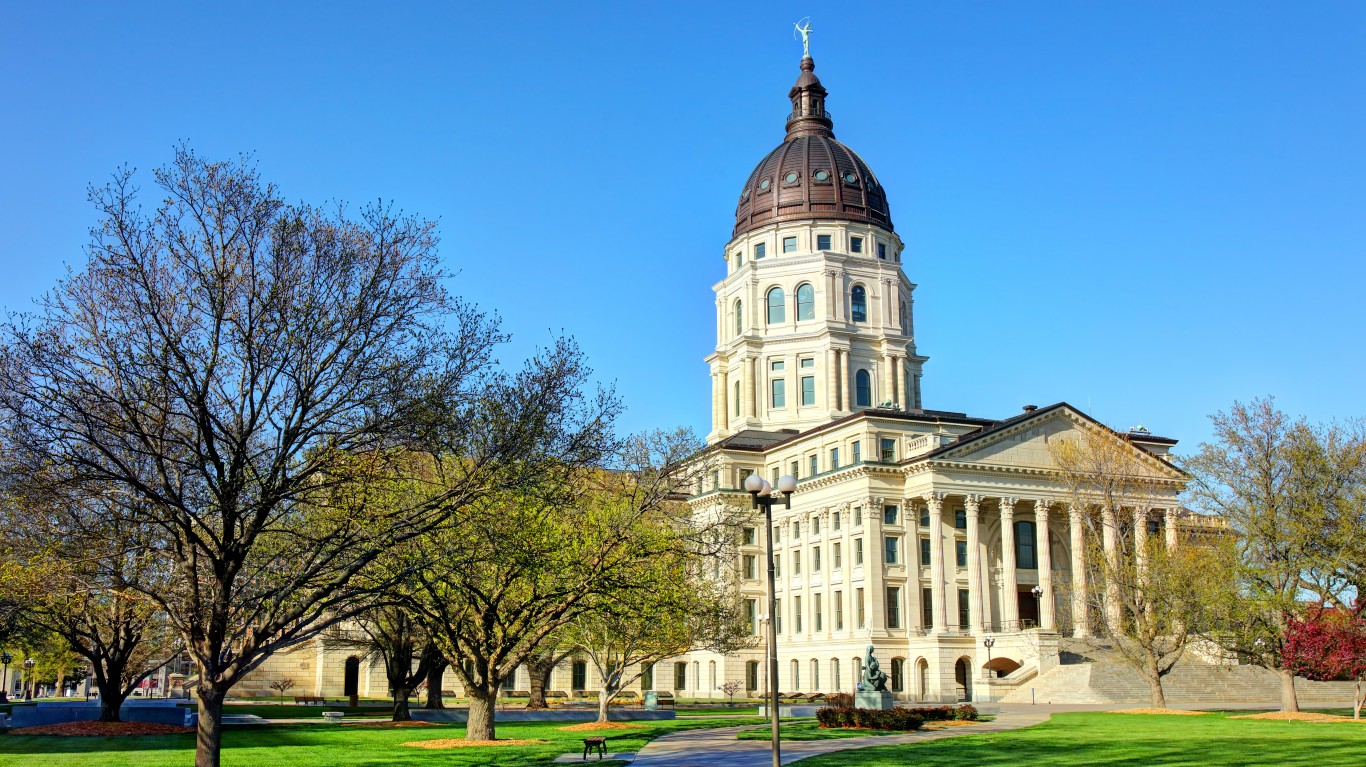
28. Kansas
> State & local gov’t. spending per capita: $9,903
> State & local tax collections per capita: $2,806 (24th highest)
> State & local gov’t. employees: 16.4% of workforce (8th highest)
> Median household income: $56,422 (21st lowest)

27. Mississippi
> State & local gov’t. spending per capita: $10,014
> State & local tax collections per capita: $2,608 (18th lowest)
> State & local gov’t. employees: 18.6% of workforce (3rd highest)
> Median household income: $43,529 (2nd lowest)
[in-text-ad-2]

26. Louisiana
> State & local gov’t. spending per capita: $10,144
> State & local tax collections per capita: $2,371 (14th lowest)
> State & local gov’t. employees: 14.9% of workforce (18th highest)
> Median household income: $46,145 (4th lowest)

25. Kentucky
> State & local gov’t. spending per capita: $10,245
> State & local tax collections per capita: $2,673 (23rd lowest)
> State & local gov’t. employees: 14.2% of workforce (22nd highest)
> Median household income: $48,375 (7th lowest)
[in-text-ad]

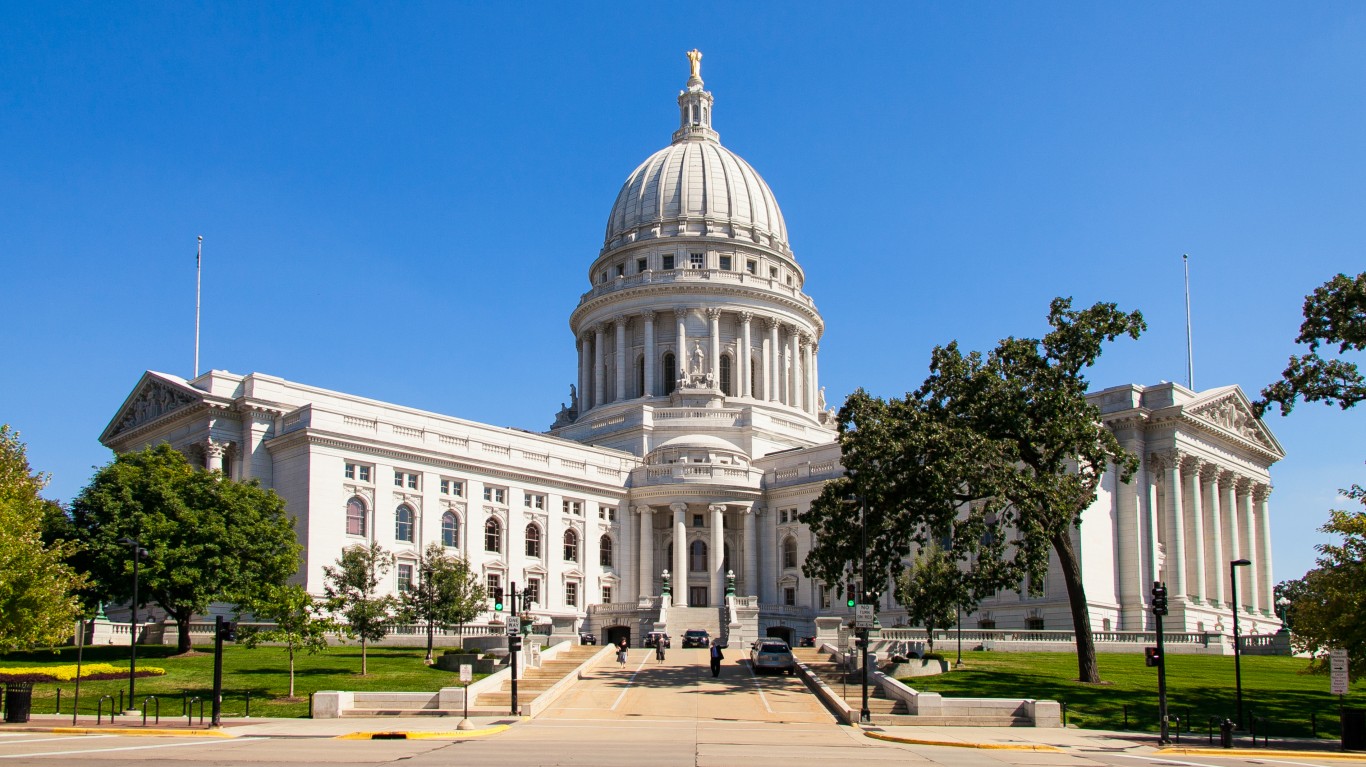
24. Wisconsin
> State & local gov’t. spending per capita: $10,302
> State & local tax collections per capita: $3,129 (15th highest)
> State & local gov’t. employees: 12.6% of workforce (13th lowest)
> Median household income: $59,305 (22nd highest)
[recirclink id=537241]

23. Colorado
> State & local gov’t. spending per capita: $10,342
> State & local tax collections per capita: $2,354 (13th lowest)
> State & local gov’t. employees: 14.2% of workforce (21st highest)
> Median household income: $69,117 (11th highest)
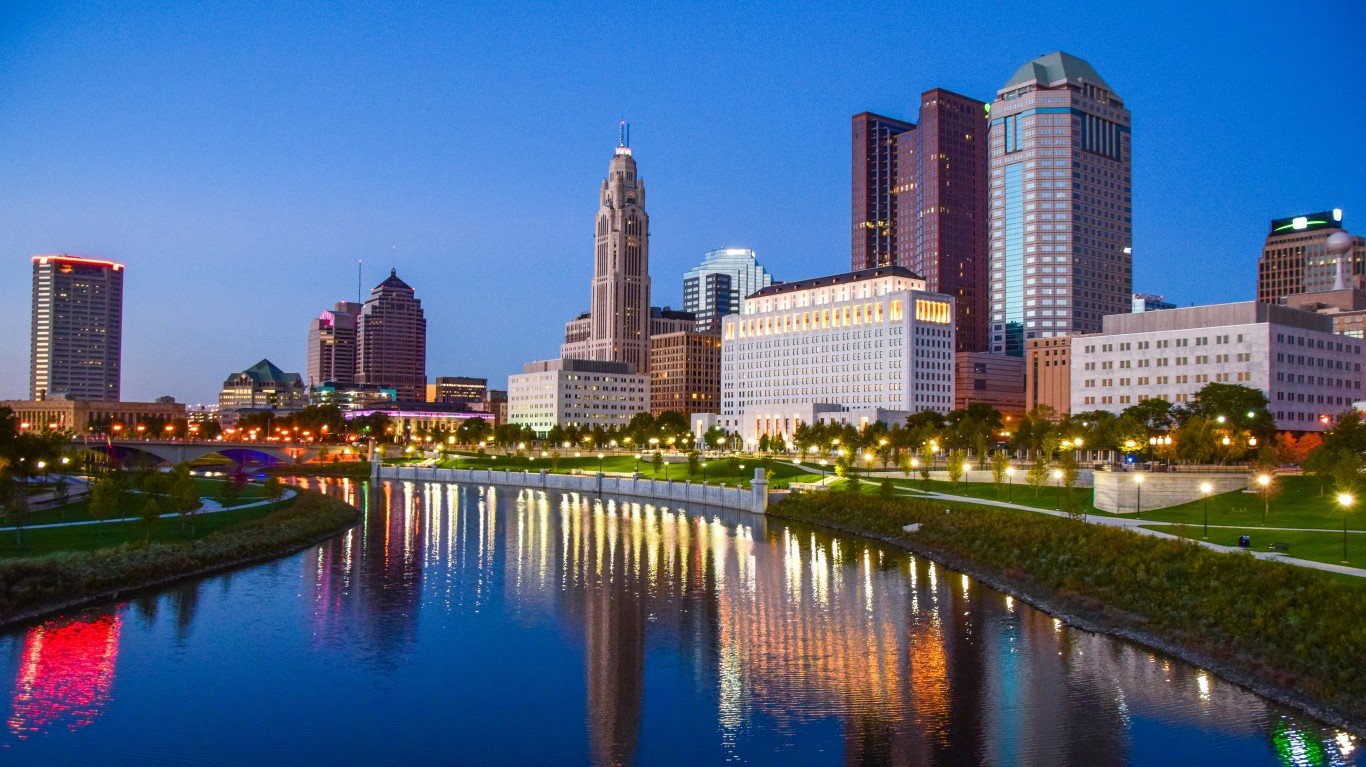
22. Ohio
> State & local gov’t. spending per capita: $10,812
> State & local tax collections per capita: $2,599 (17th lowest)
> State & local gov’t. employees: 12.5% of workforce (11th lowest)
> Median household income: $54,021 (16th lowest)
[in-text-ad-2]
21. Illinois
> State & local gov’t. spending per capita: $10,923
> State & local tax collections per capita: $2,967 (18th highest)
> State & local gov’t. employees: 12.1% of workforce (7th lowest)
> Median household income: $62,992 (16th highest)
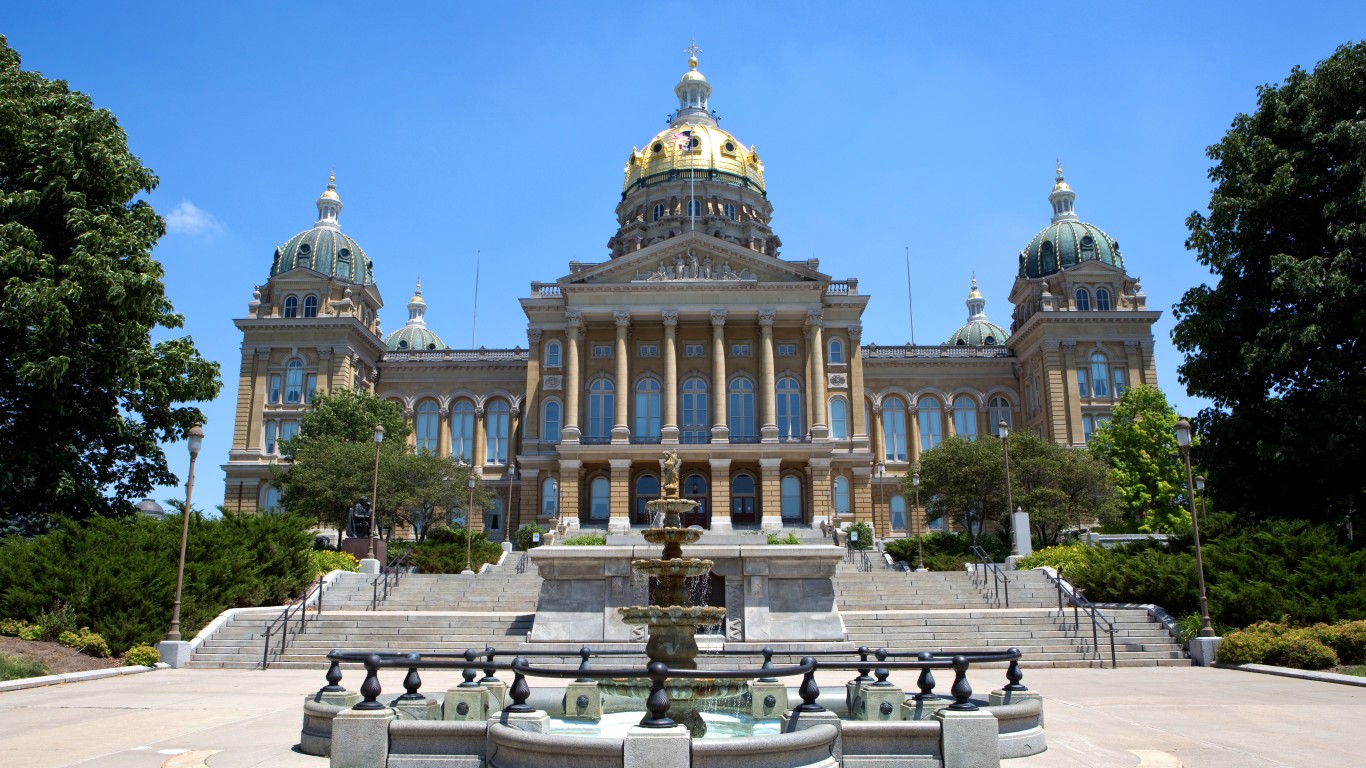
20. Iowa
> State & local gov’t. spending per capita: $11,139
> State & local tax collections per capita: $3,101 (16th highest)
> State & local gov’t. employees: 15.2% of workforce (15th highest)
> Median household income: $58,570 (25th highest)
[in-text-ad]

19. Maryland
> State & local gov’t. spending per capita: $11,210
> State & local tax collections per capita: $3,569 (11th highest)
> State & local gov’t. employees: 13.1% of workforce (17th lowest)
> Median household income: $80,776 (the highest)
[recirclink id=521324]

18. Pennsylvania
> State & local gov’t. spending per capita: $11,229
> State & local tax collections per capita: $2,956 (19th highest)
> State & local gov’t. employees: 10.0% of workforce (2nd lowest)
> Median household income: $59,195 (24th highest)

17. New Mexico
> State & local gov’t. spending per capita: $11,336
> State & local tax collections per capita: $2,766 (25th lowest)
> State & local gov’t. employees: 18.3% of workforce (4th highest)
> Median household income: $46,744 (5th lowest)
[in-text-ad-2]

16. Hawaii
> State & local gov’t. spending per capita: $11,353
> State & local tax collections per capita: $4,924 (2nd highest)
> State & local gov’t. employees: 14.1% of workforce (23rd highest)
> Median household income: $77,765 (3rd highest)

15. Rhode Island
> State & local gov’t. spending per capita: $11,534
> State & local tax collections per capita: $3,083 (17th highest)
> State & local gov’t. employees: 10.1% of workforce (3rd lowest)
> Median household income: $63,870 (15th highest)
[in-text-ad]
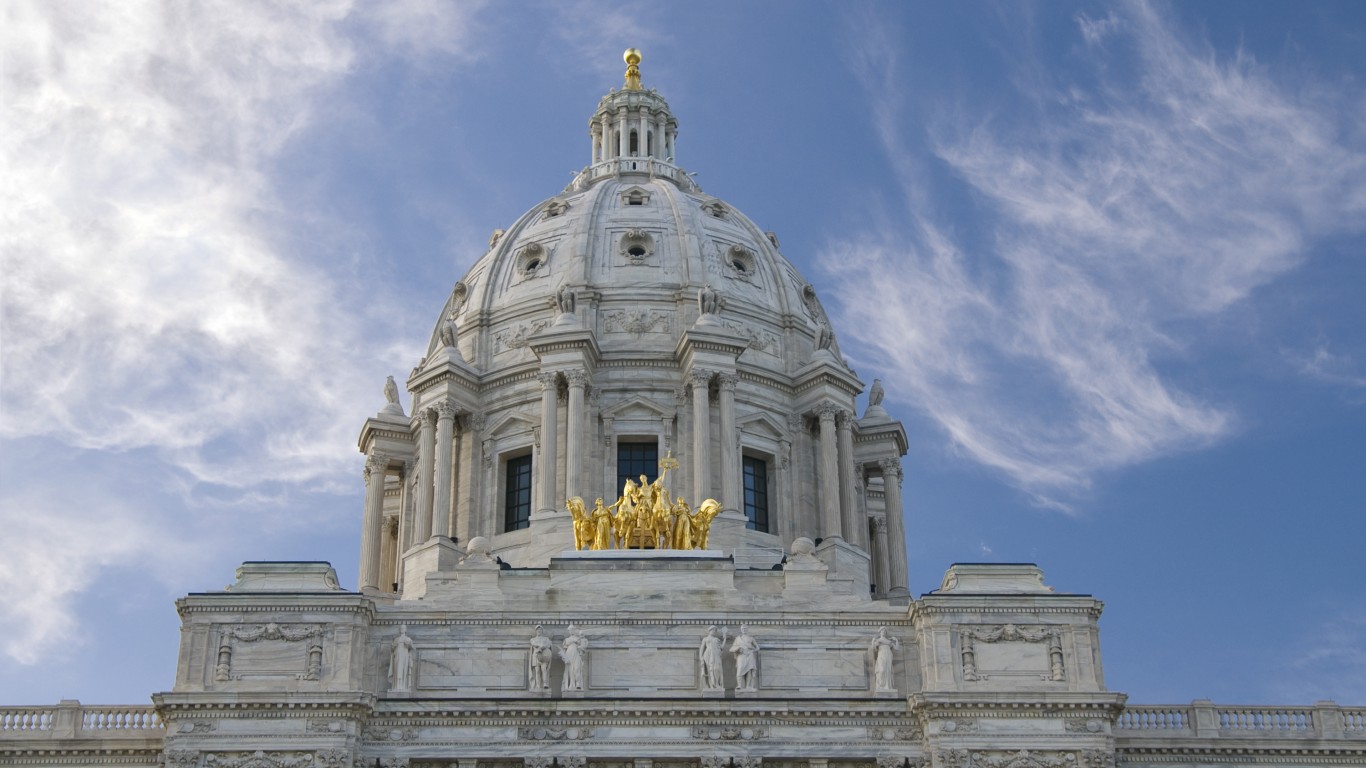
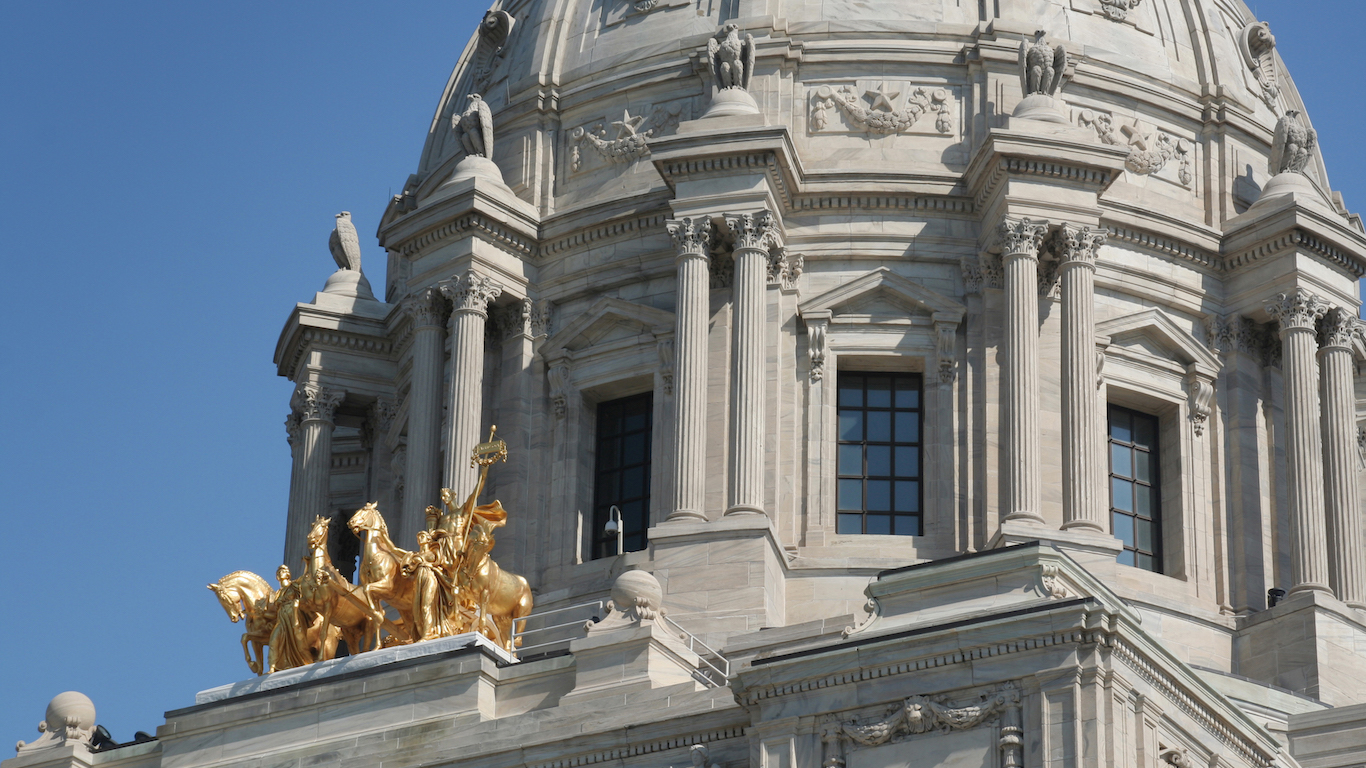
14. Minnesota
> State & local gov’t. spending per capita: $11,886
> State & local tax collections per capita: $4,590 (3rd highest)
> State & local gov’t. employees: 13.3% of workforce (20th lowest)
> Median household income: $68,388 (12th highest)
[recirclink id=510120]

13. Washington
> State & local gov’t. spending per capita: $11,921
> State & local tax collections per capita: $3,240 (12th highest)
> State & local gov’t. employees: 14.6% of workforce (19th highest)
> Median household income: $70,979 (10th highest)

12. Delaware
> State & local gov’t. spending per capita: $11,989
> State & local tax collections per capita: $3,731 (9th highest)
> State & local gov’t. employees: 13.2% of workforce (19th lowest)
> Median household income: $62,852 (17th highest)
[in-text-ad-2]

11. Nebraska
> State & local gov’t. spending per capita: $12,098
> State & local tax collections per capita: $2,658 (22nd lowest)
> State & local gov’t. employees: 15.3% of workforce (14th highest)
> Median household income: $59,970 (21st highest)

10. Oregon
> State & local gov’t. spending per capita: $12,130
> State & local tax collections per capita: $2,876 (21st highest)
> State & local gov’t. employees: 13.9% of workforce (25th highest)
> Median household income: $60,212 (20th highest)
[in-text-ad]

9. New Jersey
> State & local gov’t. spending per capita: $12,272
> State & local tax collections per capita: $3,590 (10th highest)
> State & local gov’t. employees: 13.2% of workforce (18th lowest)
> Median household income: $80,088 (2nd highest)
[recirclink id=538799]

8. Vermont
> State & local gov’t. spending per capita: $12,448
> State & local tax collections per capita: $5,015 (the highest)
> State & local gov’t. employees: 15.6% of workforce (11th highest)
> Median household income: $57,513 (24th lowest)

7. Connecticut
> State & local gov’t. spending per capita: $12,764
> State & local tax collections per capita: $4,555 (5th highest)
> State & local gov’t. employees: 12.9% of workforce (14th lowest)
> Median household income: $74,168 (5th highest)
[in-text-ad-2]

6. Massachusetts
> State & local gov’t. spending per capita: $13,148
> State & local tax collections per capita: $4,012 (7th highest)
> State & local gov’t. employees: 11.2% of workforce (5th lowest)
> Median household income: $77,385 (4th highest)

5. California
> State & local gov’t. spending per capita: $13,650
> State & local tax collections per capita: $3,936 (8th highest)
> State & local gov’t. employees: 13.6% of workforce (23rd lowest)
> Median household income: $71,805 (8th highest)
[in-text-ad]

4. North Dakota
> State & local gov’t. spending per capita: $14,240
> State & local tax collections per capita: $4,587 (4th highest)
> State & local gov’t. employees: 16.8% of workforce (7th highest)
> Median household income: $61,843 (18th highest)
[recirclink id=537241]

3. New York
> State & local gov’t. spending per capita: $16,778
> State & local tax collections per capita: $4,014 (6th highest)
> State & local gov’t. employees: 14.1% of workforce (24th highest)
> Median household income: $64,894 (14th highest)

2. Wyoming
> State & local gov’t. spending per capita: $17,195
> State & local tax collections per capita: $2,847 (23rd highest)
> State & local gov’t. employees: 21.1% of workforce (the highest)
> Median household income: $60,434 (19th highest)
[in-text-ad-2]

1. Alaska
> State & local gov’t. spending per capita: $21,309
> State & local tax collections per capita: $1,608 (the lowest)
> State & local gov’t. employees: 19.8% of workforce (2nd highest)
> Median household income: $73,181 (7th highest)
Methodology
To identify what your state spends on you, 24/7 Wall St. reviewed per-capita state and local government expenditure figures from the U.S. Census Bureau’s 2016 State and Local Government Expenditures data, which includes data from its Surveys of State & Local Government Finances, Public Employment & Payroll, and the Annual Estimates of the Resident Population for the United States Regions, States, and Puerto Rico. State poverty rates are from the U.S. Census Bureau’s American Community Survey and are for 2017. State and local tax collections are from the Tax Foundation’s Facts and Figures report. The report, which was released for 2019, includes collections for the 2017 fiscal year.
Contact [email protected] for any questions or corrections.