Fastest Shrinking Place in Every State
137837832@N07 / Flickr 26. Montana: Malmstrom AFB > 2010-2017 population change: -18.5% (state: +5.8%) > Median household income: $48,787 (state: $50,801) > Annual unemployment: 1.8% (state: 3.0%) > Total population: 3,929 shannonpatrick17 / Flickr 27. Nebraska: Fairbury > 2010-2017 population…

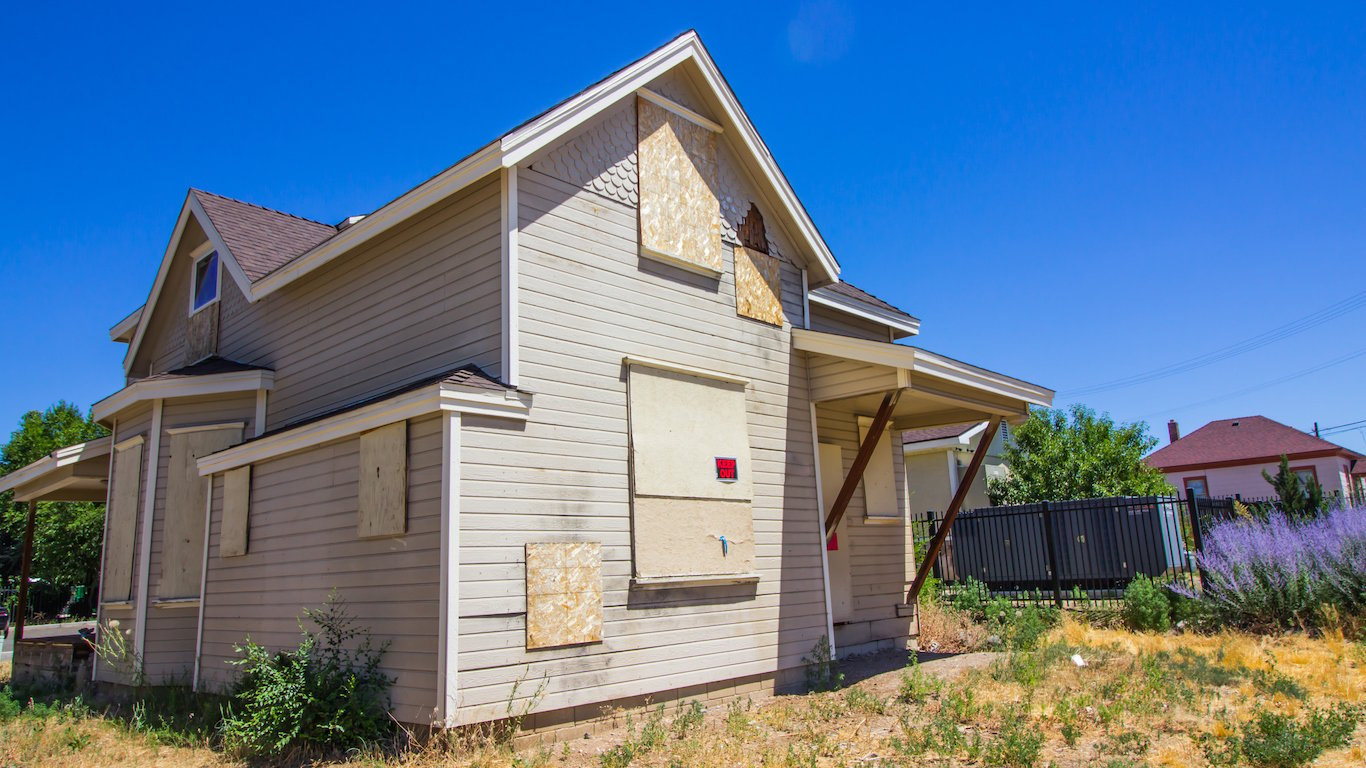
U.S. population growth slowed to just 0.6% in 2018 — the lowest growth rate in 80 years. The last time the annual population growth was this low, the nation was in the throes of the Great Depression, when job opportunities were limited and there was little optimism about the future.
While the national population growth just hit a historic low, there are towns and cities across the country where even a small 0.6% population bump would be a welcome change. In these places, population decline has been a defining demographic trend for years.
24/7 Wall St. reviewed population changes between 2010 and 2017 in nearly 15,000 cities, towns, villages, and Census designated places to identify the fastest shrinking place in every state. We only considered areas with populations of at least 1,000. To ensure accuracy, we did not consider places where the margin of error for population was greater than 10%. All data are five-year estimates from the U.S. Census Bureau’s American Community Survey.
National population growth is slowing primarily because the country’s population is aging. This also appears to be a factor in many of the cities and towns on this list.
In the fastest shrinking town in 38 states, the median age exceeds the national median of 37.8 years. Similarly, in the vast majority of places on this list, the share of residents 65 and older is greater than the comparable share statewide. While these places tend to have large shares of retirement-age residents, they are not necessarily the places with the oldest populations in their state. These are the oldest counties in every state.
Just like during the Great Depression, when population growth slowed nationwide, in many of these areas, economic conditions are lagging. In the majority of cities and towns on this list, the median household income is lower than it is across their respective state as a whole. This is in stark contrast to the fastest growing place in every state — which tend to be relatively affluent areas.
Click here to see the fastest shrinking place in every state
Click here to see the fastest growing place in every state
Click here to read our methodology

1. Alabama: Tuskegee
> 2010-2017 population change: -13.1% (state: +2.9%)
> Median household income: $27,314 (state: $46,472)
> Annual unemployment: 10.1% (state: 4.3%)
> Total population: 8,852

2. Alaska: Valdez
> 2010-2017 population change: -0.4% (state: +6.9%)
> Median household income: $94,003 (state: $76,114)
> Annual unemployment: 6.5% (state: 5.2%)
> Total population: 3,921
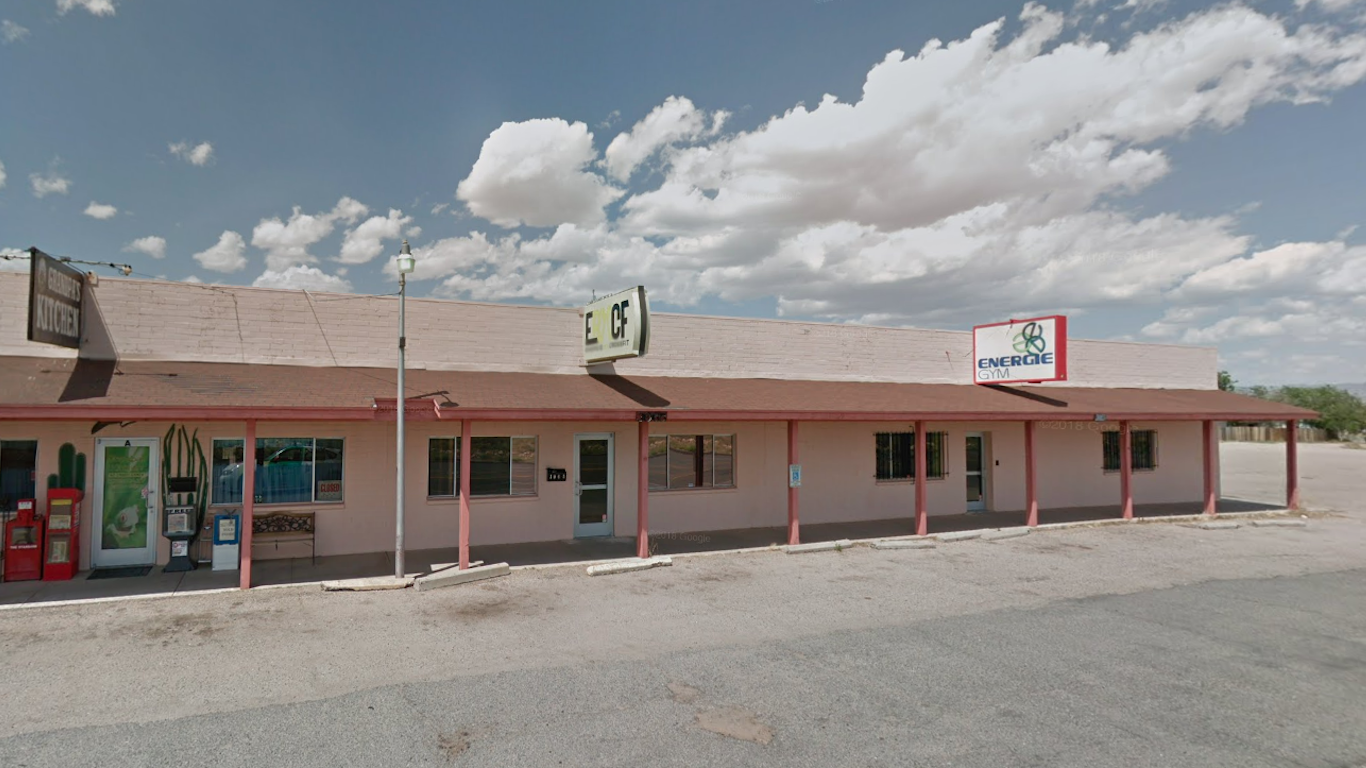
3. Arizona: New Kingman-Butler
> 2010-2017 population change: -9.9% (state: +9.0%)
> Median household income: $31,923 (state: $53,510)
> Annual unemployment: 9.3% (state: 4.2%)
> Total population: 13,060
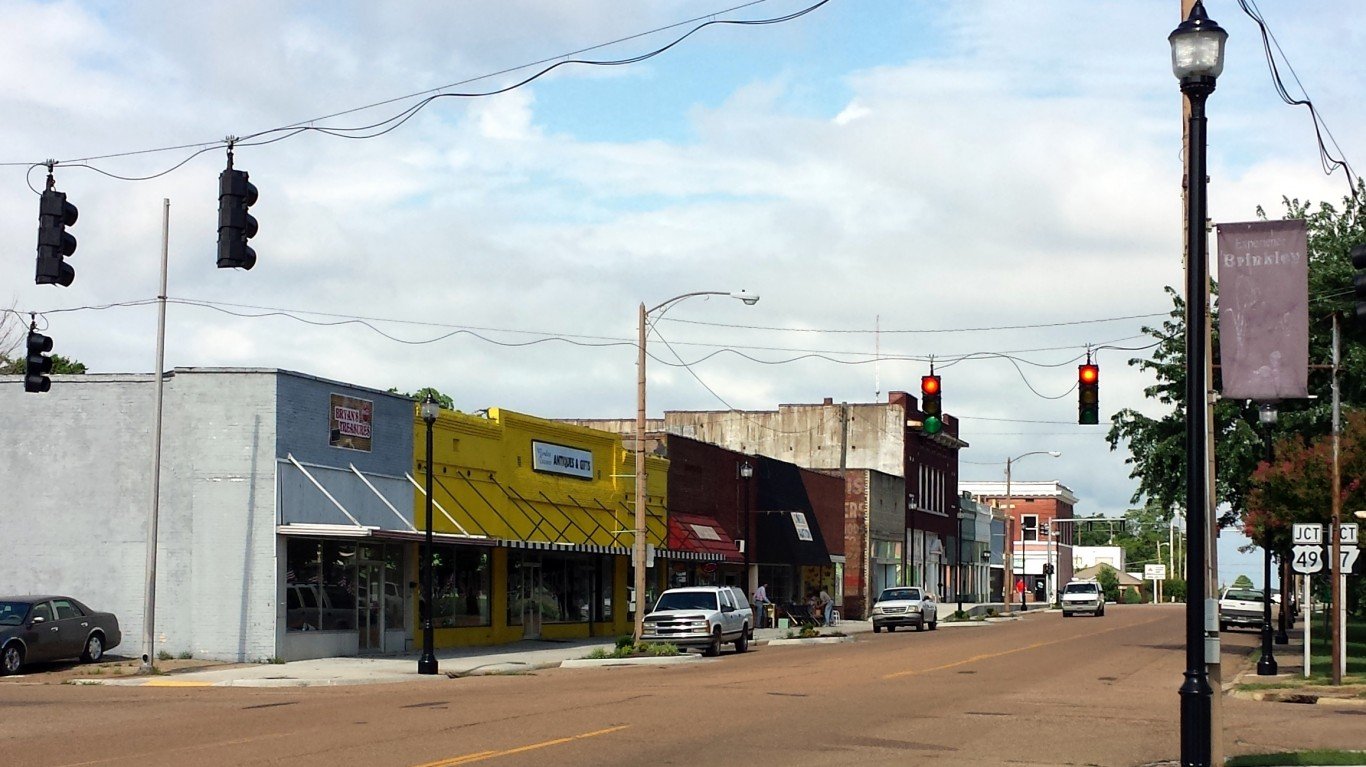
4. Arkansas: Brinkley
> 2010-2017 population change: -14.1% (state: +3.7%)
> Median household income: $31,694 (state: $43,813)
> Annual unemployment: 5.5% (state: 3.6%)
> Total population: 2,854

5. California: Willowbrook
> 2010-2017 population change: -35.6% (state: +6.4%)
> Median household income: $40,279 (state: $67,169)
> Annual unemployment: 7.3% (state: 4.8%)
> Total population: 22,654

6. Colorado: Air Force Academy
> 2010-2017 population change: -26.1% (state: +11.2%)
> Median household income: $70,179 (state: $65,458)
> Annual unemployment: 0.3% (state: 3.5%)
> Total population: 6,098
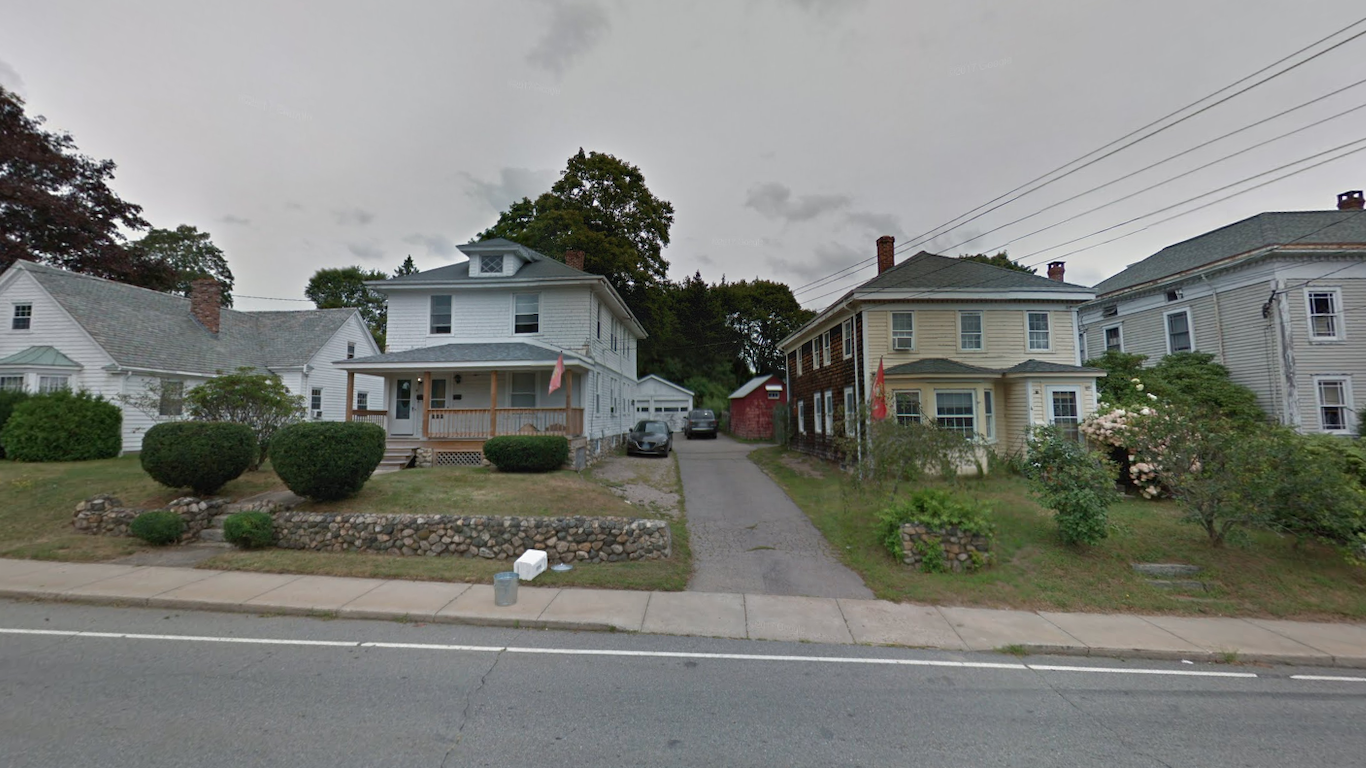
7. Connecticut: Pawcatuck
> 2010-2017 population change: -13.8% (state: +1.4%)
> Median household income: $57,780 (state: $73,781)
> Annual unemployment: 5.2% (state: 4.8%)
> Total population: 4,999
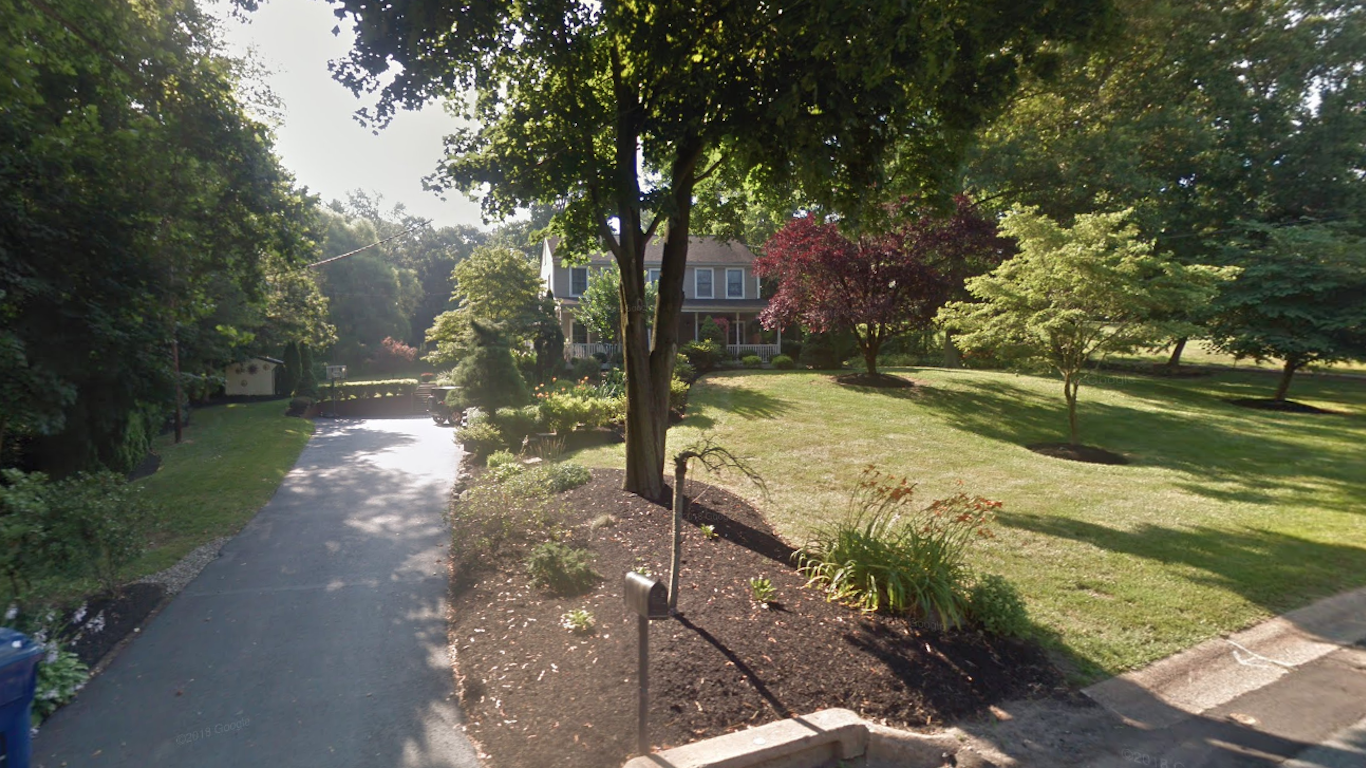
8. Delaware: North Star
> 2010-2017 population change: -6.8% (state: +7.1%)
> Median household income: $141,618 (state: $63,036)
> Annual unemployment: 1.3% (state: 4.0%)
> Total population: 7,390
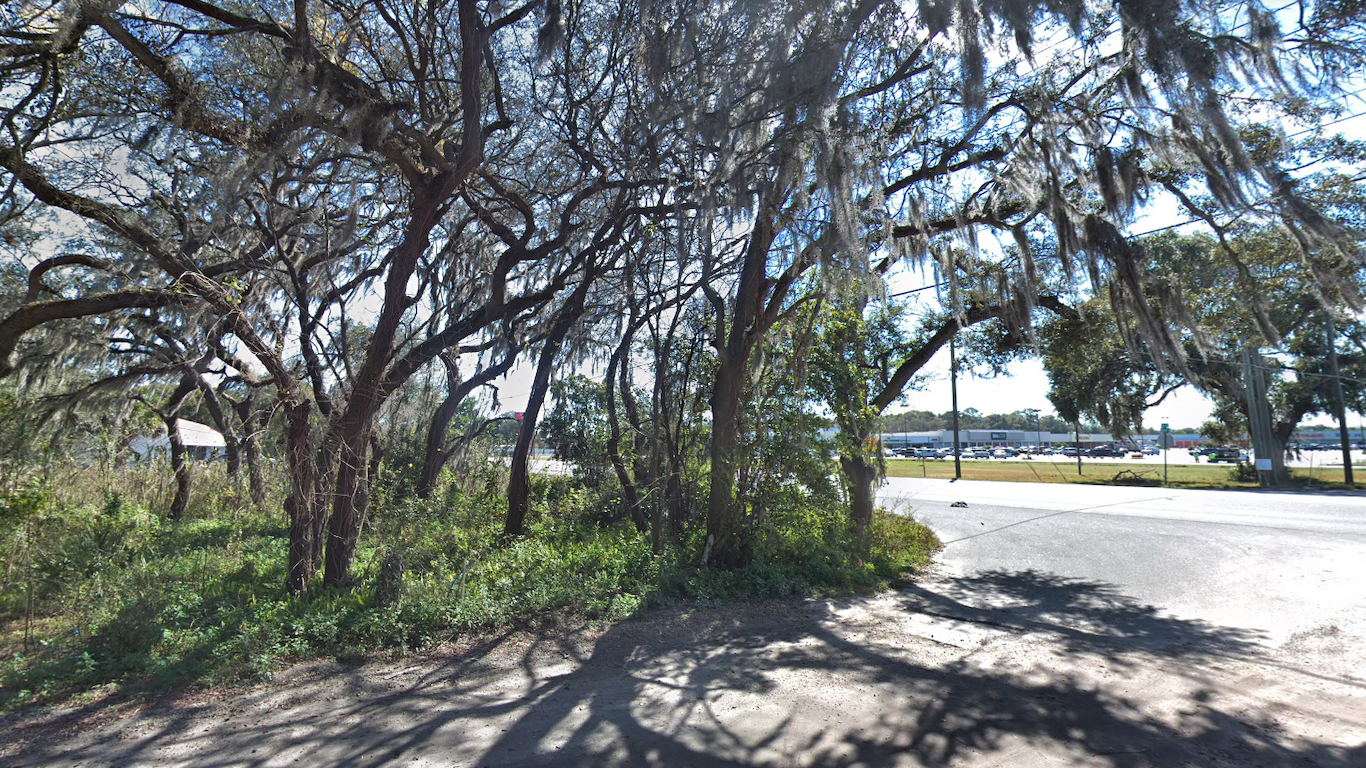
9. Florida: Zephyrhills West
> 2010-2017 population change: -19.2% (state: +9.5%)
> Median household income: $33,558 (state: $50,883)
> Annual unemployment: 3.1% (state: 4.2%)
> Total population: 4,734

10. Georgia: Reidsville
> 2010-2017 population change: -38.2% (state: +7.7%)
> Median household income: $24,500 (state: $52,977)
> Annual unemployment: 1.6% (state: 4.7%)
> Total population: 2,652
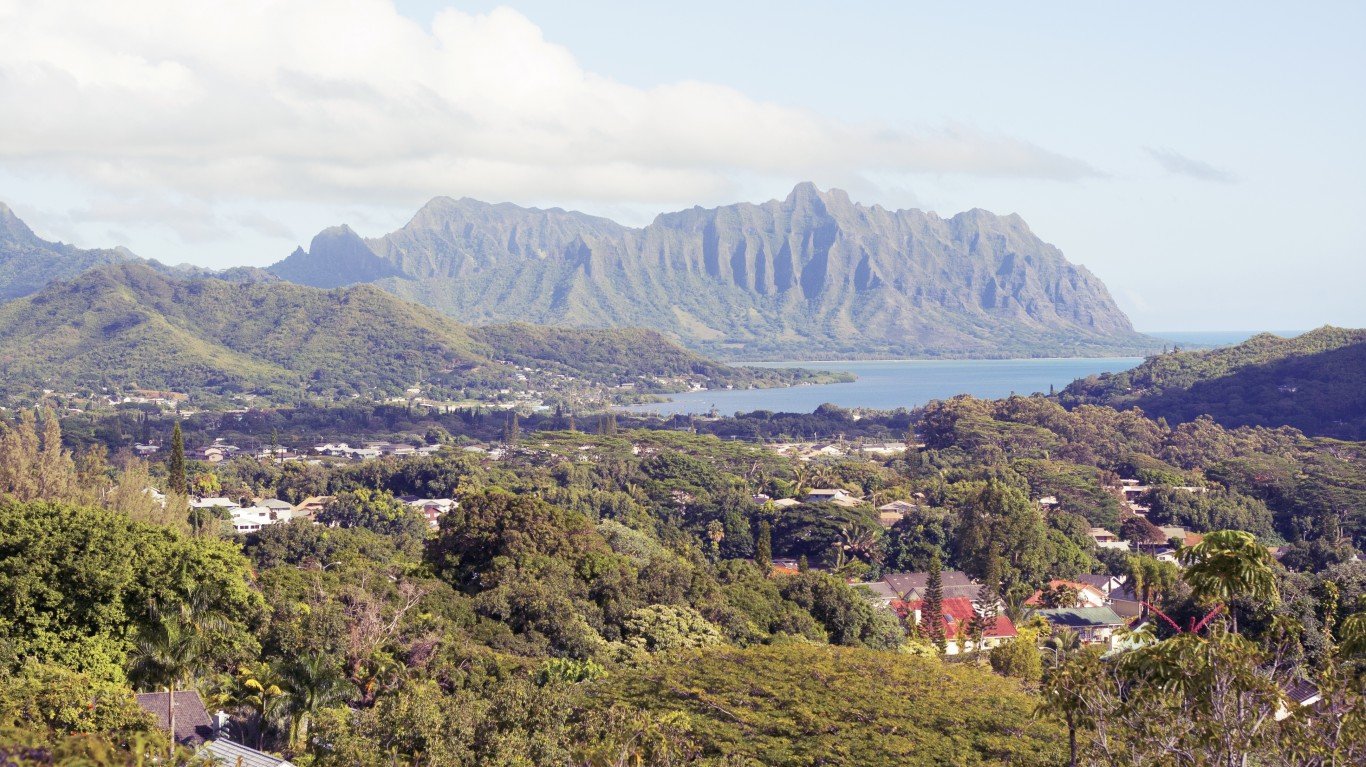
11. Hawaii: Ahuimanu
> 2010-2017 population change: -17.2% (state: +6.6%)
> Median household income: $103,825 (state: $74,923)
> Annual unemployment: 2.8% (state: 3.0%)
> Total population: 8,085

12. Idaho: Kamiah
> 2010-2017 population change: -12.3% (state: +8.6%)
> Median household income: $36,905 (state: $50,985)
> Annual unemployment: 5.3% (state: 3.3%)
> Total population: 1,267

13. Illinois: Mount Carroll
> 2010-2017 population change: -19.1% (state: +0.9%)
> Median household income: $42,404 (state: $61,229)
> Annual unemployment: 3% (state: 4.8%)
> Total population: 1,475
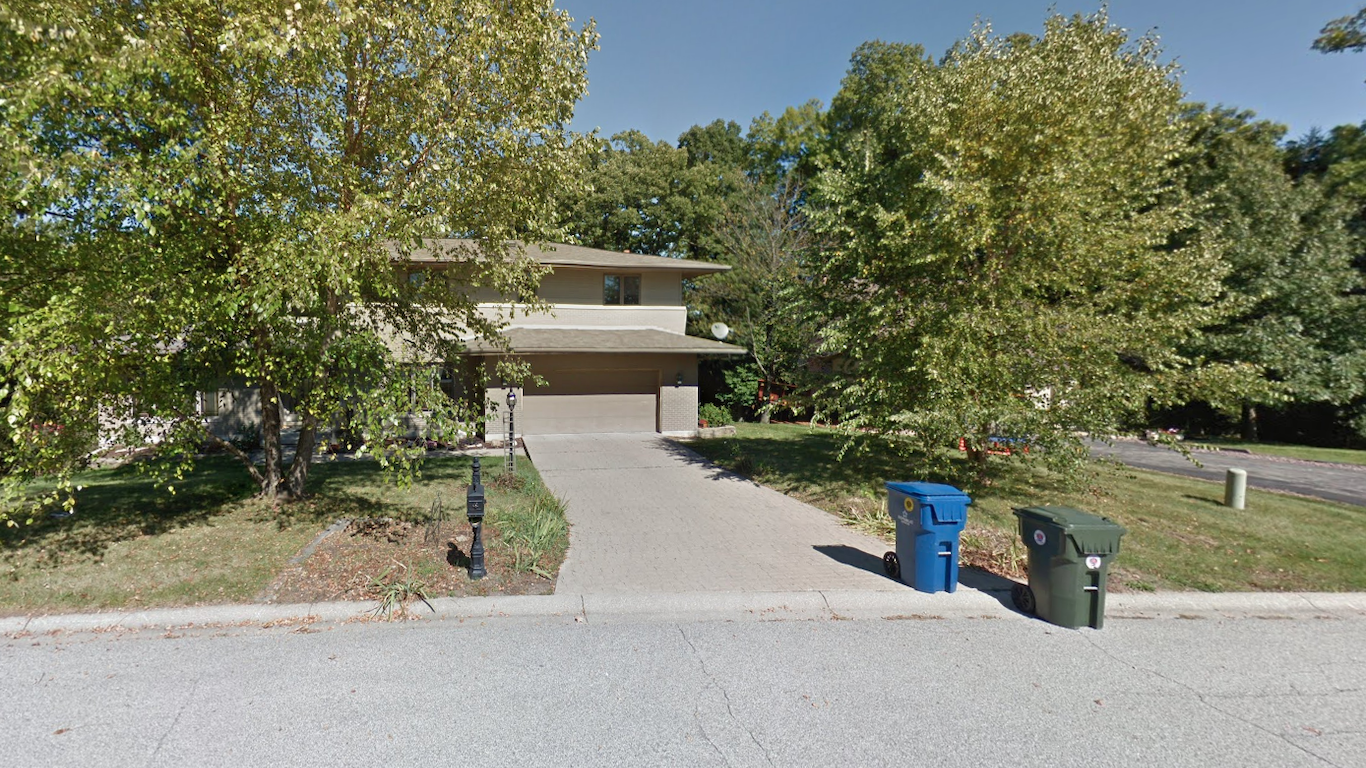
14. Indiana: Shorewood Forest
> 2010-2017 population change: -16.7% (state: +3.1%)
> Median household income: $102,950 (state: $52,182)
> Annual unemployment: 1% (state: 3.9%)
> Total population: 2,512

15. Iowa: Reinbeck
> 2010-2017 population change: -17.1% (state: +3.4%)
> Median household income: $59,453 (state: $56,570)
> Annual unemployment: 4% (state: 2.8%)
> Total population: 1,628

16. Kansas: Belleville
> 2010-2017 population change: -15.9% (state: +0.9%)
> Median household income: $42,406 (state: $61,229)
> Annual unemployment: 4.5% (state: 4.8%)
> Total population: 42,283

17. Kentucky: Fort Knox
> 2010-2017 population change: -23.8% (state: +3.2%)
> Median household income: $55,196 (state: $46,535)
> Annual unemployment: 1.6% (state: 4.0%)
> Total population: 9,092
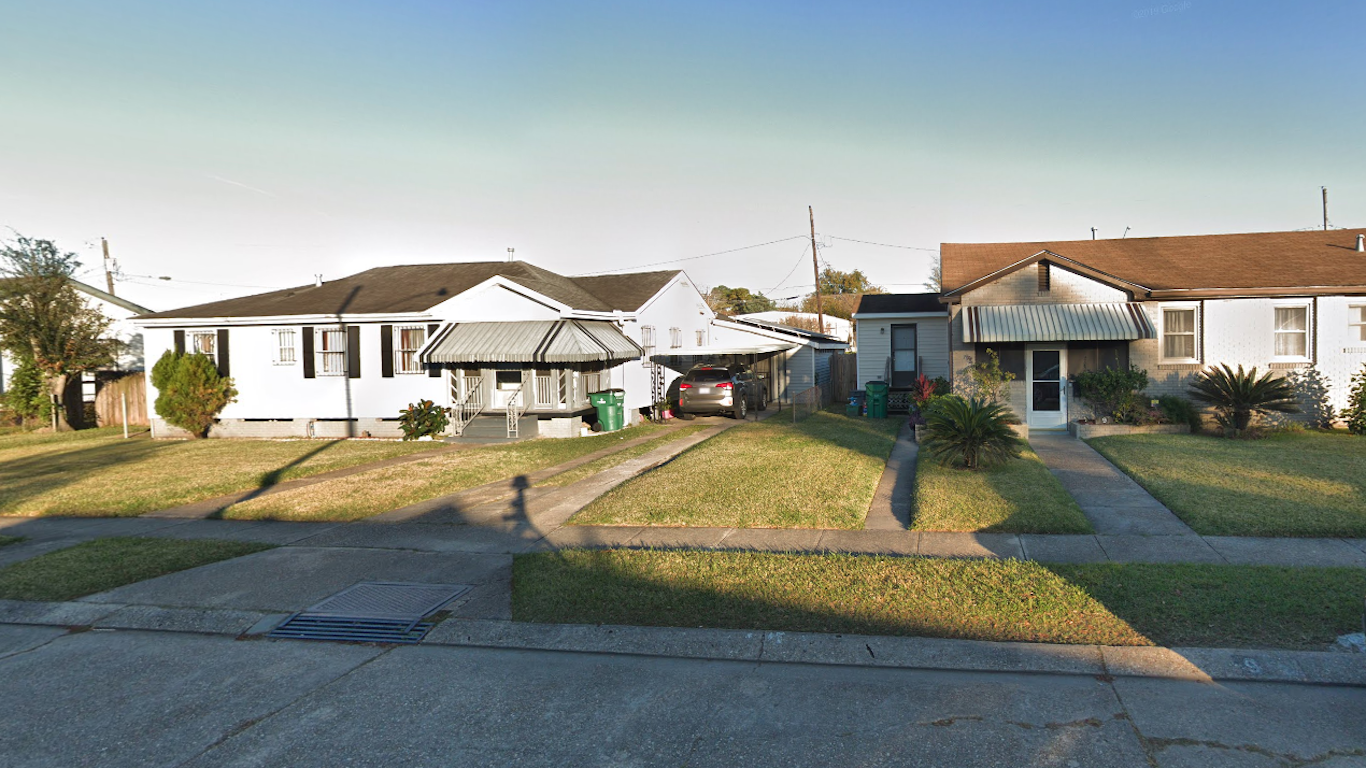
18. Louisiana: Jefferson
> 2010-2017 population change: -13.1% (state: +5.3%)
> Median household income: $46,199 (state: $46,710)
> Annual unemployment: 3.8% (state: 4.3%)
> Total population: 10,469

19. Maine: Madawaska
> 2010-2017 population change: -18.4% (state: +0.2%)
> Median household income: $37,753 (state: $53,024)
> Annual unemployment: 0% (state: 3.3%)
> Total population: 2,816
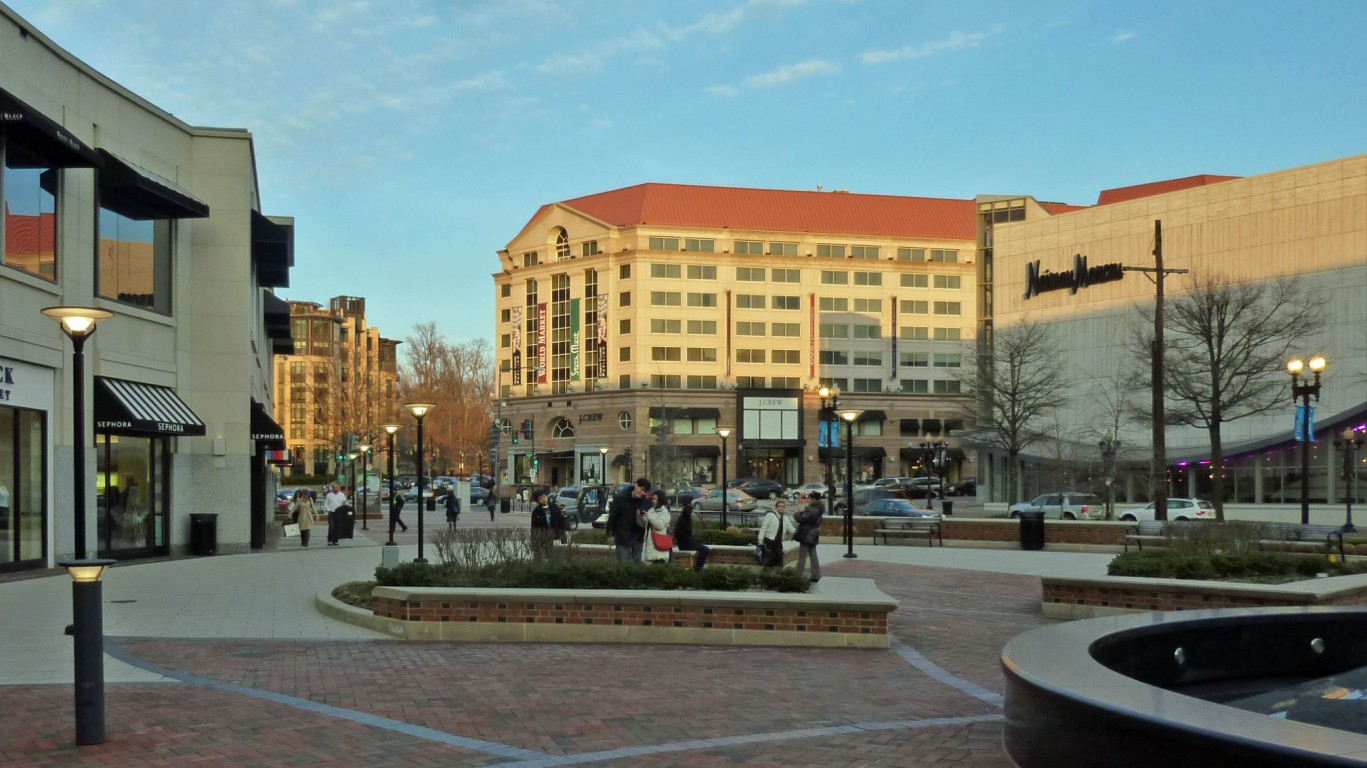
20. Maryland: Friendship Heights Village
> 2010-2017 population change: -12.4% (state: +5.3%)
> Median household income: $92,593 (state: $78,916)
> Annual unemployment: 2.6% (state: 4.1%)
> Total population: 5,051
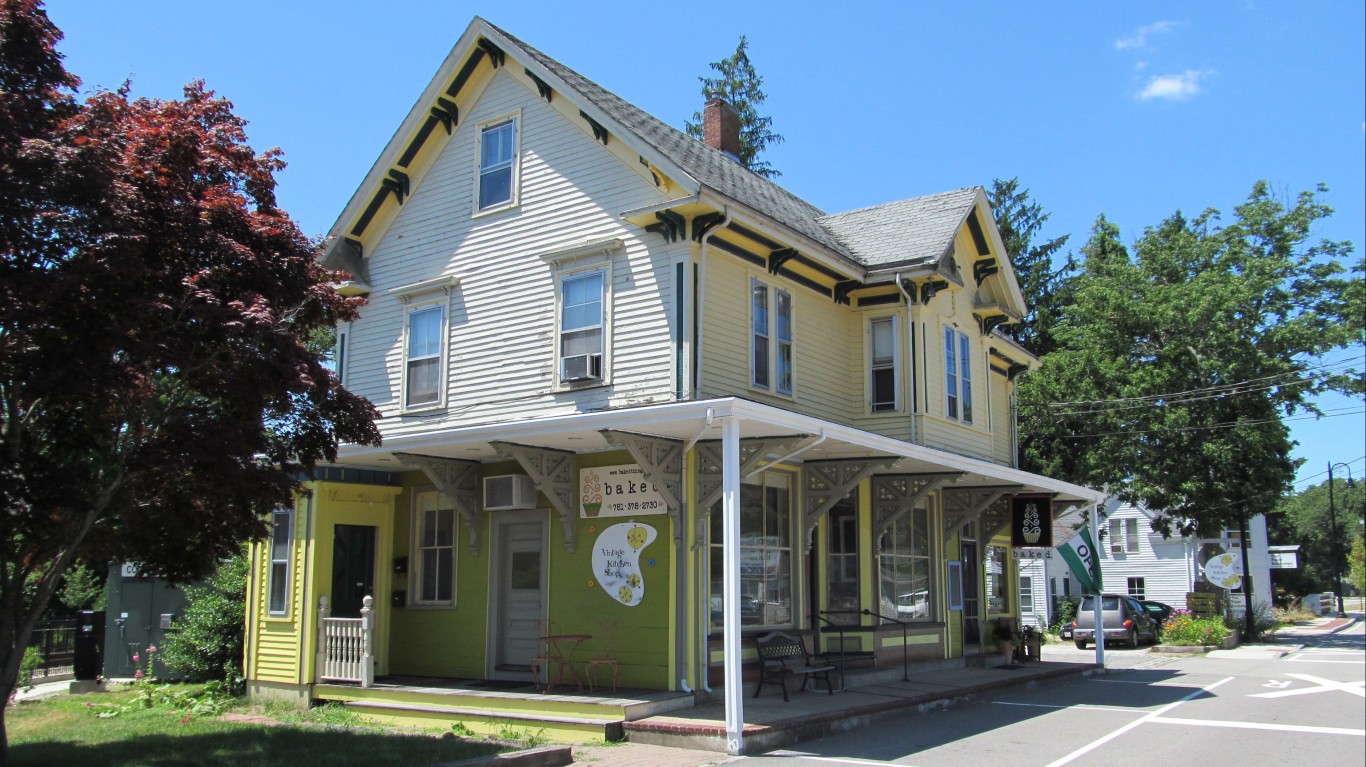
21. Massachusetts: North Scituate
> 2010-2017 population change: -11.0% (state: +4.8%)
> Median household income: $104,159 (state: $74,167)
> Annual unemployment: 4% (state: 4.0%)
> Total population: 4,890
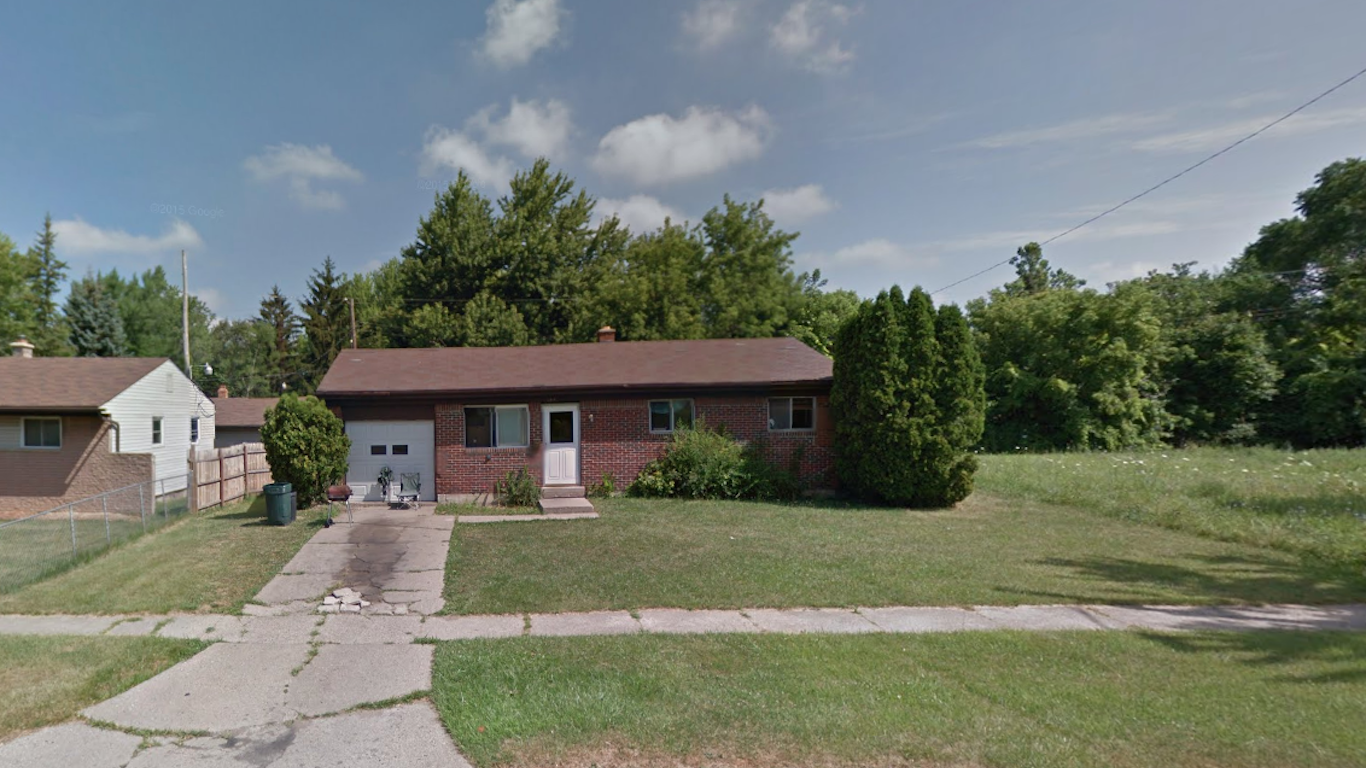
22. Michigan: Beecher
> 2010-2017 population change: -19.9% (state: -0.3%)
> Median household income: $23,856 (state: $52,668)
> Annual unemployment: 11.3% (state: 4.5%)
> Total population: 9,490
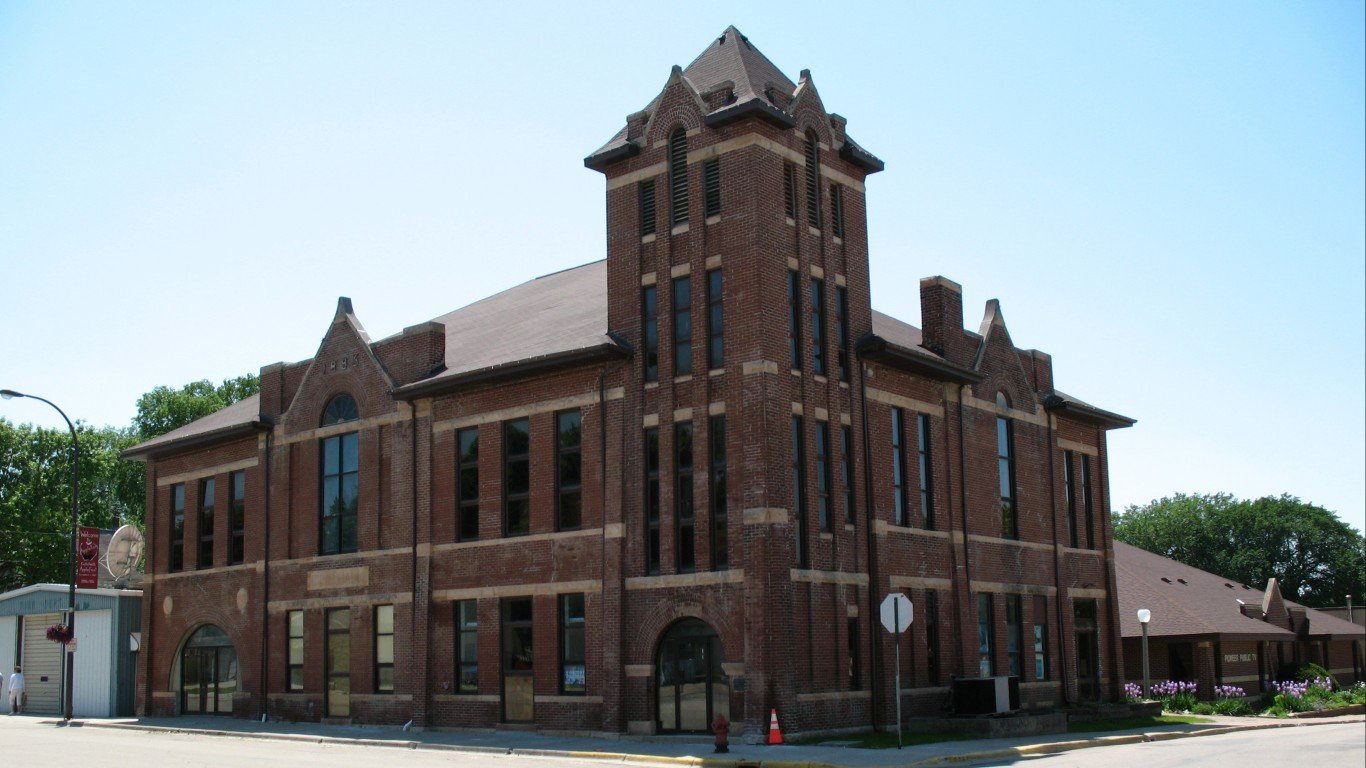
23. Minnesota: Appleton
> 2010-2017 population change: -33.5% (state: +4.7%)
> Median household income: $35,300 (state: $65,699)
> Annual unemployment: 5.6% (state: 3.0%)
> Total population: 1,449
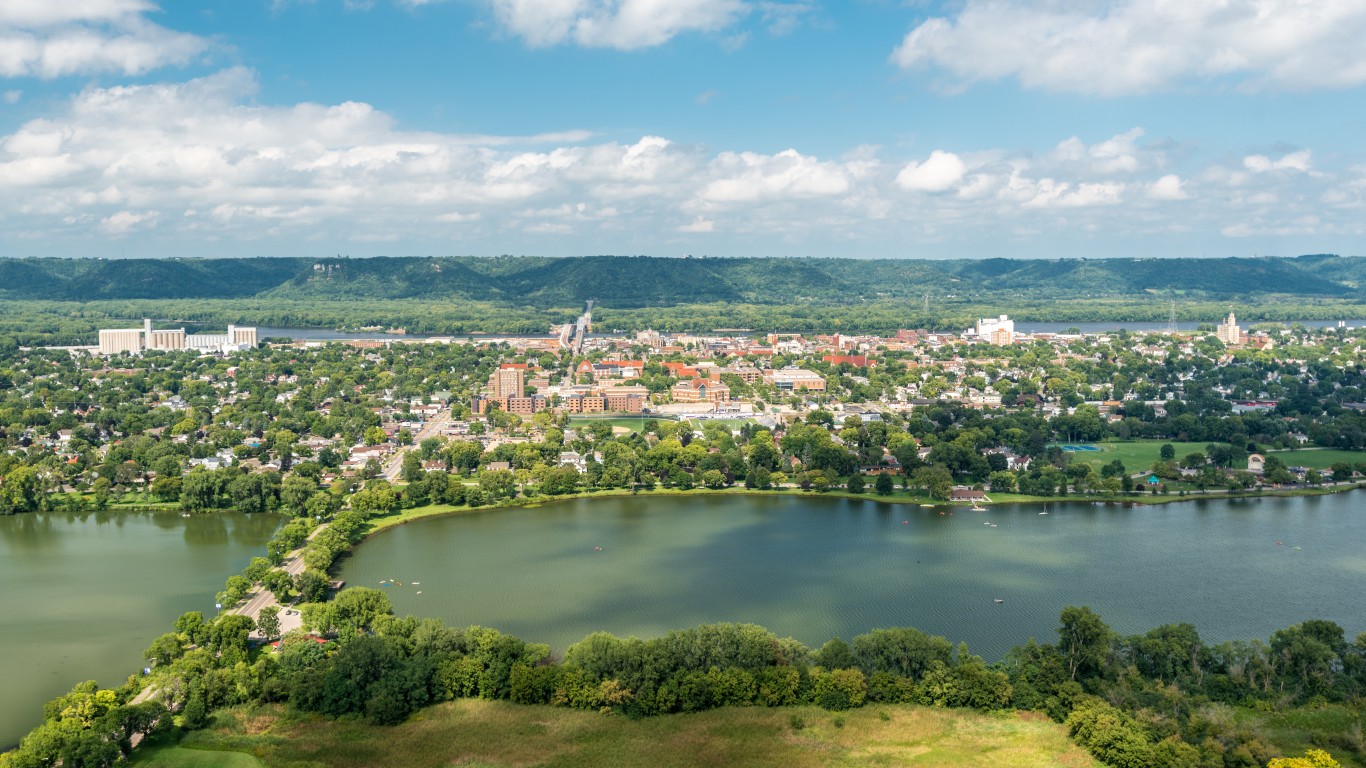
24. Mississippi: Winona
> 2010-2017 population change: -12.3% (state: +4.7%)
> Median household income: $43,551 (state: $65,699)
> Annual unemployment: 4.8% (state: 3.0%)
> Total population: 27,153
25. Missouri: Spanish Lake
> 2010-2017 population change: -15.1% (state: +2.6%)
> Median household income: $37,929 (state: $51,542)
> Annual unemployment: 10.6% (state: 3.6%)
> Total population: 18,511
26. Montana: Malmstrom AFB
> 2010-2017 population change: -18.5% (state: +5.8%)
> Median household income: $48,787 (state: $50,801)
> Annual unemployment: 1.8% (state: 3.0%)
> Total population: 3,929

27. Nebraska: Fairbury
> 2010-2017 population change: -6.3% (state: +0.9%)
> Median household income: $42,808 (state: $61,229)
> Annual unemployment: 3.2% (state: 4.8%)
> Total population: 3,558
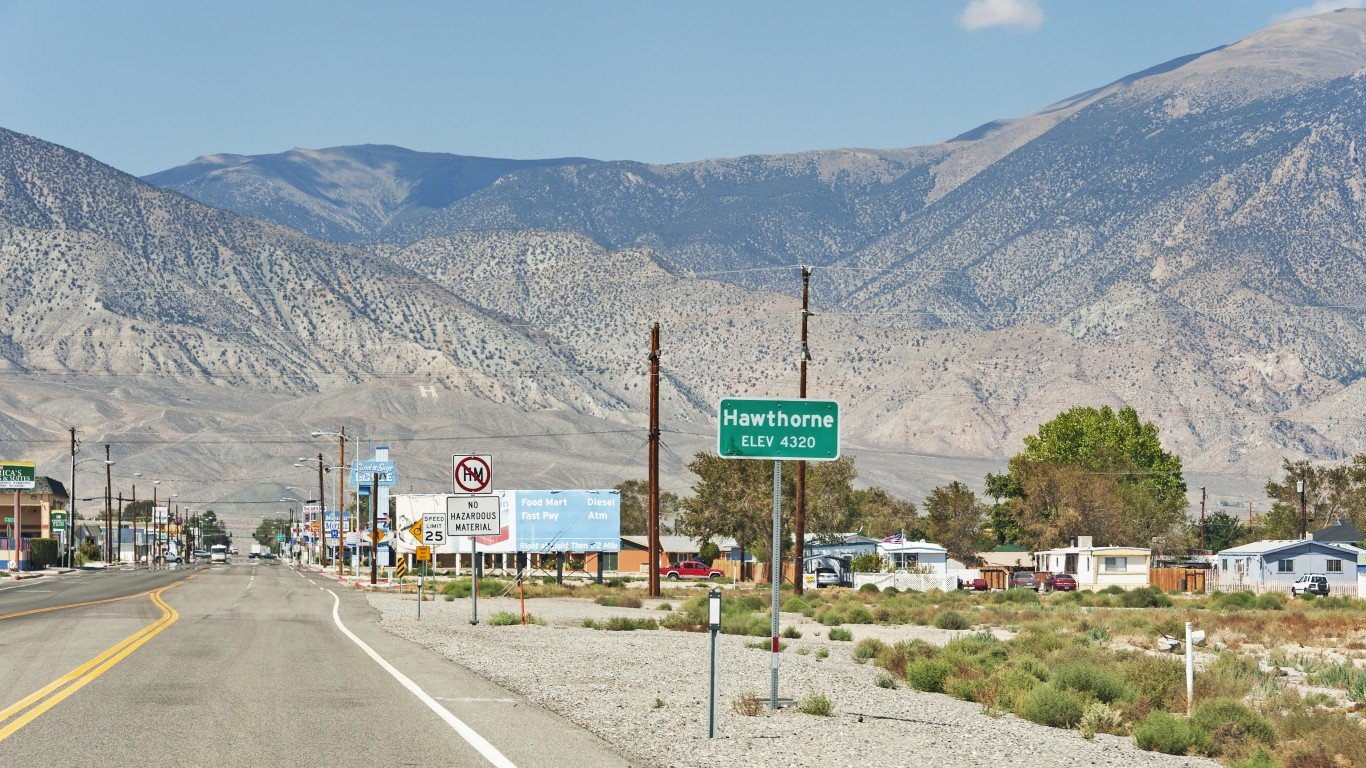
28. Nevada: Hawthorne
> 2010-2017 population change: -26.1% (state: +9.7%)
> Median household income: $42,250 (state: $55,434)
> Annual unemployment: 11.4% (state: 5.1%)
> Total population: 2,689
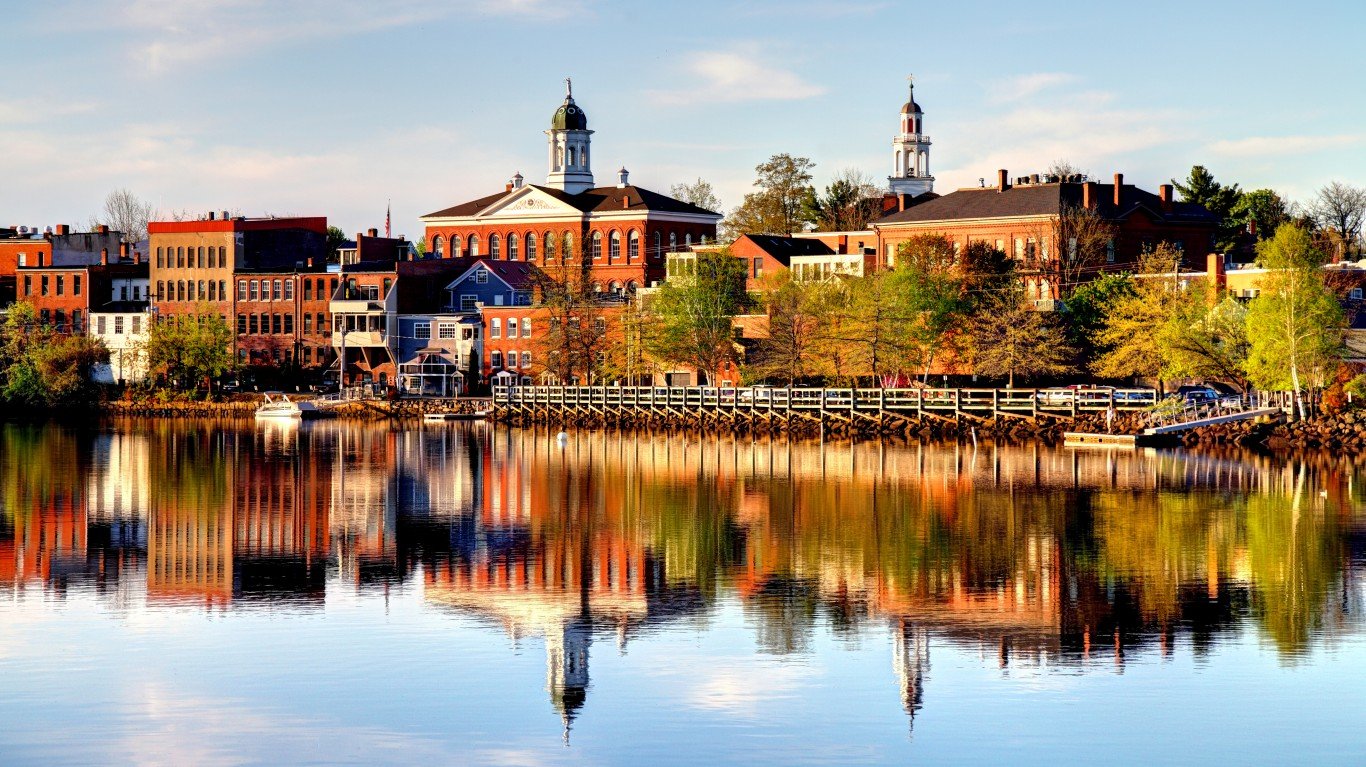
29. New Hampshire: Exeter
> 2010-2017 population change: -3.4% (state: +1.4%)
> Median household income: $66,412 (state: $71,305)
> Annual unemployment: 3.2% (state: 3.0%)
> Total population: 9,130
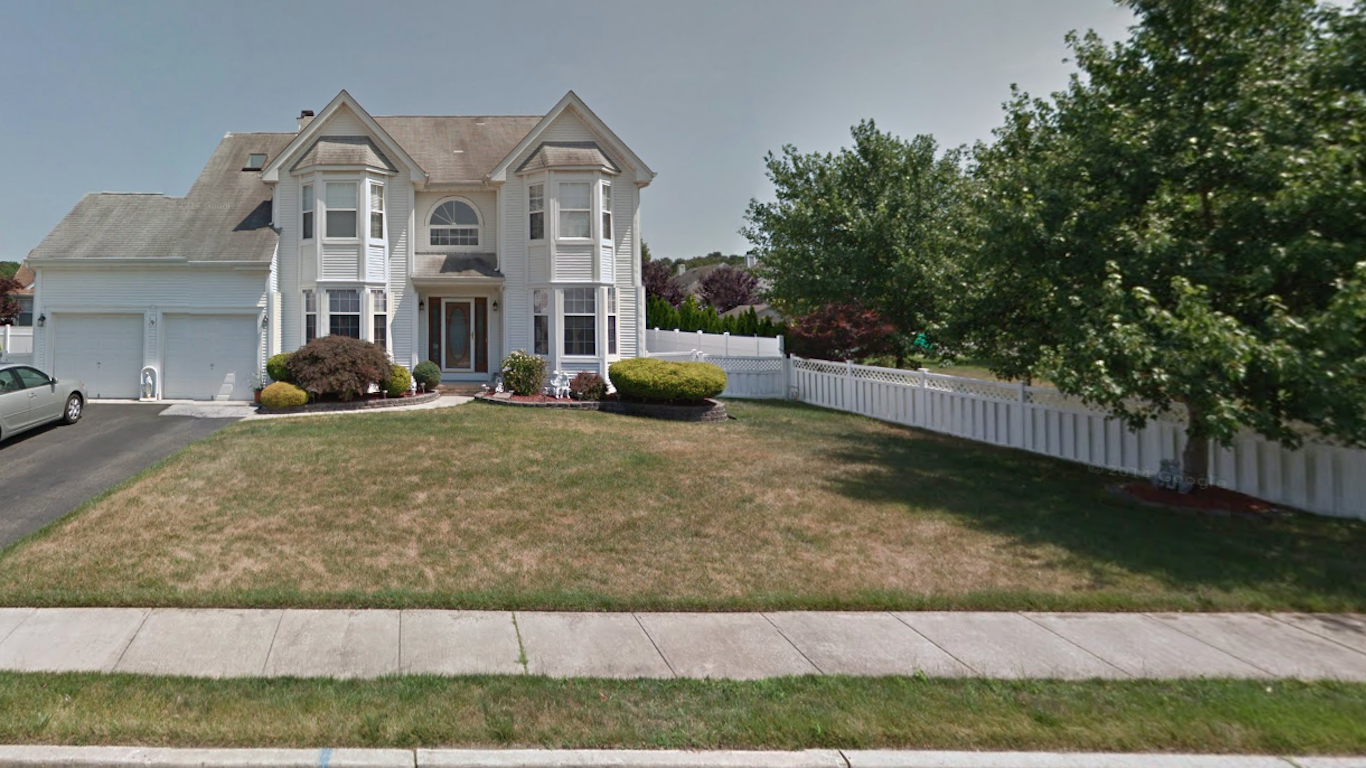
30. New Jersey: Leisure Village East
> 2010-2017 population change: -24.4% (state: +2.7%)
> Median household income: $43,915 (state: $76,475)
> Annual unemployment: 3.6% (state: 4.6%)
> Total population: 3,526

31. New Mexico: Nambe
> 2010-2017 population change: -11.4% (state: +3.6%)
> Median household income: $45,750 (state: $46,718)
> Annual unemployment: 4.1% (state: 4.5%)
> Total population: 1,876
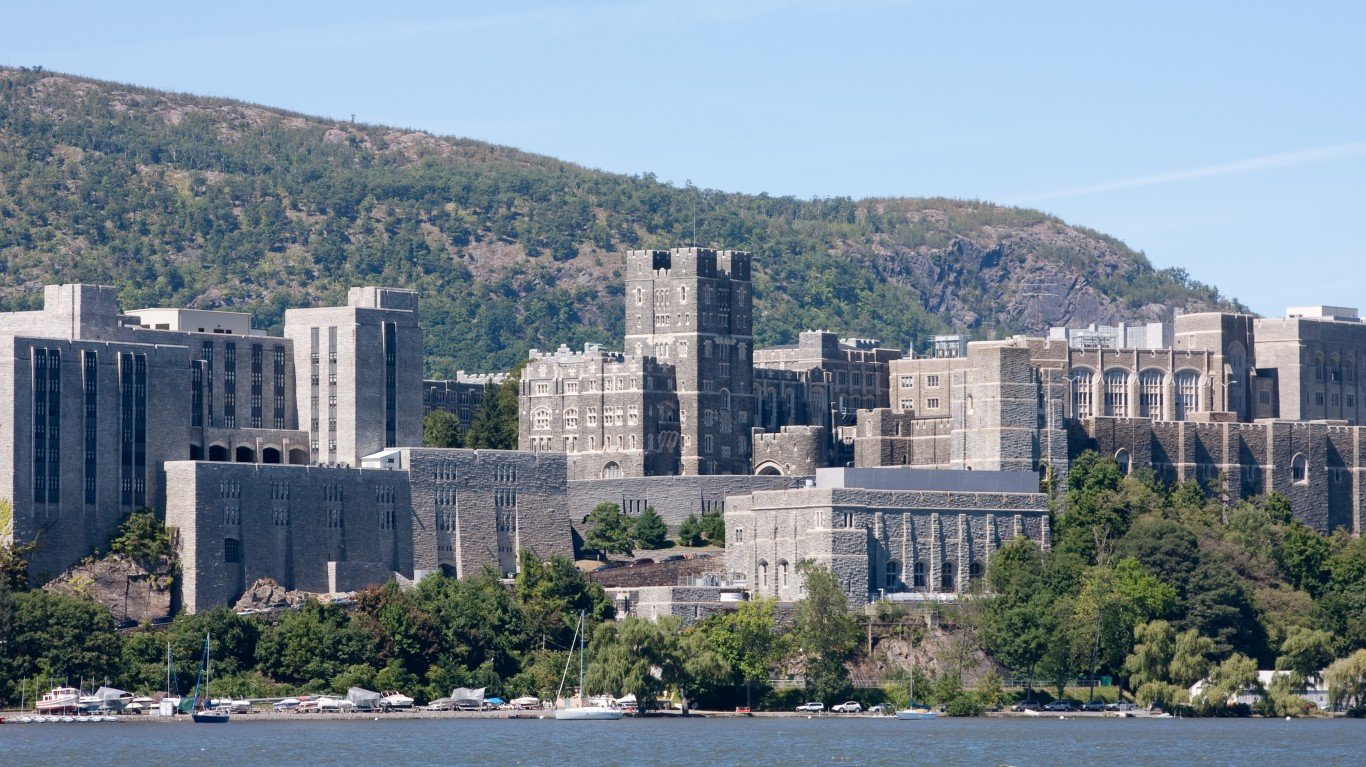
32. New York: West Point
> 2010-2017 population change: -30.8% (state: +3.0%)
> Median household income: $100,039 (state: $62,765)
> Annual unemployment: 0.5% (state: 4.3%)
> Total population: 6,536

33. North Carolina: Plymouth
> 2010-2017 population change: -8.0% (state: +8.4%)
> Median household income: $18,314 (state: $50,320)
> Annual unemployment: 4.5% (state: 4.4%)
> Total population: 3,599

34. North Dakota: Carrington
> 2010-2017 population change: -9.5% (state: +13.0%)
> Median household income: $54,722 (state: $61,285)
> Annual unemployment: 0.1% (state: 1.9%)
> Total population: 1,923
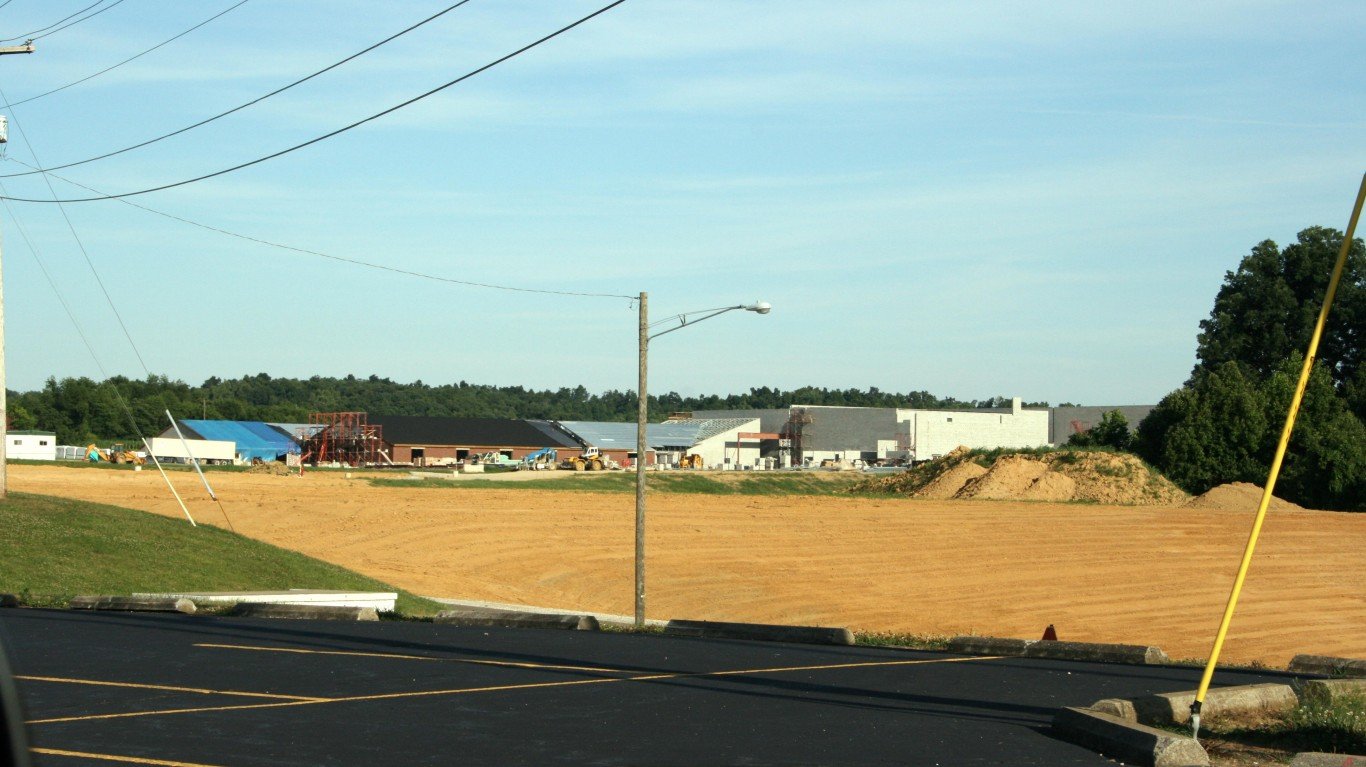
35. Ohio: Wheelersburg
> 2010-2017 population change: -12.9% (state: +0.8%)
> Median household income: $52,500 (state: $52,407)
> Annual unemployment: 2% (state: 4.1%)
> Total population: 6,183

36. Oklahoma: Watonga
> 2010-2017 population change: -42.9% (state: +6.0%)
> Median household income: $51,891 (state: $49,767)
> Annual unemployment: 1.2% (state: 3.5%)
> Total population: 2,932

37. Oregon: Altamont
> 2010-2017 population change: -6.9% (state: +7.0%)
> Median household income: $41,048 (state: $56,119)
> Annual unemployment: 5% (state: 4.2%)
> Total population: 18,975
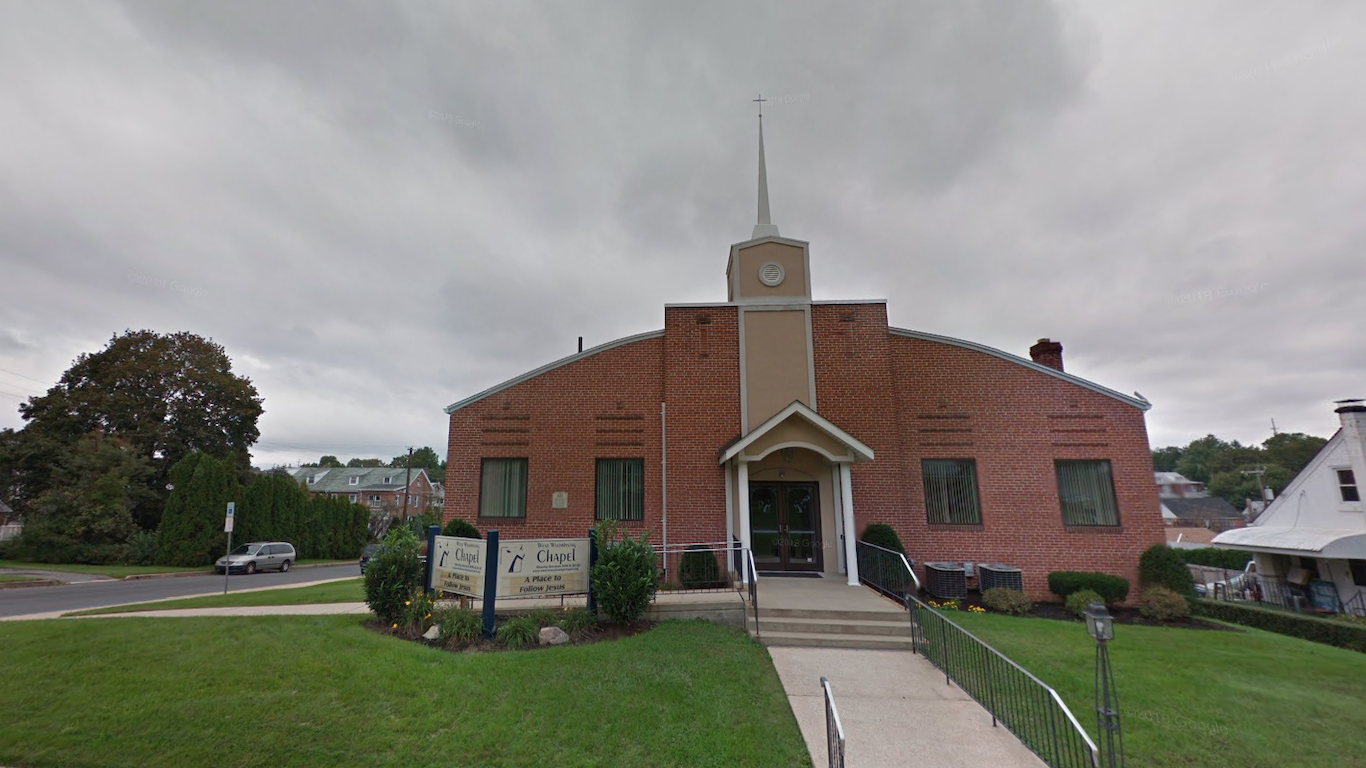
38. Pennsylvania: West Wyomissing
> 2010-2017 population change: -18.9% (state: +1.4%)
> Median household income: $62,612 (state: $56,951)
> Annual unemployment: 2.9% (state: 4.1%)
> Total population: 3,195

39. Rhode Island: Greenville
> 2010-2017 population change: -4.3% (state: +0.0%)
> Median household income: $77,219 (state: $61,043)
> Annual unemployment: 3.6% (state: 4.4%)
> Total population: 8,388

40. South Carolina: Allendale
> 2010-2017 population change: -14.0% (state: +8.5%)
> Median household income: $19,420 (state: $48,781)
> Annual unemployment: 14.8% (state: 4.3%)
> Total population: 3,120
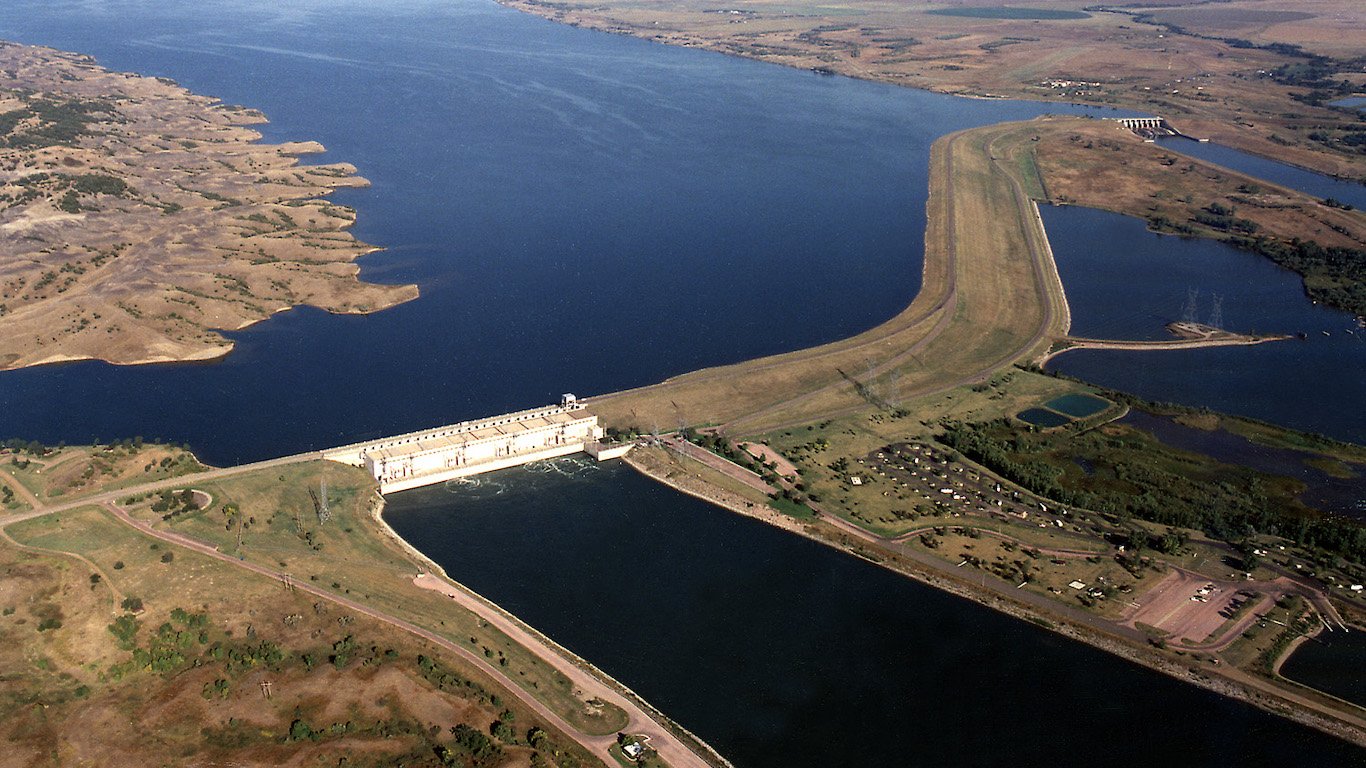
41. South Dakota: Fort Thompson
> 2010-2017 population change: -11.0% (state: +7.0%)
> Median household income: $25,125 (state: $54,126)
> Annual unemployment: 9.4% (state: 2.6%)
> Total population: 1,271
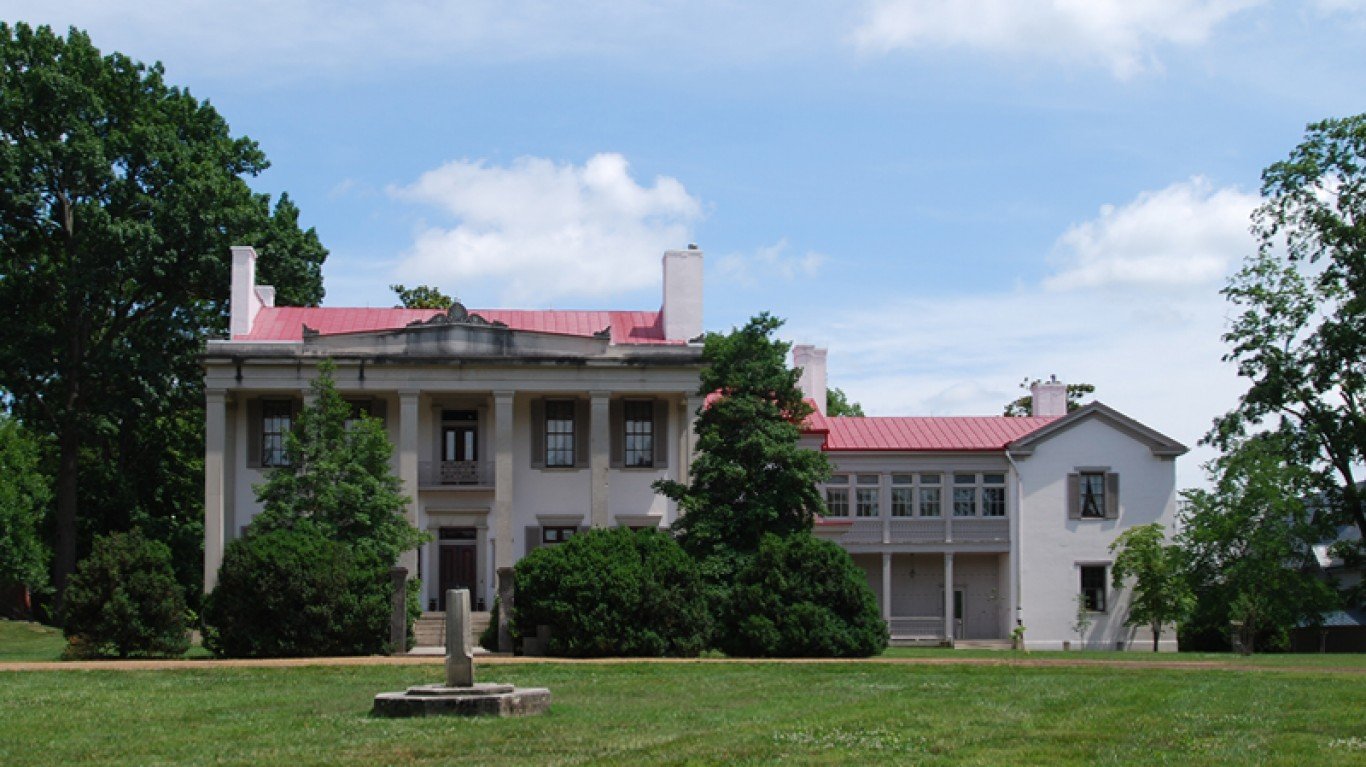
42. Tennessee: Belle Meade
> 2010-2017 population change: -10.6% (state: +5.8%)
> Median household income: $195,000 (state: $48,708)
> Annual unemployment: 0.2% (state: 4.0%)
> Total population: 2,584

43. Texas: San Elizario
> 2010-2017 population change: -35.5% (state: +12.8%)
> Median household income: $26,807 (state: $57,051)
> Annual unemployment: 6.3% (state: 3.7%)
> Total population: 9,213
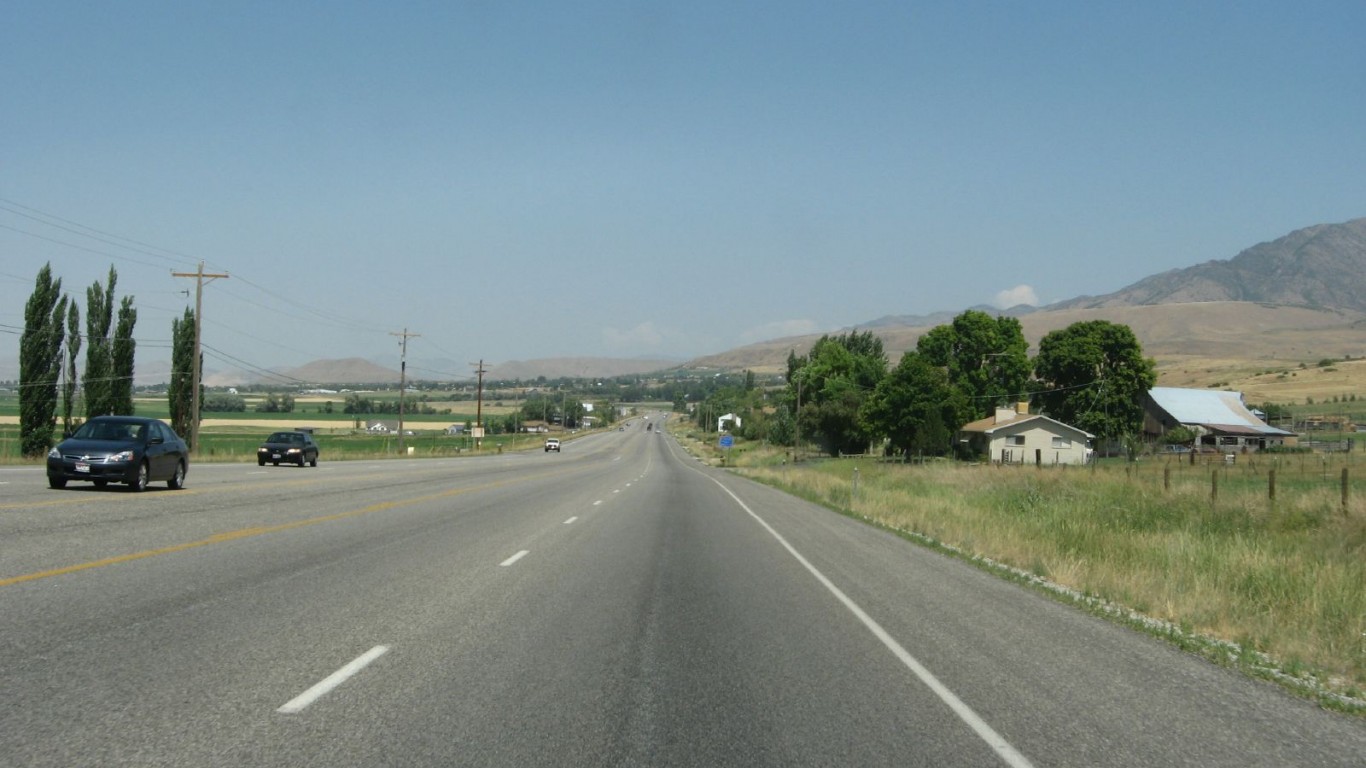
44. Utah: Richmond
> 2010-2017 population change: -2.3% (state: +6.4%)
> Median household income: $61,045 (state: $67,169)
> Annual unemployment: 5.7% (state: 4.8%)
> Total population: 108,853

45. Vermont: St. Johnsbury
> 2010-2017 population change: -13.9% (state: +0.1%)
> Median household income: $36,958 (state: $57,808)
> Annual unemployment: 2.6% (state: 2.9%)
> Total population: 5,789
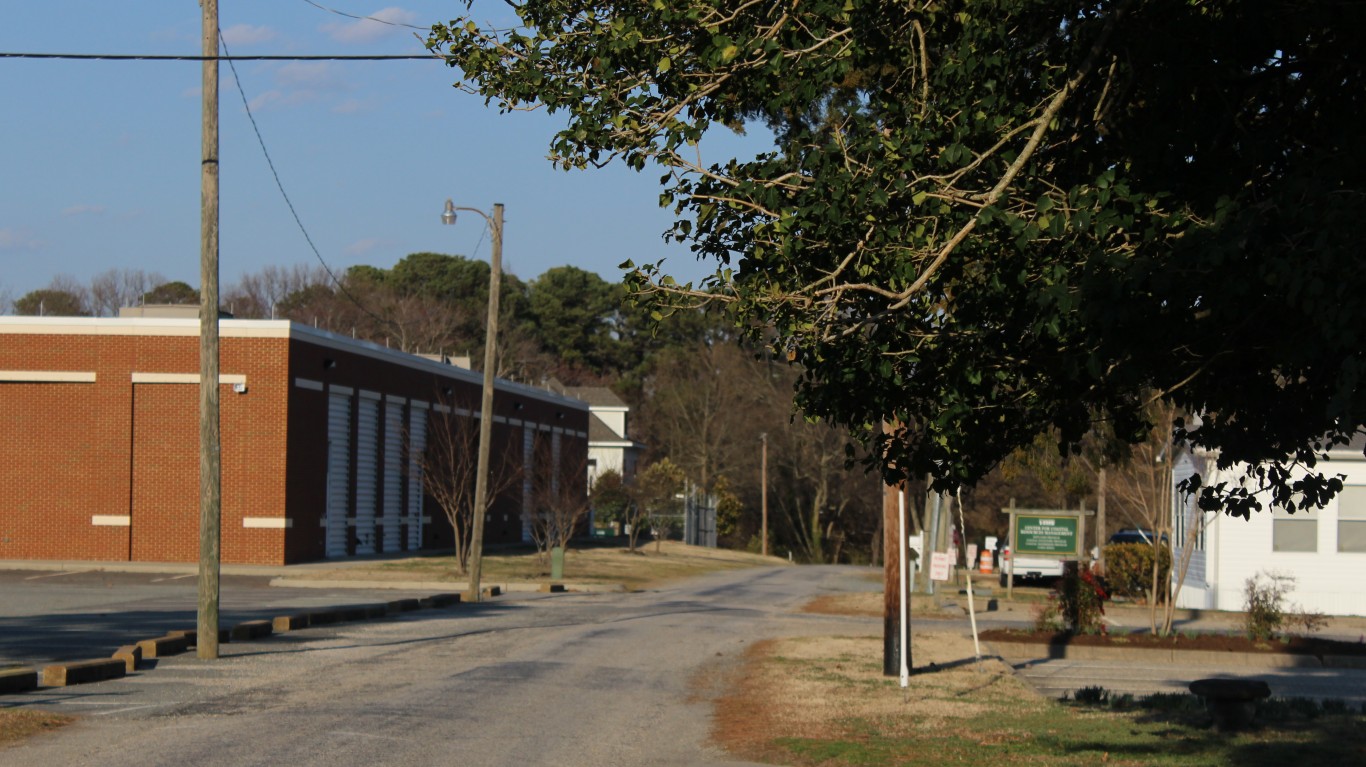
46. Virginia: Gloucester Point
> 2010-2017 population change: -10.7% (state: +6.7%)
> Median household income: $55,600 (state: $68,766)
> Annual unemployment: 1.9% (state: 3.5%)
> Total population: 9,291

47. Washington: Davenport
> 2010-2017 population change: -22.4% (state: +9.5%)
> Median household income: $42,015 (state: $50,883)
> Annual unemployment: 2.4% (state: 4.2%)
> Total population: 3,665

48. West Virginia: Bethlehem
> 2010-2017 population change: -13.1% (state: -0.2%)
> Median household income: $70,288 (state: $44,061)
> Annual unemployment: 3.5% (state: 3.8%)
> Total population: 2,459
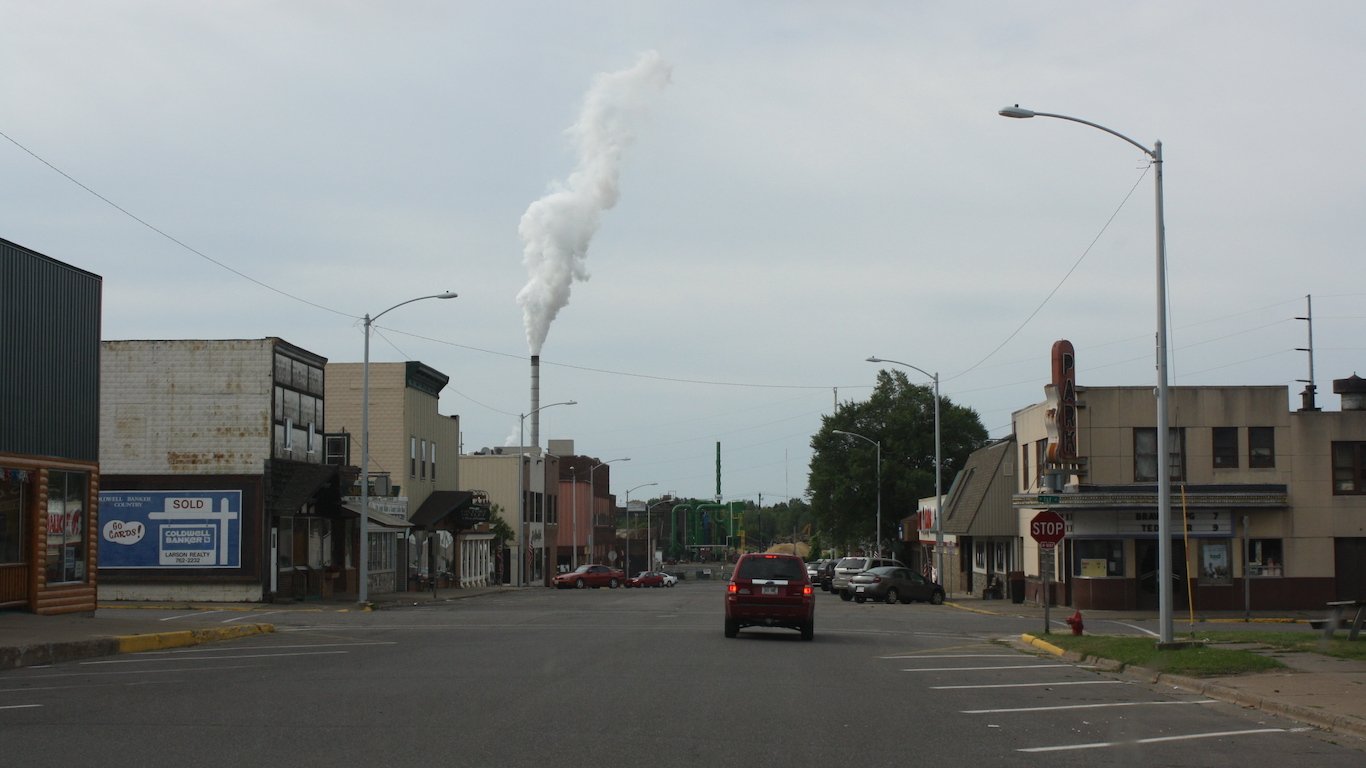
49. Wisconsin: Park Falls
> 2010-2017 population change: -15.2% (state: +2.2%)
> Median household income: $36,250 (state: $56,759)
> Annual unemployment: 1.7% (state: 3.1%)
> Total population: 2,294

50. Wyoming: Thermopolis
> 2010-2017 population change: -5.8% (state: +6.9%)
> Median household income: $50,417 (state: $60,938)
> Annual unemployment: 2.3% (state: 3.1%)
> Total population: 2,935
Methodology
To identify the fastest-shrinking place in every state, 24/7 Wall St. reviewed population change from 2010 to 2017 in nearly 15,000 cities, towns, villages, and Census designated places with populations of at least 1,000. We only considered places where the margin of error for population was less than 10%. All data are five-year estimates from the U.S. Census Bureau’s American Community Survey. We also reviewed data on median household income and annual unemployment for 2017 from the ACS.
Contact [email protected] for any questions or corrections.
Sam Stebbins is a writer at 247WallSt.com where his primary focus is on government policy, politics, companies, and broad social and economic trends. Sam has been writing in the money and news verticals for over 8 years and holds a bachelor's degree from Hobart College, which he earned in 2010. Sam resides in upstate New York and enjoys hiking, biking, canoeing, and skiing in the Adirondack Mountains and across the Northeast.