
[cnxvideo id=”873123″ placement=”ros”]
As the decade winds down, the U.S. economy continues to mark unprecedented job growth. November was the 110th straight month of reported job growth — the longest in U.S. history. In the last five years alone, the number of employed people in the United States increased by 11 million, or 7.5%.
At the national level, this growth was driven largely by the additions of food service and retail sales jobs, as well as low paying jobs in the education, health services, and professional and business sectors. These are America’s 25 thriving industries.
The vast majority of the nation’s metropolitan areas reported employment growth over the five years through 2019. All but 42 of the nation’s 383 metropolitan areas reported increases in total employment over this period. In a number of metro areas, job growth was much greater than that of the nation, with a number of places reporting more than double, and in some cases more than triple, the national 7.5% employment growth over the 5-year period.
24/7 Wall St. reviewed the 25 metropolitan areas with the largest percentage increase in total employment from October 2014 to October 2019 using seasonally adjusted data from the Bureau of Labor Statistics’ Local Area Unemployment Statistics program.
While only one measure of an economy, employment growth is closely tied to favorable outcomes in an area’s population. The majority of the metropolitan areas on this list have unemployment rates, household incomes, college attainment rates, poverty rates, and population growth that are better than the corresponding national figures. Every city on this list reported a population growth at least double the U.S. growth of 3.5% over the last five years. Here are the fastest growing places in every state.
Click here to see the cities that added the most jobs
Click here to see the cities that lost the most jobs
Click here to read our methodology

25. Prescott, AZ
> Employment increase (Oct. 2014 – Oct. 2019): 16.1% (+14,352 jobs)
> Industry with largest 5-yr. employment increase: Leisure and hospitality (+2,600 jobs)
> October 2019 unemployment: 4.5%
> Median household income: $48,148
[in-text-ad]

24. Raleigh, NC
> Employment increase (Oct. 2014 – Oct. 2019): 16.1% (+98,306 jobs)
> Industry with largest 5-yr. employment increase: Professional and business services (+16,700 jobs)
> October 2019 unemployment: 3.5%
> Median household income: $75,165
[recirclink id=569954]

23. Naples-Immokalee-Marco Island, FL
> Employment increase (Oct. 2014 – Oct. 2019): 16.2% (+24,624 jobs)
> Industry with largest 5-yr. employment increase: Mining, logging, and construction (+6,600 jobs)
> October 2019 unemployment: 2.8%
> Median household income: $69,867

22. Kennewick-Richland, WA
> Employment increase (Oct. 2014 – Oct. 2019): 16.3% (+19,384 jobs)
> Industry with largest 5-yr. employment increase: Mining, logging, and construction (+3,500 jobs)
> October 2019 unemployment: 5.9%
> Median household income: $64,908
[in-text-ad-2]

21. Bellingham, WA
> Employment increase (Oct. 2014 – Oct. 2019): 16.5% (+15,669 jobs)
> Industry with largest 5-yr. employment increase: Mining, logging, and construction (+2,200 jobs)
> October 2019 unemployment: 5.4%
> Median household income: $62,268

20. Cape Coral-Fort Myers, FL
> Employment increase (Oct. 2014 – Oct. 2019): 16.5% (+48,841 jobs)
> Industry with largest 5-yr. employment increase: Mining, logging, and construction (+12,400 jobs)
> October 2019 unemployment: 3.0%
> Median household income: $56,129
[in-text-ad]

19. Greeley, CO
> Employment increase (Oct. 2014 – Oct. 2019): 16.6% (+23,534 jobs)
> Industry with largest 5-yr. employment increase: Government (+2,100 jobs)
> October 2019 unemployment: 2.5%
> Median household income: $75,938
[recirclink id=561552]

18. Daphne-Fairhope-Foley, AL
> Employment increase (Oct. 2014 – Oct. 2019): 16.9% (+13,737 jobs)
> Industry with largest 5-yr. employment increase: Government (+600 jobs)
> October 2019 unemployment: 2.5%
> Median household income: $56,813

17. Charlotte-Concord-Gastonia, NC-SC
> Employment increase (Oct. 2014 – Oct. 2019): 16.9% (+192,813 jobs)
> Industry with largest 5-yr. employment increase: Professional and business services (+36,500 jobs)
> October 2019 unemployment: 3.6%
> Median household income: $62,068
[in-text-ad-2]

16. Fayetteville-Springdale-Rogers, AR-MO
> Employment increase (Oct. 2014 – Oct. 2019): 17.0% (+40,157 jobs)
> Industry with largest 5-yr. employment increase: Professional and business services (+7,100 jobs)
> October 2019 unemployment: 2.5%
> Median household income: $57,911
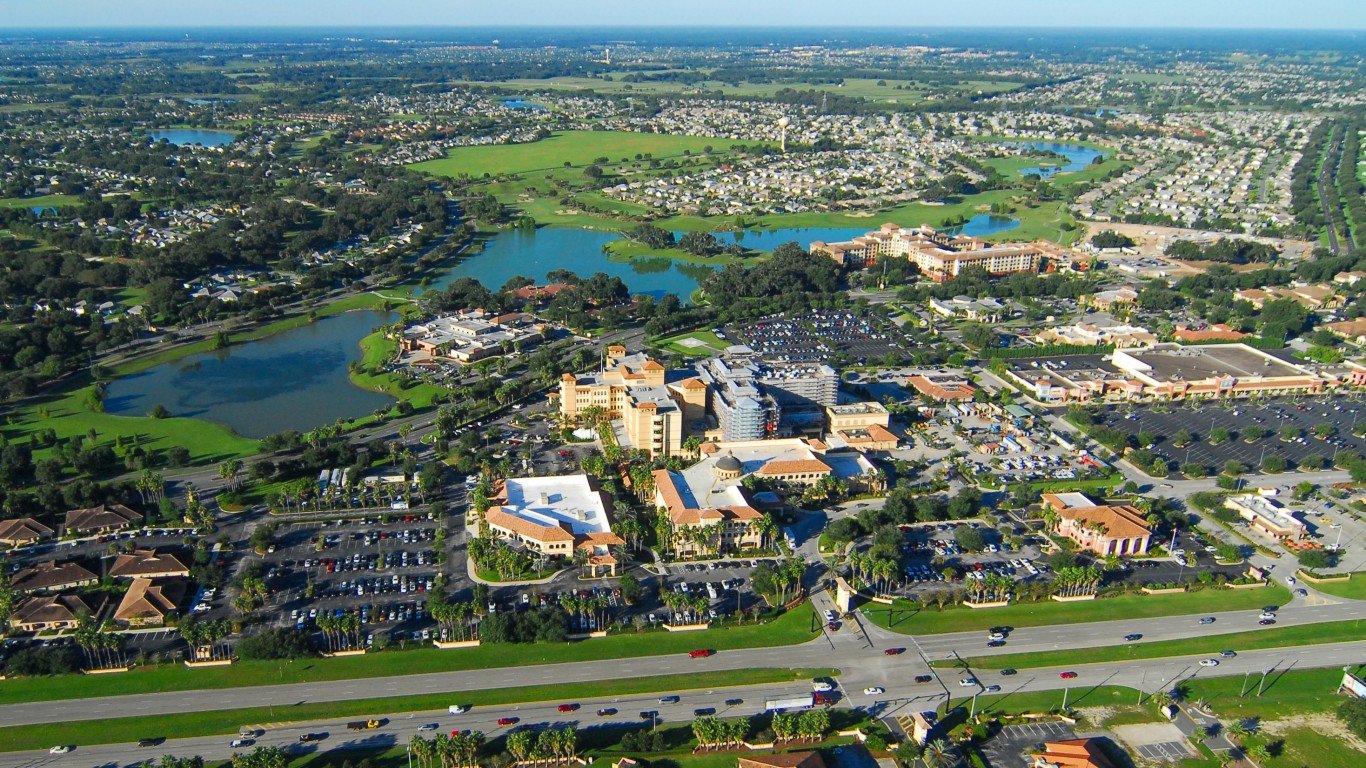
15. The Villages, FL
> Employment increase (Oct. 2014 – Oct. 2019): 17.1% (+4,449 jobs)
> Industry with largest 5-yr. employment increase: Government (+100 jobs)
> October 2019 unemployment: 4.5%
> Median household income: $53,895
[in-text-ad]

14. Austin-Round Rock, TX
> Employment increase (Oct. 2014 – Oct. 2019): 17.3% (+175,385 jobs)
> Industry with largest 5-yr. employment increase: Professional and business services (+42,200 jobs)
> October 2019 unemployment: 2.6%
> Median household income: $76,925
[recirclink id=569954]

13. Olympia-Tumwater, WA
> Employment increase (Oct. 2014 – Oct. 2019): 17.4% (+20,224 jobs)
> Industry with largest 5-yr. employment increase: Education and health services (+3,500 jobs)
> October 2019 unemployment: 5.2%
> Median household income: $72,703

12. Myrtle Beach-Conway-North Myrtle Beach, SC-NC
> Employment increase (Oct. 2014 – Oct. 2019): 17.6% (+29,897 jobs)
> Industry with largest 5-yr. employment increase: Leisure and hospitality (+7,500 jobs)
> October 2019 unemployment: 3.9%
> Median household income: $51,580
[in-text-ad-2]

11. Idaho Falls, ID
> Employment increase (Oct. 2014 – Oct. 2019): 17.8% (+10,811 jobs)
> Industry with largest 5-yr. employment increase: Professional and business services (+3,100 jobs)
> October 2019 unemployment: 2.4%
> Median household income: $58,880

10. Orlando-Kissimmee-Sanford, FL
> Employment increase (Oct. 2014 – Oct. 2019): 18.1% (+205,229 jobs)
> Industry with largest 5-yr. employment increase: Professional and business services (+69,900 jobs)
> October 2019 unemployment: 2.9%
> Median household income: $58,610
[in-text-ad]

9. Fort Collins, CO
> Employment increase (Oct. 2014 – Oct. 2019): 18.1% (+31,008 jobs)
> Industry with largest 5-yr. employment increase: Government (+6,100 jobs)
> October 2019 unemployment: 2.3%
> Median household income: $71,091
[recirclink id=566282]

8. Gainesville, GA
> Employment increase (Oct. 2014 – Oct. 2019): 19.1% (+16,307 jobs)
> Industry with largest 5-yr. employment increase: Trade, transportation, and utilities (+2,100 jobs)
> October 2019 unemployment: 2.6%
> Median household income: $61,699

7. Phoenix-Mesa-Scottsdale, AZ
> Employment increase (Oct. 2014 – Oct. 2019): 19.5% (+393,736 jobs)
> Industry with largest 5-yr. employment increase: Education and health services (+68,500 jobs)
> October 2019 unemployment: 4.1%
> Median household income: $64,427
[in-text-ad-2]

6. Boise City, ID
> Employment increase (Oct. 2014 – Oct. 2019): 20.4% (+61,922 jobs)
> Industry with largest 5-yr. employment increase: Education and health services (+9,100 jobs)
> October 2019 unemployment: 2.7%
> Median household income: $61,407

5. Provo-Orem, UT
> Employment increase (Oct. 2014 – Oct. 2019): 20.5% (+52,055 jobs)
> Industry with largest 5-yr. employment increase: Trade, transportation, and utilities (+10,900 jobs)
> October 2019 unemployment: 2.3%
> Median household income: $75,344
[in-text-ad]

4. Nashville-Davidson-Murfreesboro-Franklin, TN
> Employment increase (Oct. 2014 – Oct. 2019): 21.4% (+186,037 jobs)
> Industry with largest 5-yr. employment increase: Professional and business services (+30,900 jobs)
> October 2019 unemployment: 2.6%
> Median household income: $65,919
[recirclink id=596900]

3. Bend-Redmond, OR
> Employment increase (Oct. 2014 – Oct. 2019): 22.2% (+16,884 jobs)
> Industry with largest 5-yr. employment increase: Mining, logging, and construction (+3,200 jobs)
> October 2019 unemployment: 4.1%
> Median household income: $67,577

2. Reno, NV
> Employment increase (Oct. 2014 – Oct. 2019): 24.6% (+51,078 jobs)
> Industry with largest 5-yr. employment increase: Manufacturing (+14,700 jobs)
> October 2019 unemployment: 3.2%
> Median household income: $63,466
[in-text-ad-2]

1. St. George, UT
> Employment increase (Oct. 2014 – Oct. 2019): 25.4% (+15,054 jobs)
> Industry with largest 5-yr. employment increase: Trade, transportation, and utilities (+3,600 jobs)
> October 2019 unemployment: 2.9%
> Median household income: $56,333
Methodology
To determine the cities that added the most jobs, 24/7 Wall St. reviewed the percentage change in total employment from October 2014 to October 2019 in U.S. metropolitan areas using seasonally adjusted data from the Bureau of Labor Statistics’ Local Area Unemployment Statistics program. Data on unemployment also came from the BLS LAUS program. National employment data and data on industry employment for the same period are from the BLS Current Employment Statistics program and is not seasonally adjusted. Population figures for the years 2013 and 2018 are from the U.S. Census Bureau’s American Community Survey. Data on median household income, poverty, and the share of adults 25 and over with at least a bachelor’s degree also came from the ACS and are for 2018. All data are for the most recent period available.
Contact [email protected] for any questions or corrections.