[cnxvideo id=”940102″ placement=”ros”]
There were over 36,000 fatalities from traffic accidents in the U.S. in 2018. Most of these accidents took place in major metropolitan areas that often have large highways and interstates packed with thousands of drivers. While driving conditions vary nationwide, in each state, there is at least one city where driving stands out as especially stressful, time consuming, and dangerous.
24/7 Wall St. reviewed traffic fatality rates, commute times, traffic delays and associated costs, and the rate of car theft in hundreds of American cities to determine the worst city to drive in every state. Data came from several sources, including the National Highway Traffic Safety Administration’s Fatality Analysis Reporting System.
While most factors affecting a commute are outside of a driver’s control, some cars can help reduce the stress of driving. Certain car brands have a reputation for making vehicles that require little maintenance and have high gas mileage, which can help drivers lower gas and maintenance cost, and contain safety features to help drivers avoid accidents or keep car occupants safer. These are the car brands with the happiest drivers.
Click here to see the worst cities to drive in every state
Click here to read our methodology
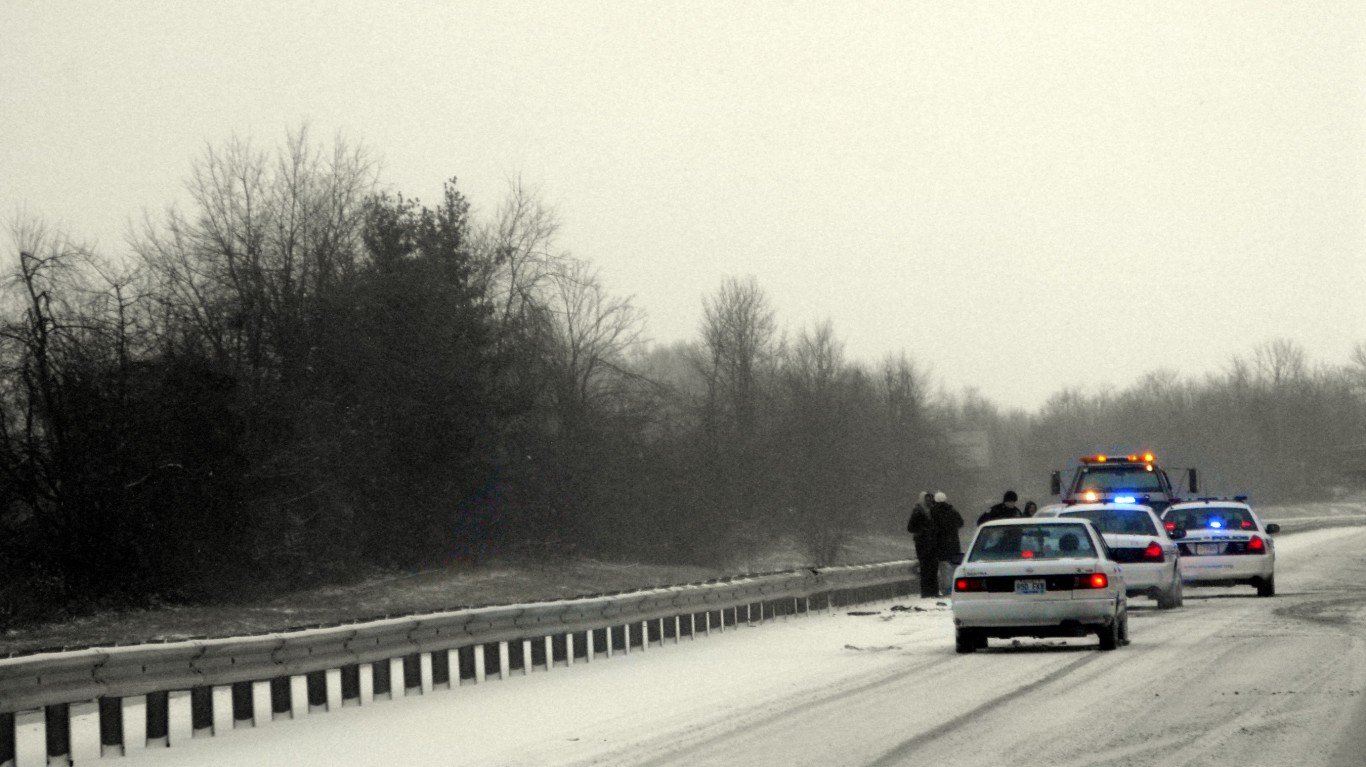
1. Alabama: Tuscaloosa
> 2018 traffic fatalities per 100,000 people 21.4 per 100,000 (53 total)
> Avg. commute: 25.1 minutes
> Annual hours of delay per commuter: 30
> Avg. annual state auto insurance rate: $1,299
> Most dangerous road: I-59
[in-text-ad]
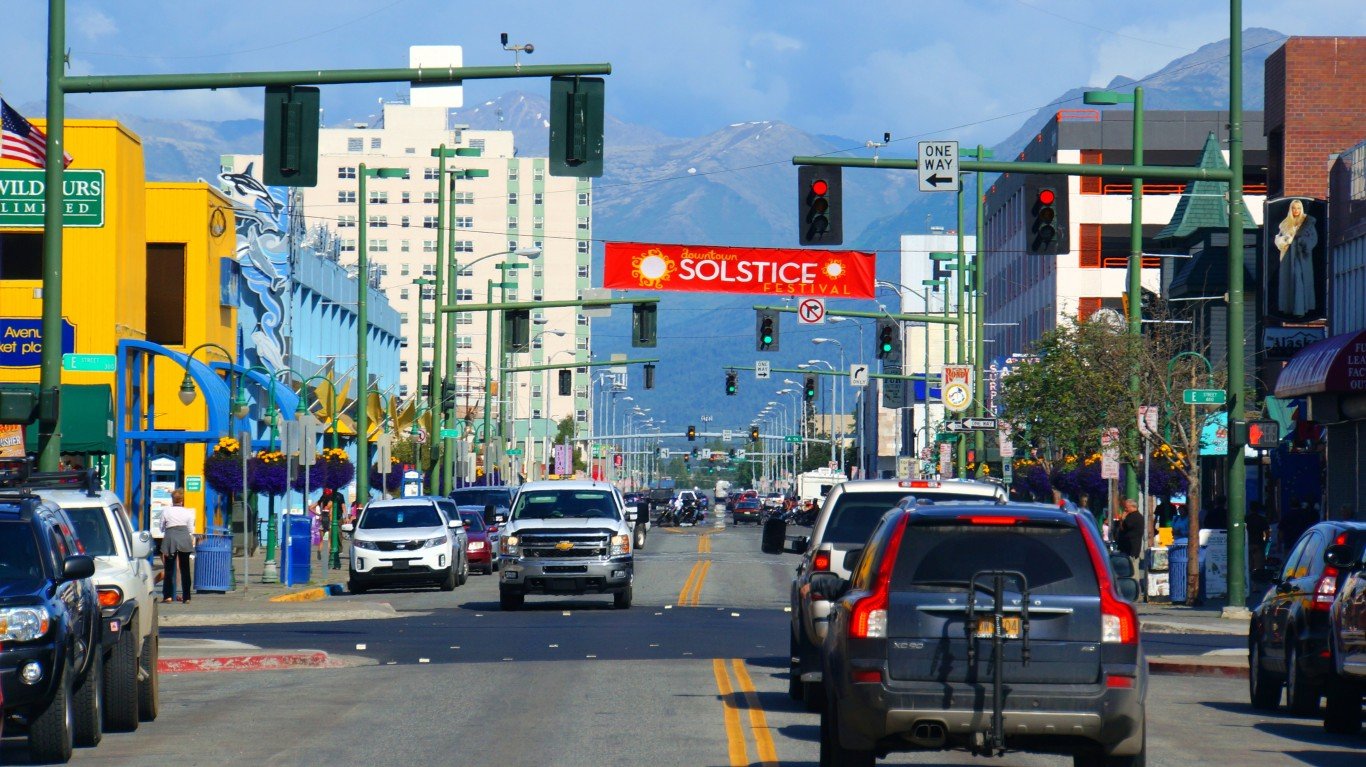
2. Alaska: Anchorage
> 2018 traffic fatalities per 100,000 people 12.0 per 100,000 (48 total)
> Avg. commute: 23.0 minutes
> Annual hours of delay per commuter: 42
> Avg. annual state auto insurance rate: $1,109
> Most dangerous road: SR-3 Parks Highway
[recirclink id=599259]
3. Arizona: Tucson
> 2018 traffic fatalities per 100,000 people 12.4 per 100,000 (125 total)
> Avg. commute: 25.3 minutes
> Annual hours of delay per commuter: 52
> Avg. annual state auto insurance rate: $1,353
> Most dangerous road: I-10
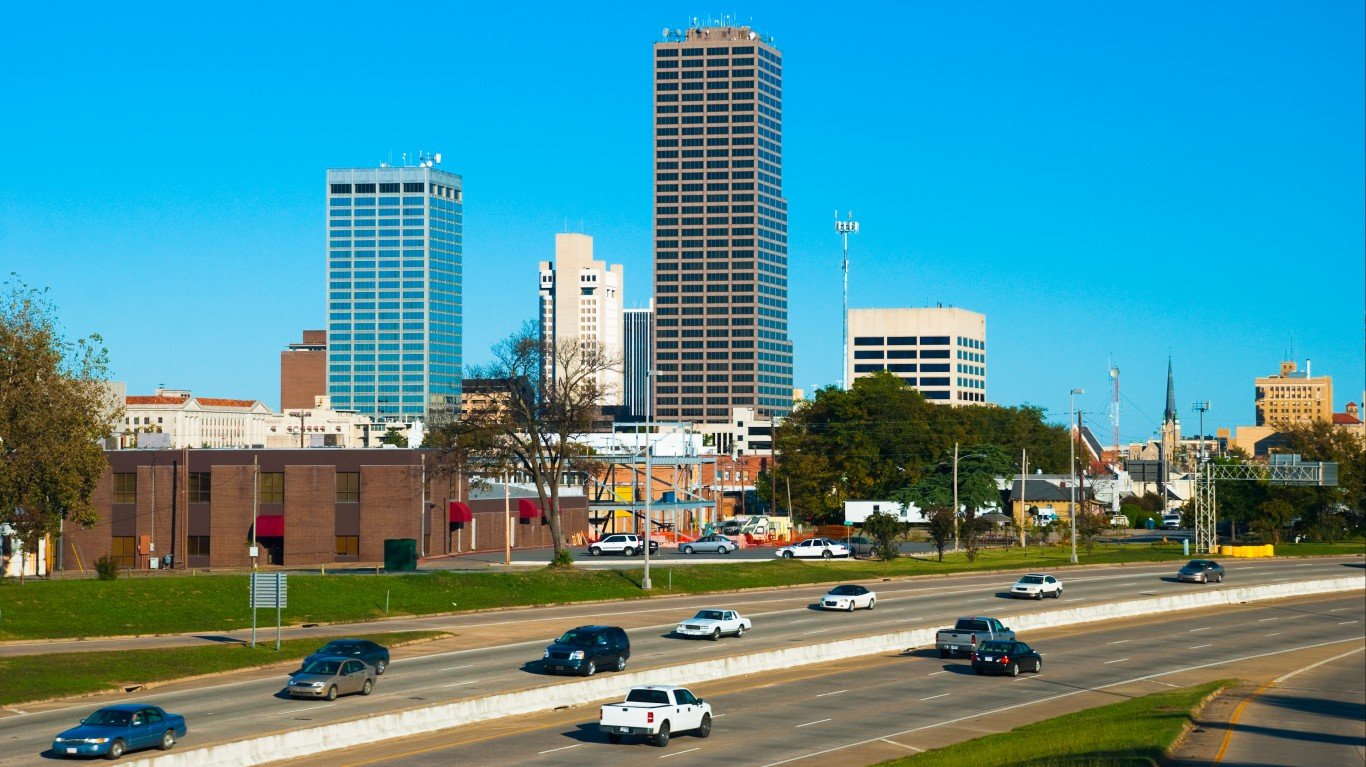
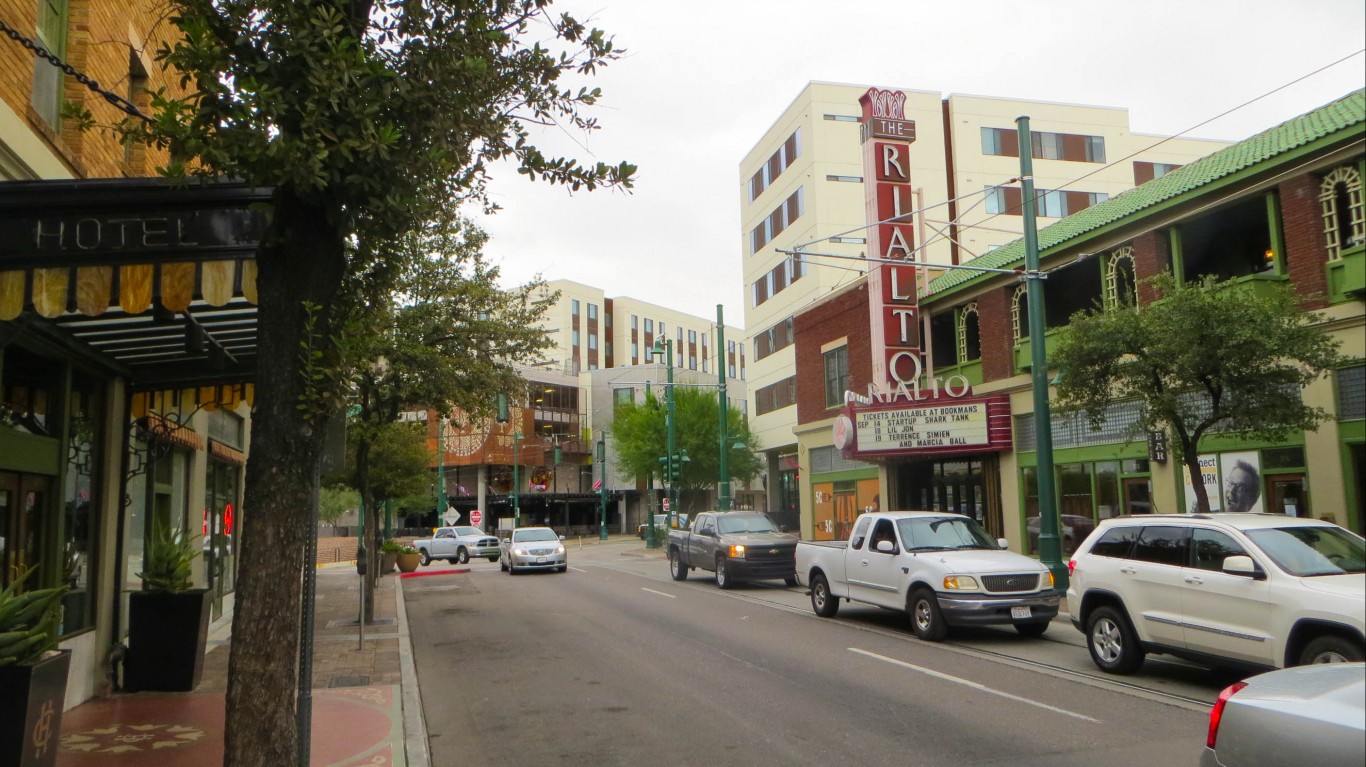
4. Arkansas: Little Rock-North Little Rock-Conway
> 2018 traffic fatalities per 100,000 people 15.3 per 100,000 (112 total)
> Avg. commute: 23.4 minutes
> Annual hours of delay per commuter: 41
> Avg. annual state auto insurance rate: $1,370
> Most dangerous road: I-40-410
[in-text-ad-2]
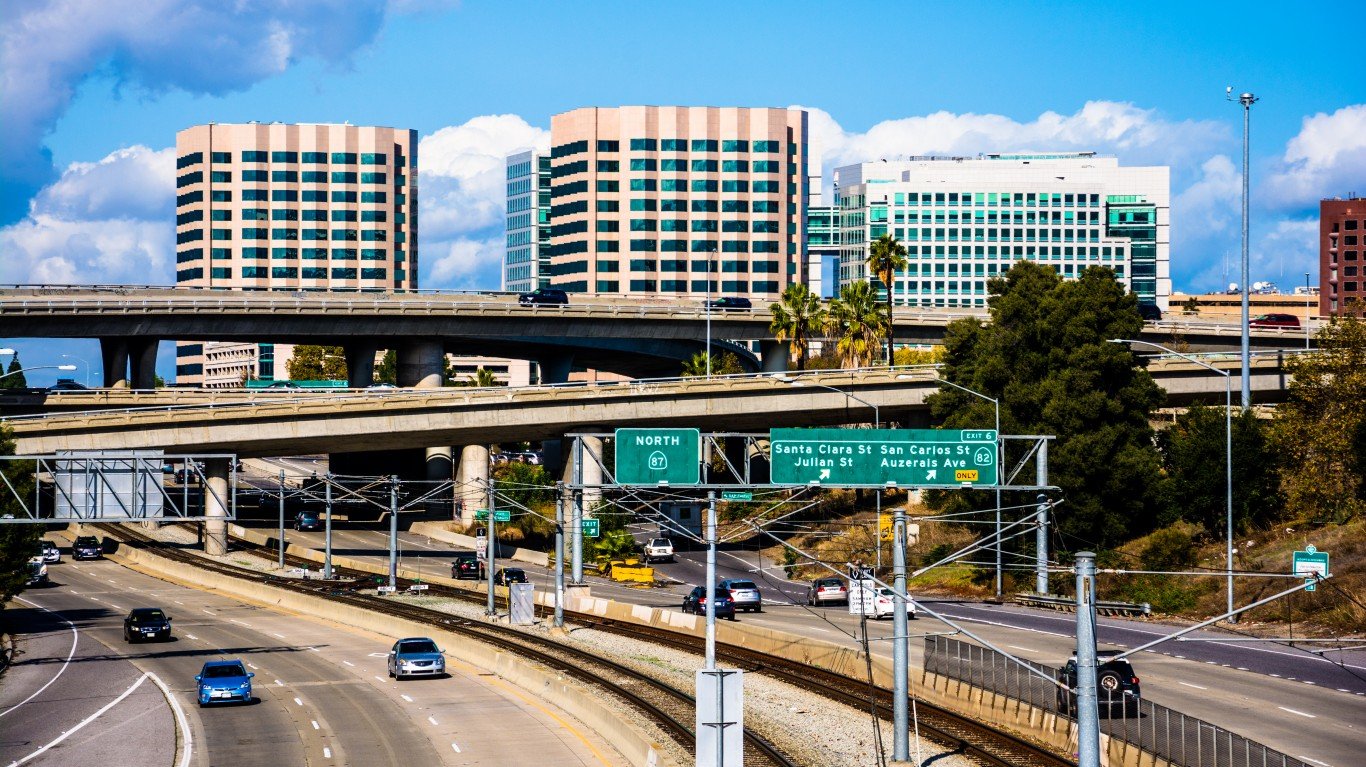
5. California: San Jose-Sunnyvale-Santa Clara
> 2018 traffic fatalities per 100,000 people 6.2 per 100,000 (123 total)
> Avg. commute: 29.8 minutes
> Annual hours of delay per commuter: 81
> Avg. annual state auto insurance rate: $1,527
> Most dangerous road: US-101
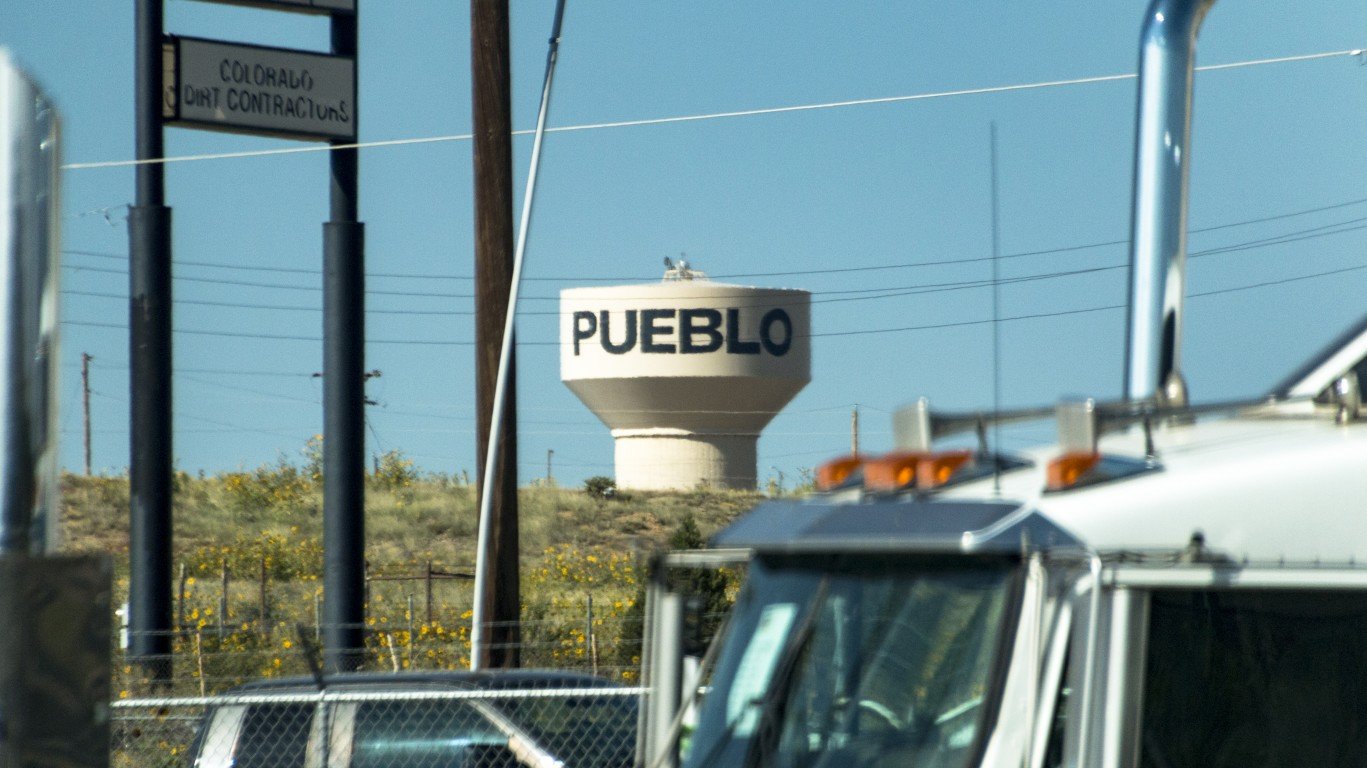
6. Colorado: Pueblo
> 2018 traffic fatalities per 100,000 people 22.0 per 100,000 (36 total)
> Avg. commute: 22.6 minutes
> Annual hours of delay per commuter: 20
> Avg. annual state auto insurance rate: $1,435
> Most dangerous road: I-25
[in-text-ad]
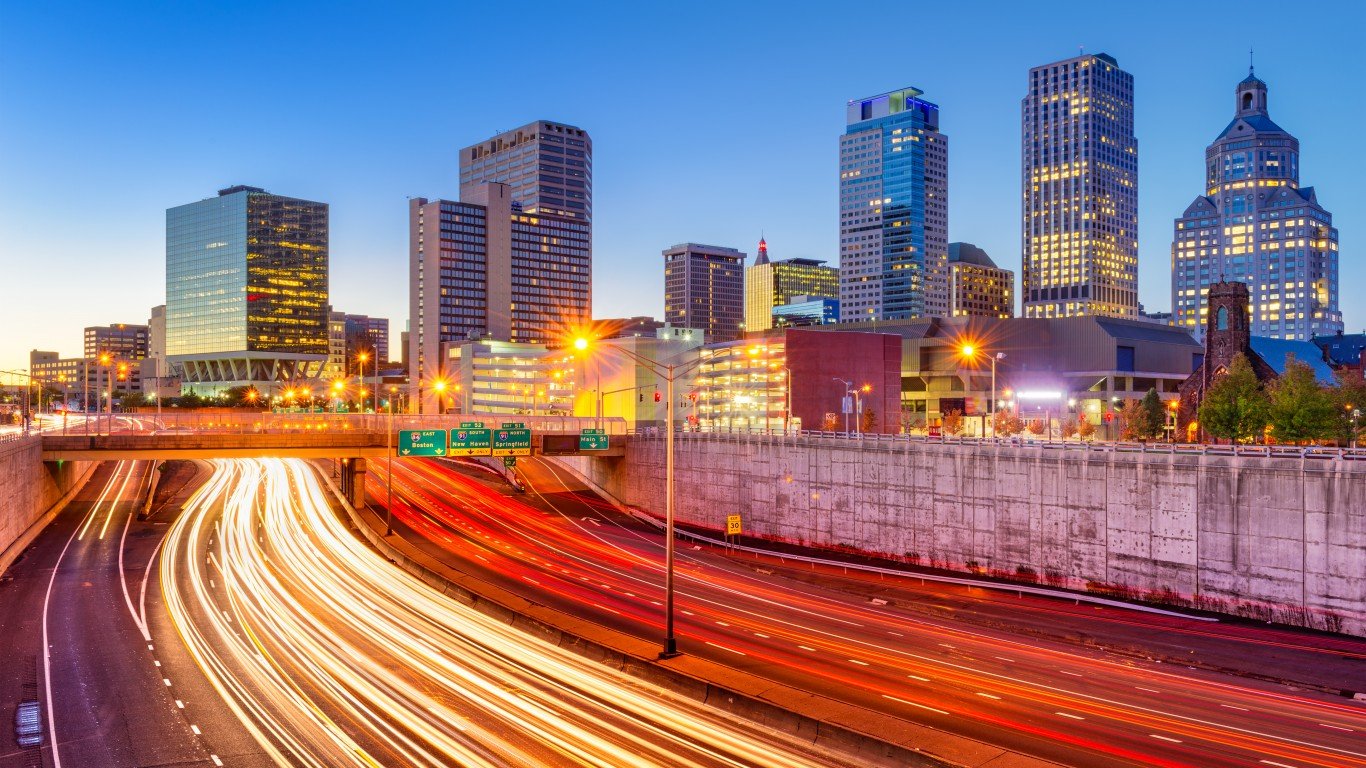
7. Connecticut: Hartford-West Hartford-East Hartford
> 2018 traffic fatalities per 100,000 people 8.3 per 100,000 (101 total)
> Avg. commute: 24.5 minutes
> Annual hours of delay per commuter: 50
> Avg. annual state auto insurance rate: $1,771
> Most dangerous road: I-91
[recirclink id=599278]
8. Delaware: Dover
> 2018 traffic fatalities per 100,000 people 13.9 per 100,000 (24 total)
> Avg. commute: 26.6 minutes
> Annual hours of delay per commuter: 24
> Avg. annual state auto insurance rate: $1,646
> Most dangerous road: US-13 N DuPont Highway
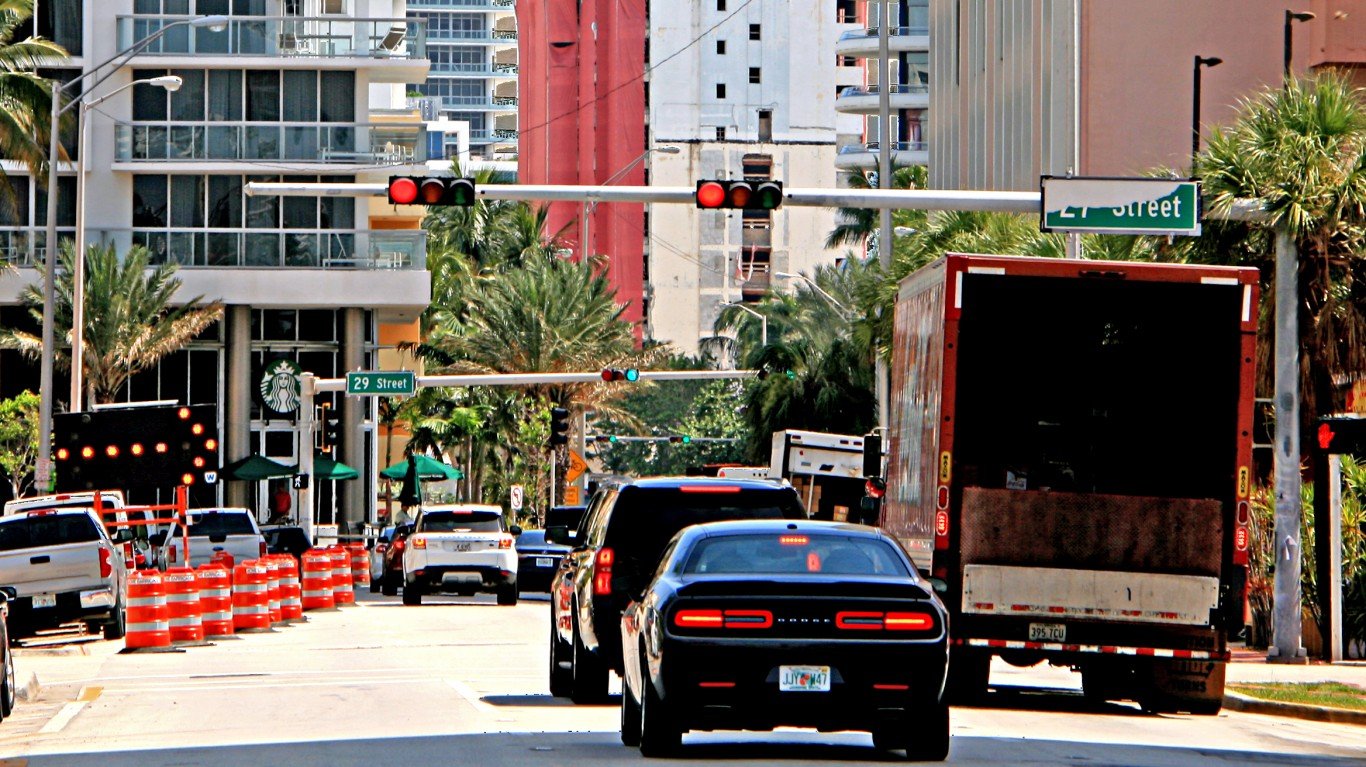
9. Florida: Miami-Fort Lauderdale-West Palm Beach
> 2018 traffic fatalities per 100,000 people 11.8 per 100,000 (712 total)
> Avg. commute: 30.5 minutes
> Annual hours of delay per commuter: 69
> Avg. annual state auto insurance rate: $1,823
> Most dangerous road: I-95
[in-text-ad-2]
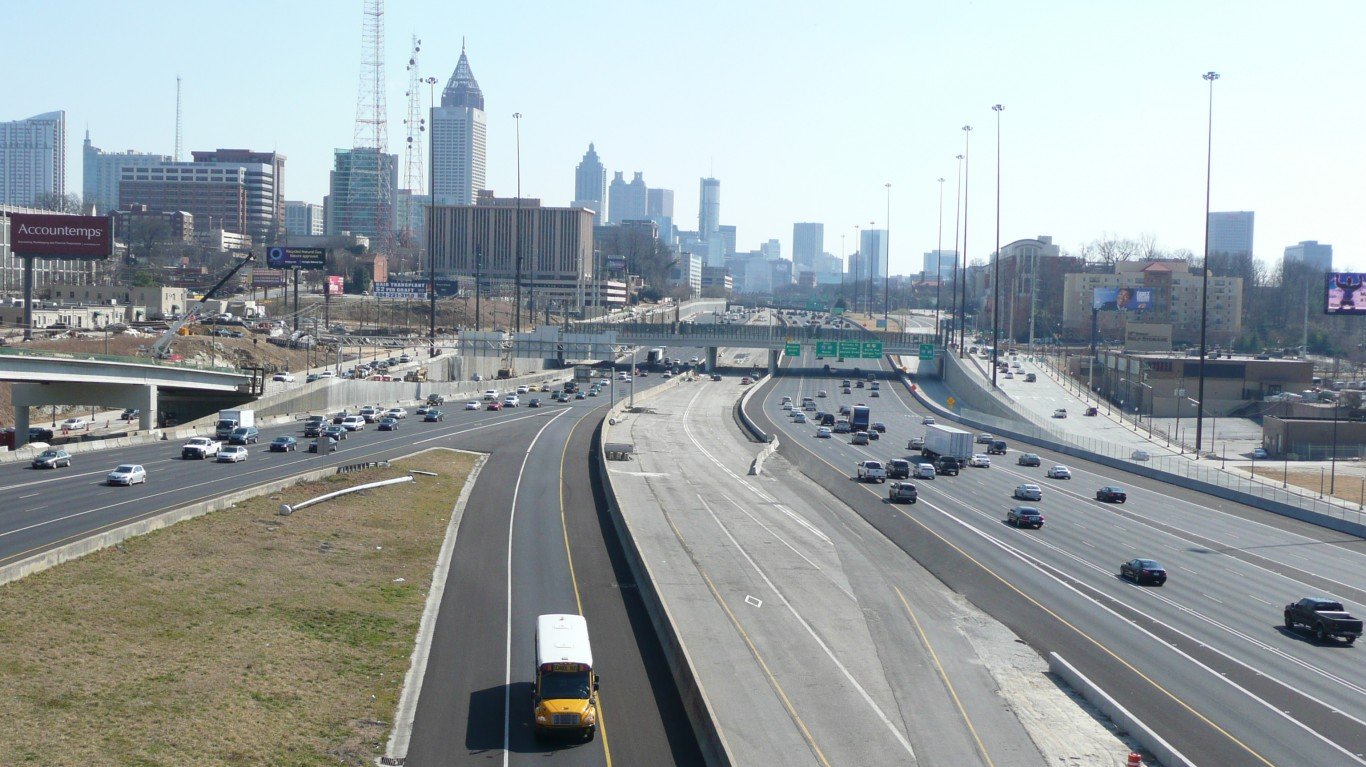
10. Georgia: Atlanta-Sandy Springs-Roswell
> 2018 traffic fatalities per 100,000 people 12.4 per 100,000 (705 total)
> Avg. commute: 32.5 minutes
> Annual hours of delay per commuter: 76
> Avg. annual state auto insurance rate: $1,340
> Most dangerous road: I-75

11. Hawaii: Urban Honolulu
> 2018 traffic fatalities per 100,000 people 6.3 per 100,000 (62 total)
> Avg. commute: 29.0 minutes
> Annual hours of delay per commuter: N/A
> Avg. annual state auto insurance rate: $1,458
> Most dangerous road: SR-93
[in-text-ad]
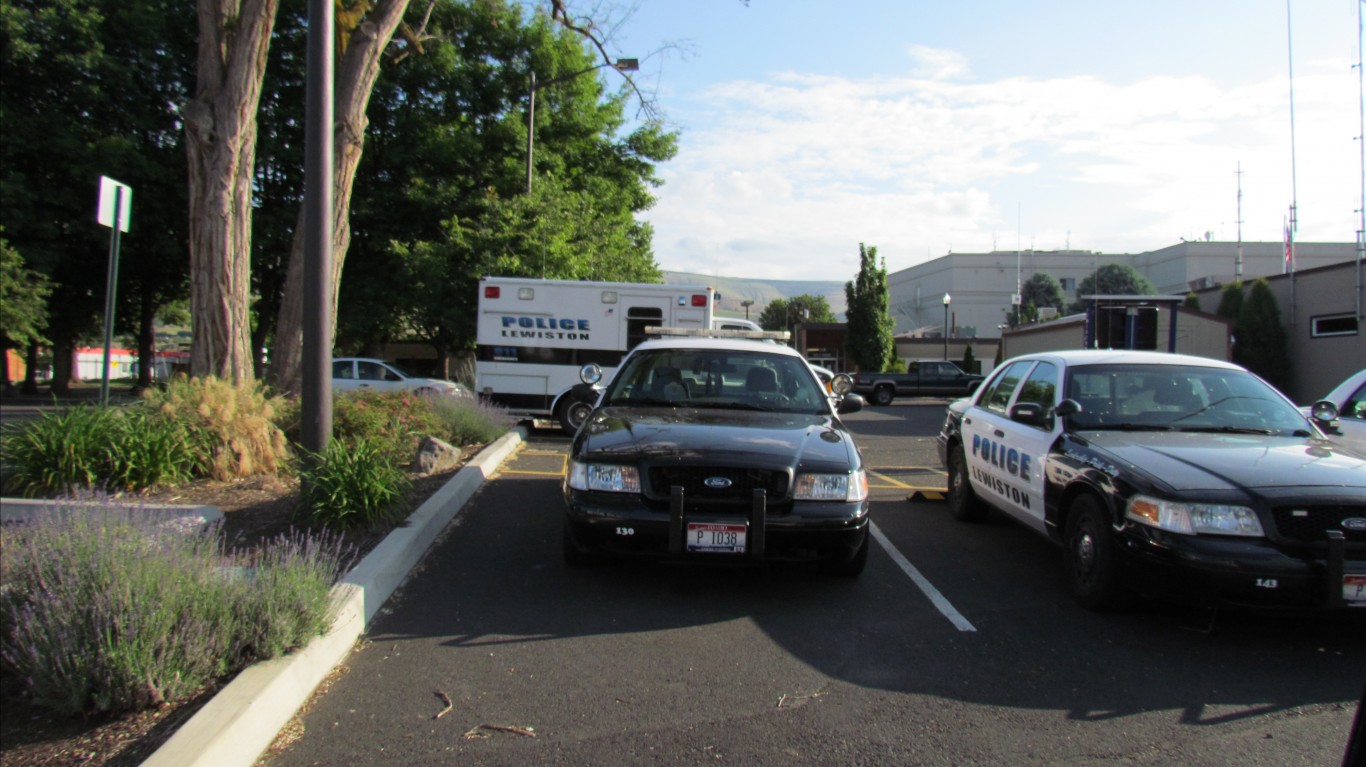
12. Idaho: Lewiston
> 2018 traffic fatalities per 100,000 people 17.7 per 100,000 (11 total)
> Avg. commute: 19.0 minutes
> Annual hours of delay per commuter: N/A
> Avg. annual state auto insurance rate: $941
> Most dangerous road: US-95
[recirclink id=598092]
13. Illinois: Carbondale-Marion
> 2018 traffic fatalities per 100,000 people 22.2 per 100,000 (31 total)
> Avg. commute: 20.9 minutes
> Annual hours of delay per commuter: N/A
> Avg. annual state auto insurance rate: $1,004
> Most dangerous road: I-57

14. Indiana: Indianapolis-Carmel-Anderson
> 2018 traffic fatalities per 100,000 people 10.7 per 100,000 (213 total)
> Avg. commute: 25.4 minutes
> Annual hours of delay per commuter: 48
> Avg. annual state auto insurance rate: $964
> Most dangerous road: US-40
[in-text-ad-2]
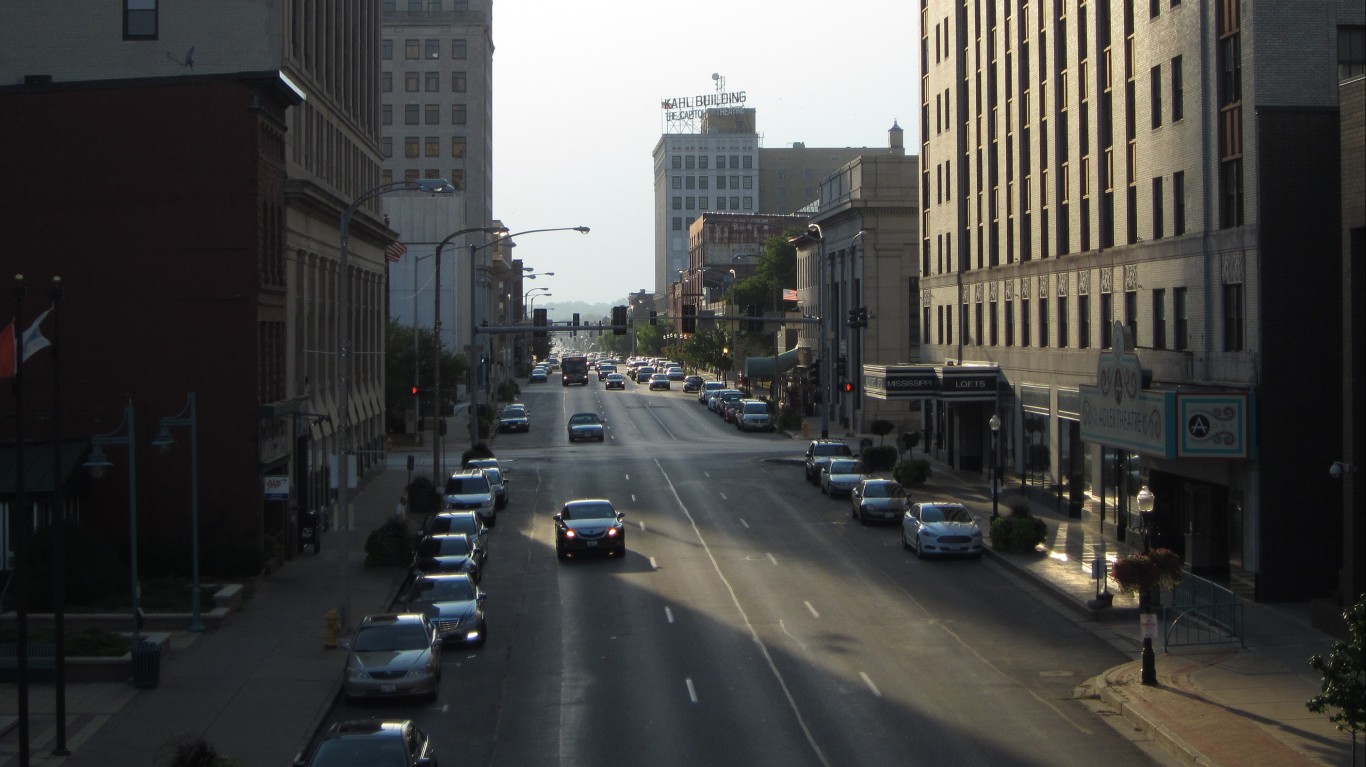
15. Iowa: Davenport-Moline-Rock Island
> 2018 traffic fatalities per 100,000 people 9.5 per 100,000 (35 total)
> Avg. commute: 19.9 minutes
> Annual hours of delay per commuter: N/A
> Avg. annual state auto insurance rate: $1,015
> Most dangerous road: I-80
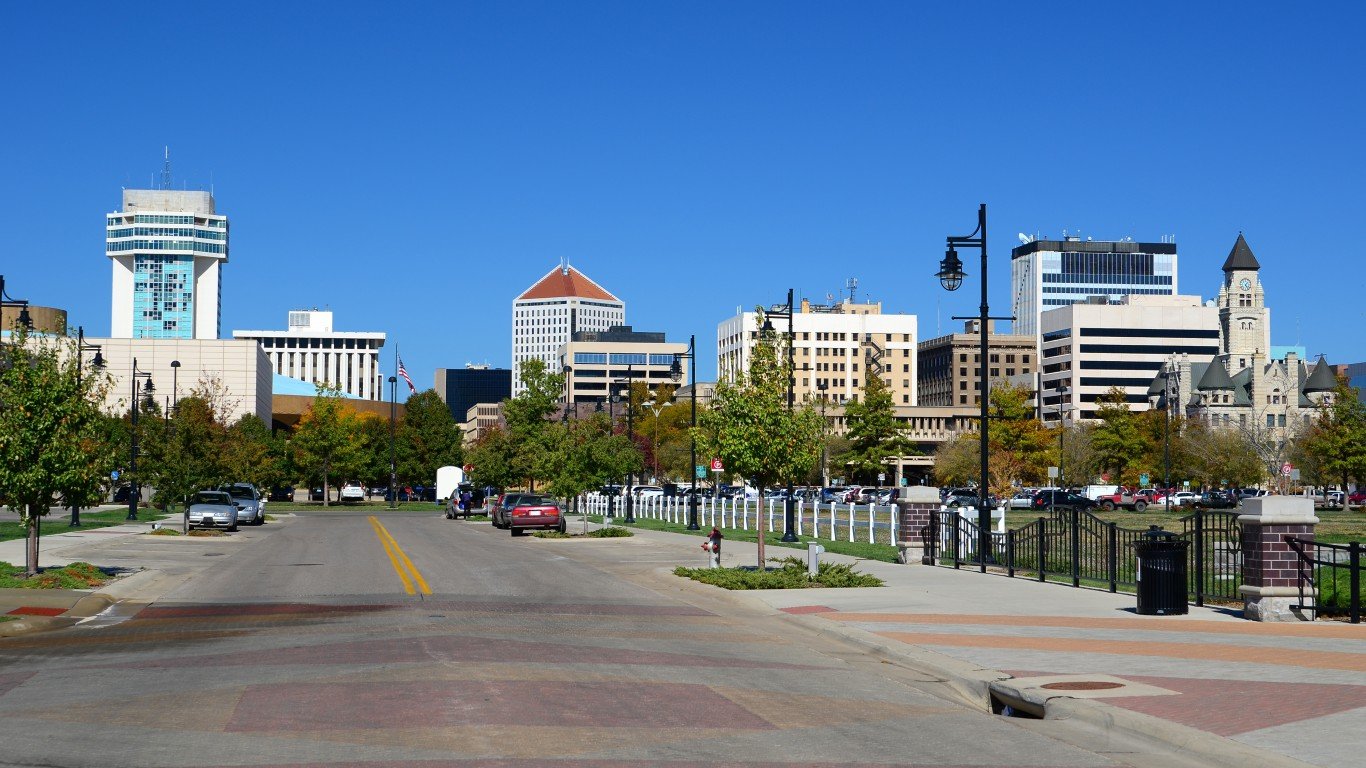
16. Kansas: Wichita
> 2018 traffic fatalities per 100,000 people 14.2 per 100,000 (90 total)
> Avg. commute: 20.3 minutes
> Annual hours of delay per commuter: 36
> Avg. annual state auto insurance rate: $1,242
> Most dangerous road: I-35
[in-text-ad]
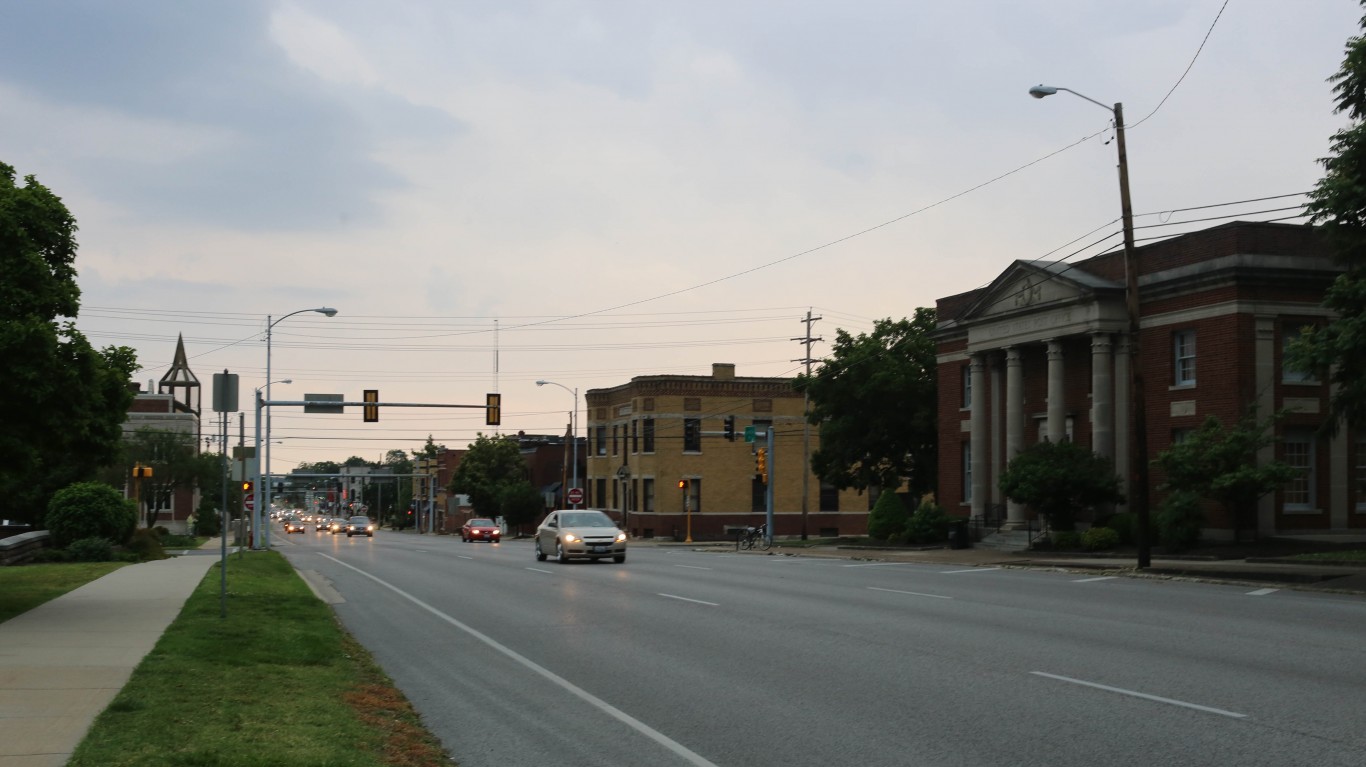
17. Kentucky: Elizabethtown-Fort Knox
> 2018 traffic fatalities per 100,000 people 19.3 per 100,000 (29 total)
> Avg. commute: 23.0 minutes
> Annual hours of delay per commuter: N/A
> Avg. annual state auto insurance rate: $1,752
> Most dangerous road: SR-9002
[recirclink id=598077]
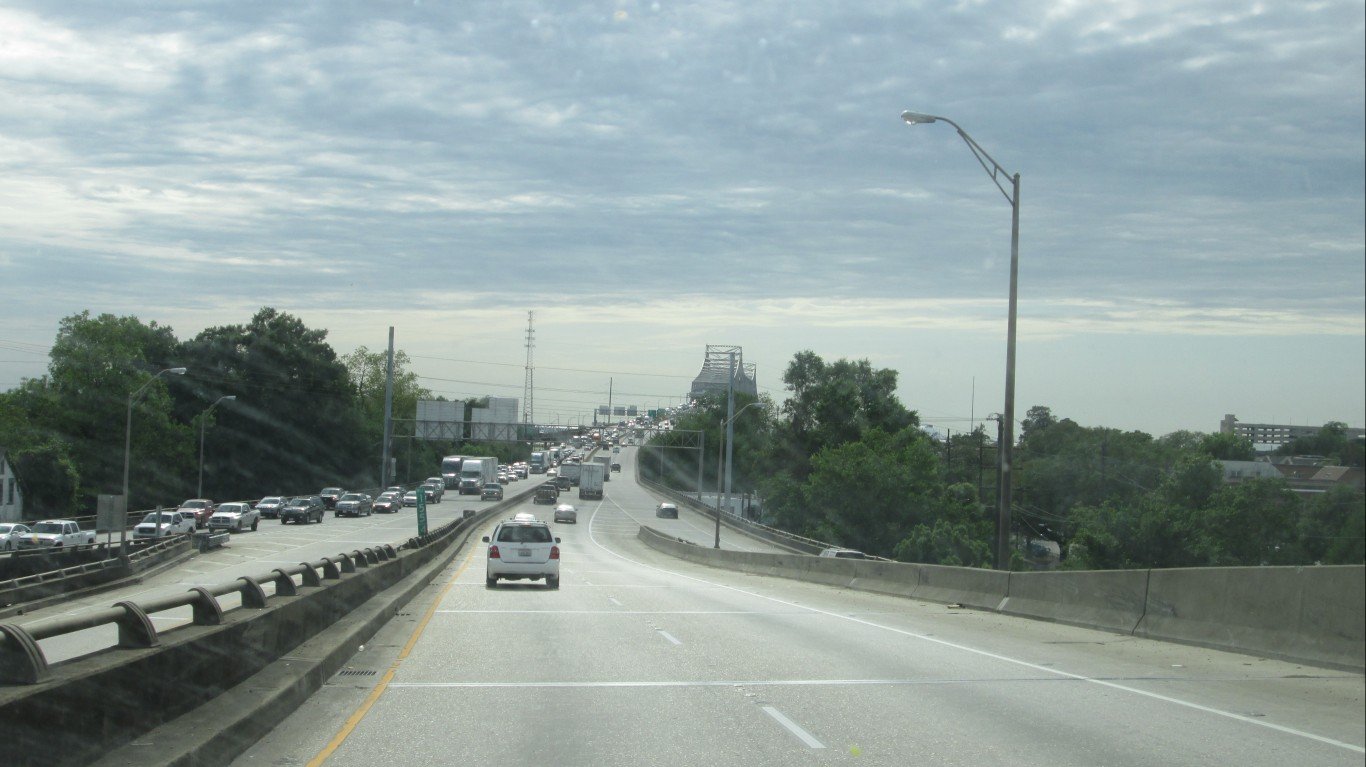
18. Louisiana: Baton Rouge
> 2018 traffic fatalities per 100,000 people 20.8 per 100,000 (177 total)
> Avg. commute: 27.2 minutes
> Annual hours of delay per commuter: 58
> Avg. annual state auto insurance rate: $2,190
> Most dangerous road: US-61
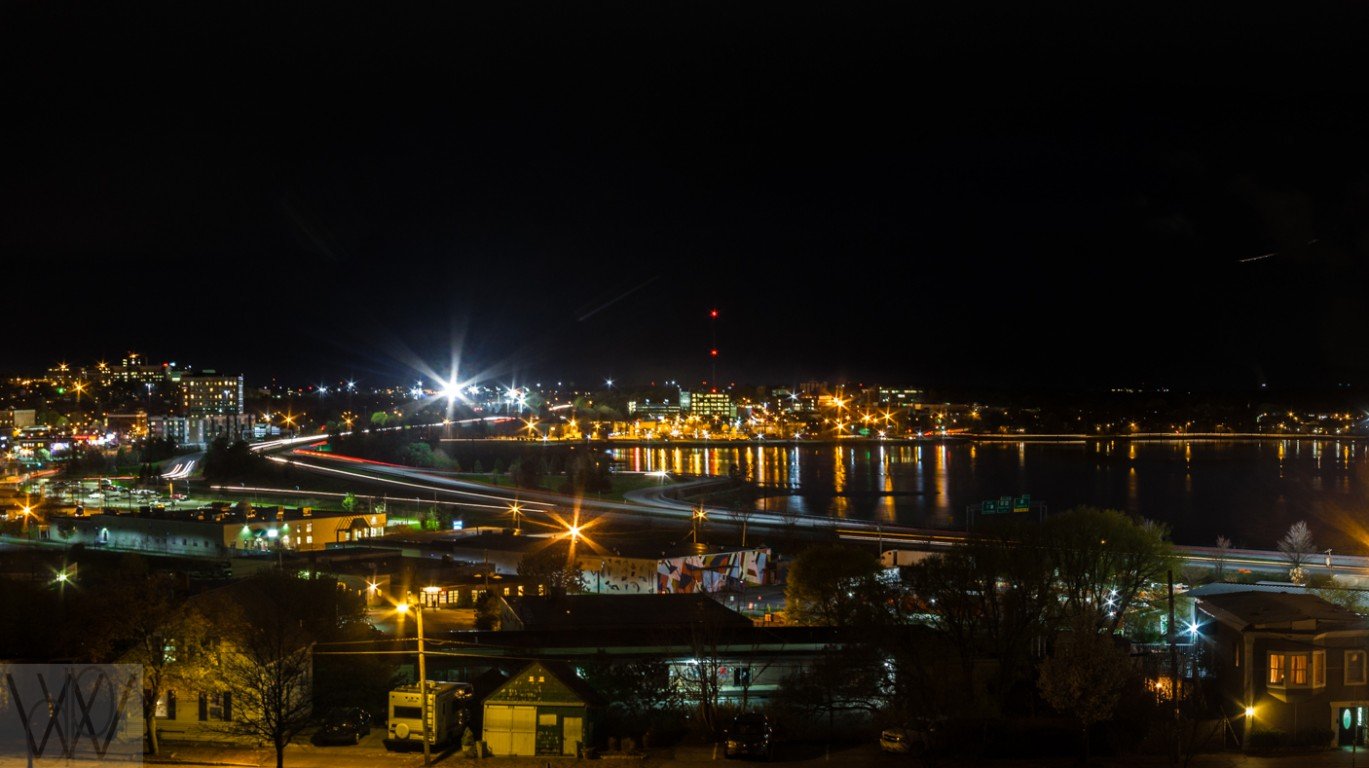
19. Maine: Portland-South Portland
> 2018 traffic fatalities per 100,000 people 8.9 per 100,000 (47 total)
> Avg. commute: 24.5 minutes
> Annual hours of delay per commuter: 28
> Avg. annual state auto insurance rate: $925
> Most dangerous road: SR-Portland Street
[in-text-ad-2]
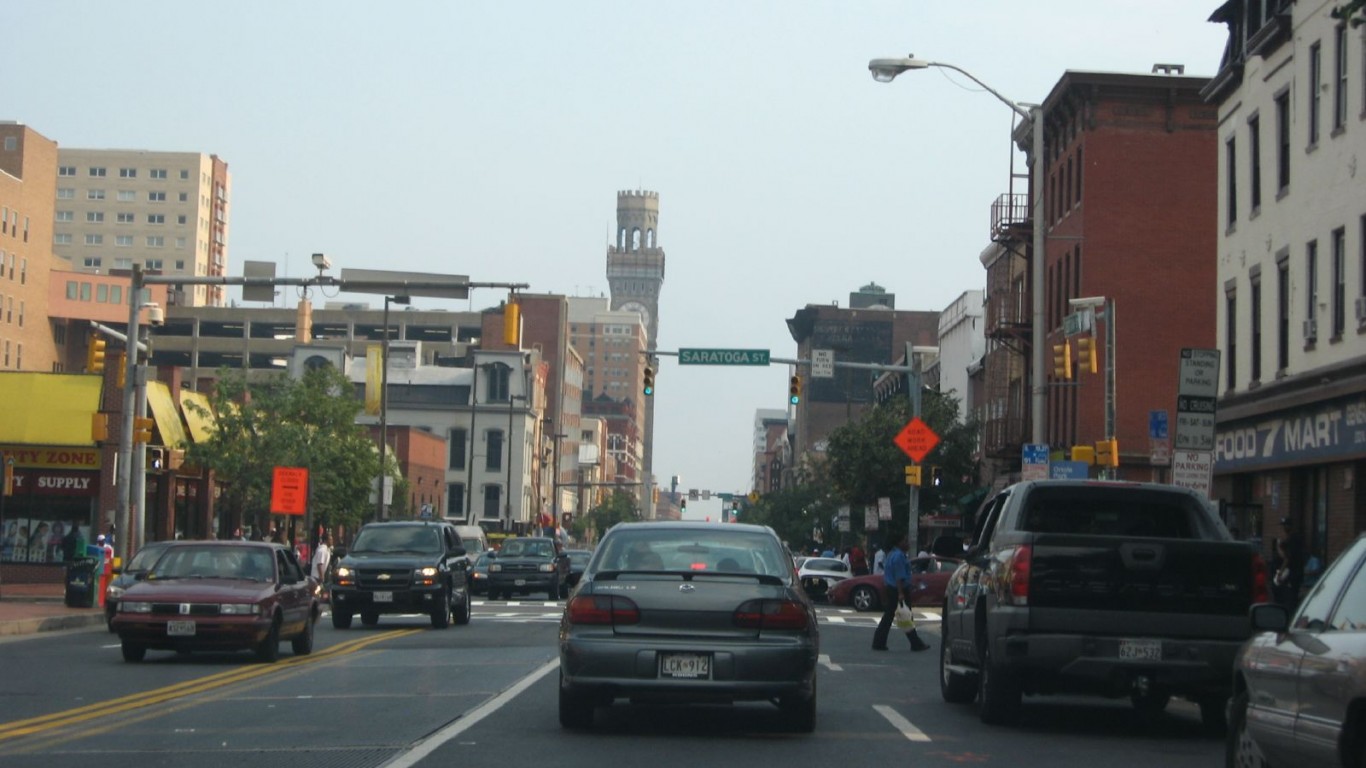
20. Maryland: Baltimore-Columbia-Towson
> 2018 traffic fatalities per 100,000 people 8.0 per 100,000 (222 total)
> Avg. commute: 31.8 minutes
> Annual hours of delay per commuter: 59
> Avg. annual state auto insurance rate: $1,390
> Most dangerous road: I-695
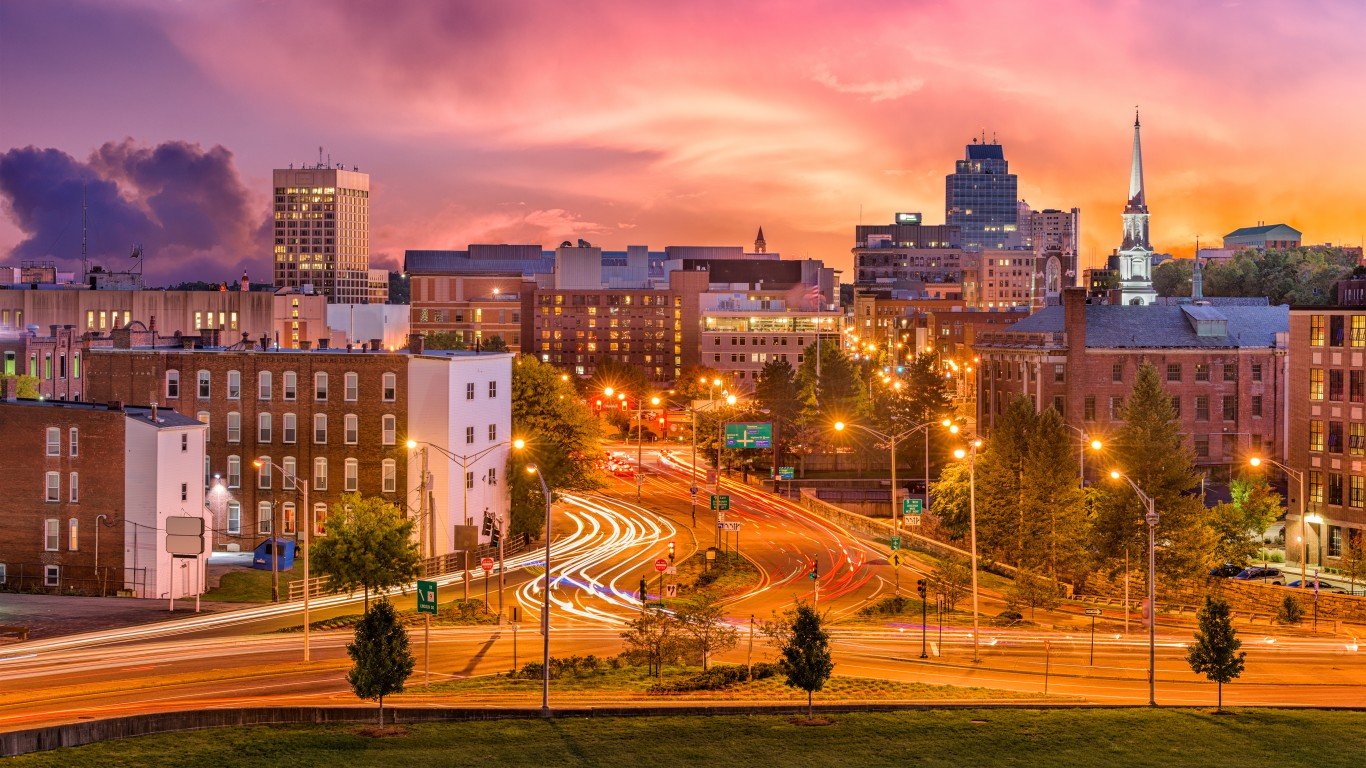
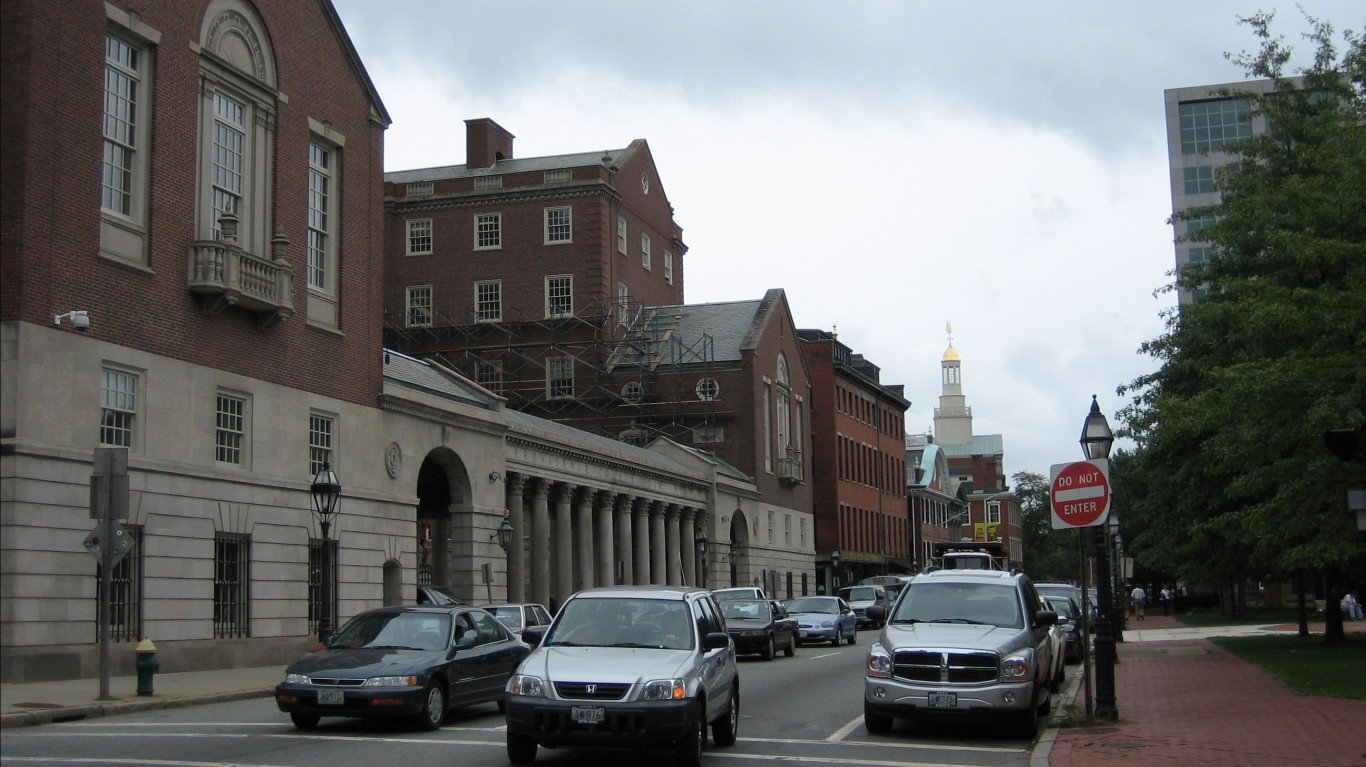
21. Massachusetts: Worcester
> 2018 traffic fatalities per 100,000 people 8.4 per 100,000 (79 total)
> Avg. commute: 30.2 minutes
> Annual hours of delay per commuter: N/A
> Avg. annual state auto insurance rate: $1,191
> Most dangerous road: I-290
[in-text-ad]
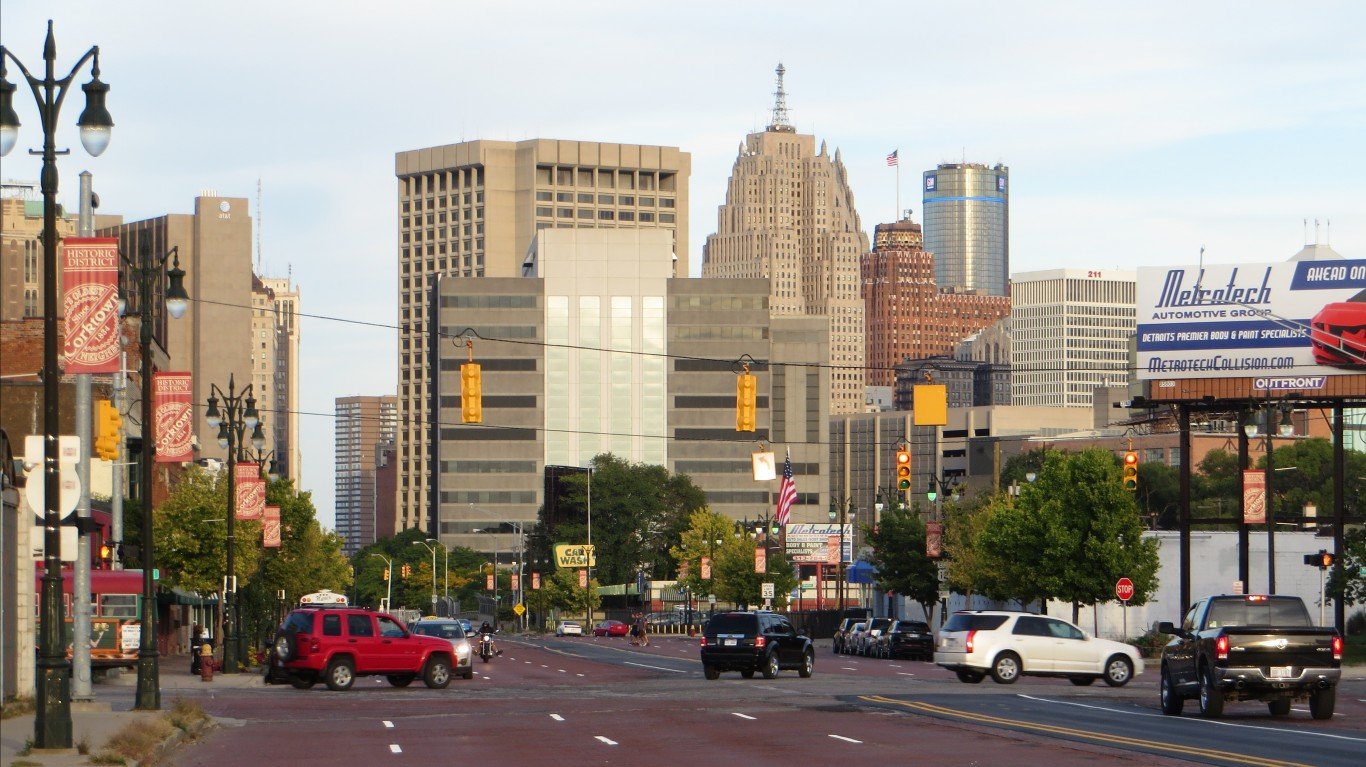
22. Michigan: Detroit-Warren-Dearborn
> 2018 traffic fatalities per 100,000 people 7.3 per 100,000 (315 total)
> Avg. commute: 27.3 minutes
> Annual hours of delay per commuter: 60
> Avg. annual state auto insurance rate: $2,484
> Most dangerous road: I-94
[recirclink id=596831]
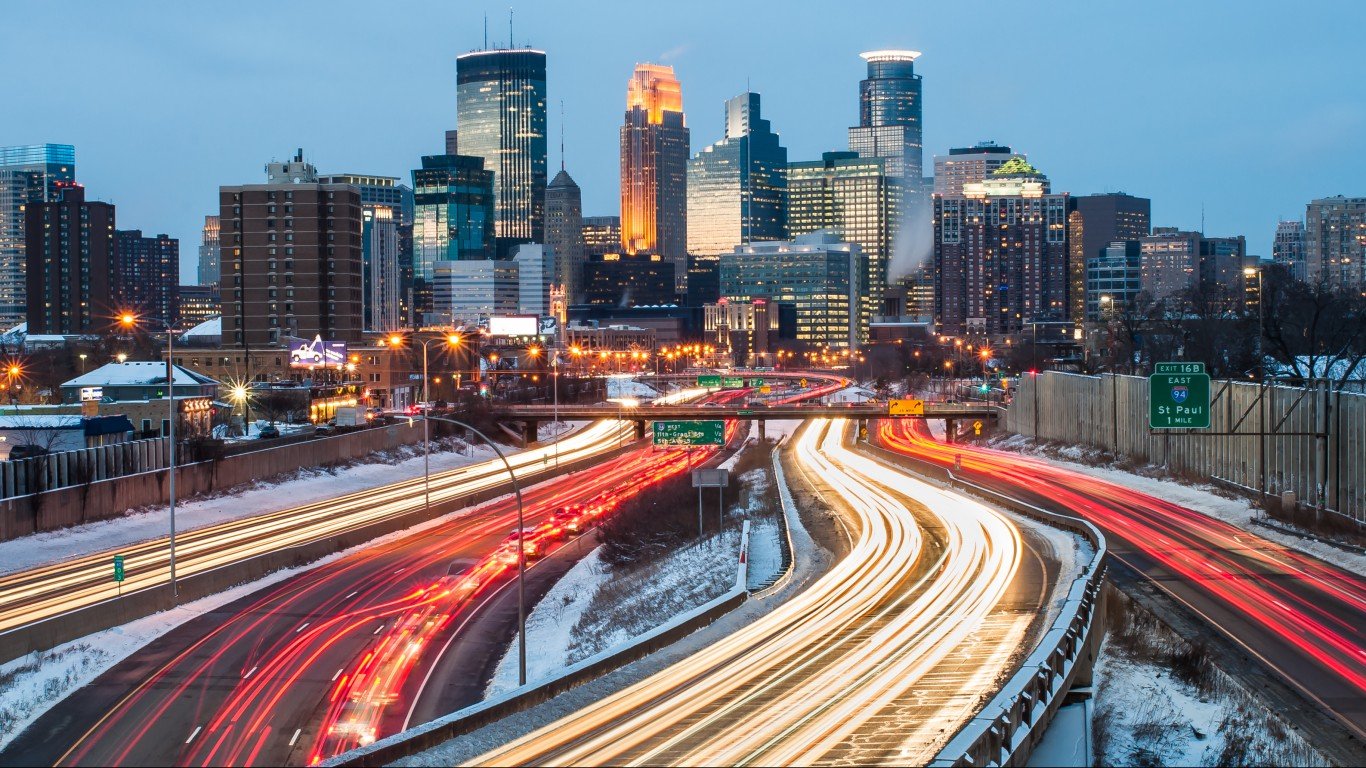
23. Minnesota: Minneapolis-St. Paul-Bloomington
> 2018 traffic fatalities per 100,000 people 5.3 per 100,000 (185 total)
> Avg. commute: 25.5 minutes
> Annual hours of delay per commuter: N/A
> Avg. annual state auto insurance rate: $1,187
> Most dangerous road: I-35
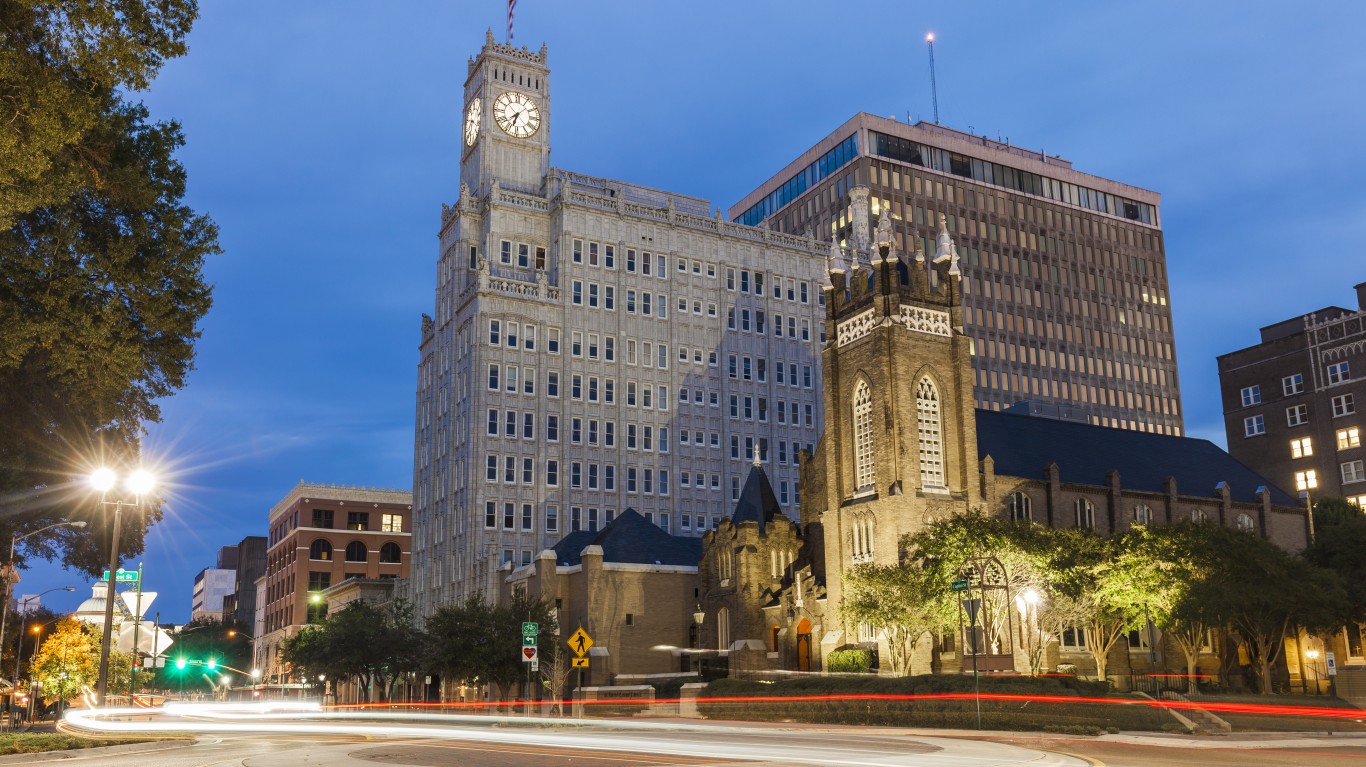
24. Mississippi: Jackson
> 2018 traffic fatalities per 100,000 people 17.8 per 100,000 (106 total)
> Avg. commute: 24.6 minutes
> Annual hours of delay per commuter: 42
> Avg. annual state auto insurance rate: $1,323
> Most dangerous road: I-55
[in-text-ad-2]
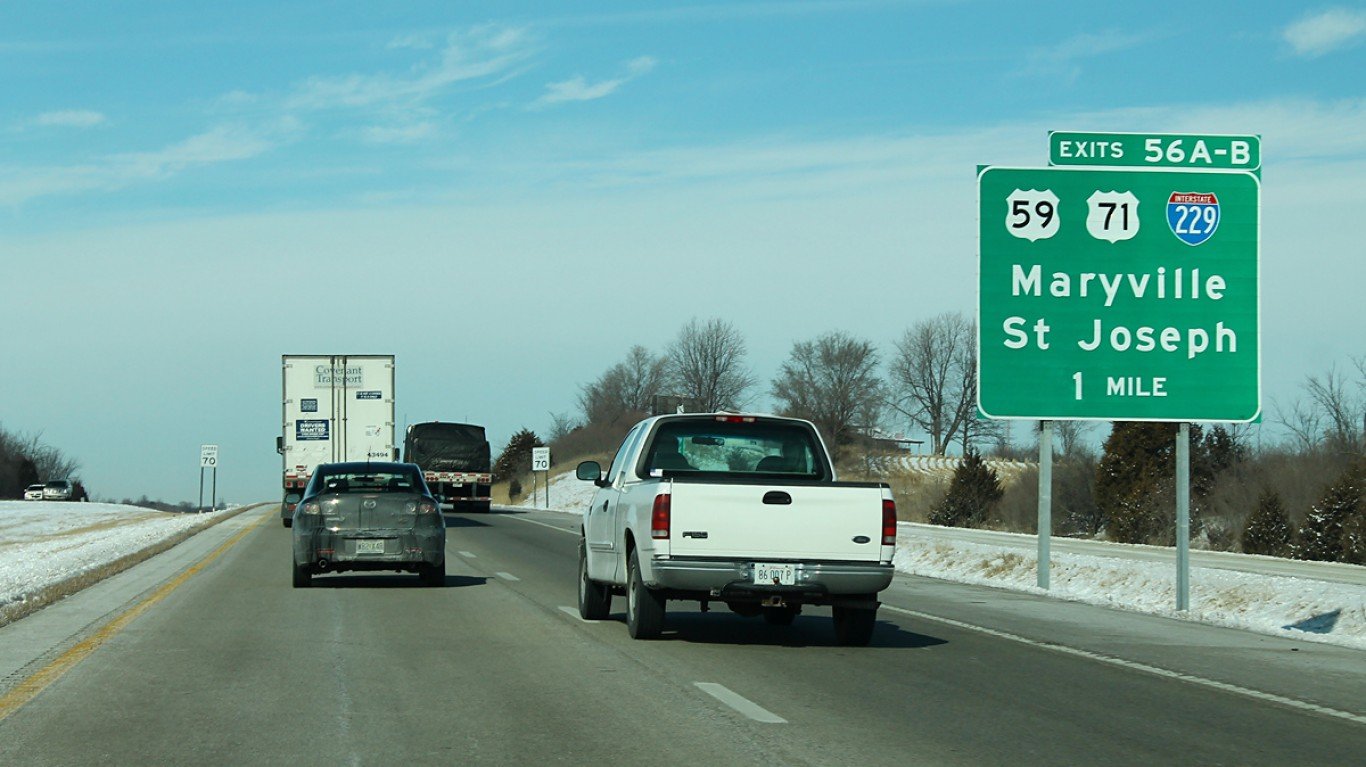
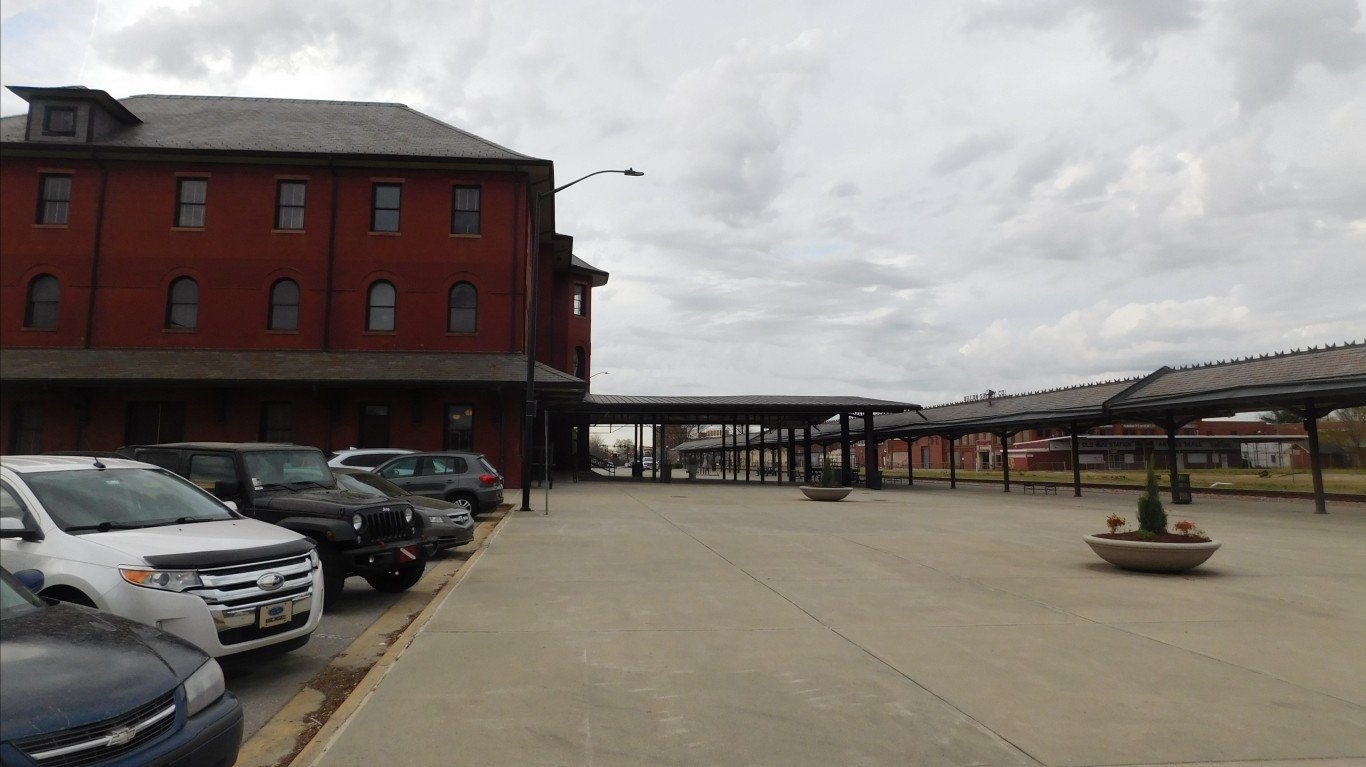
25. Missouri: St. Joseph
> 2018 traffic fatalities per 100,000 people 18.9 per 100,000 (24 total)
> Avg. commute: 19.0 minutes
> Annual hours of delay per commuter: N/A
> Avg. annual state auto insurance rate: $1,154
> Most dangerous road: I-29
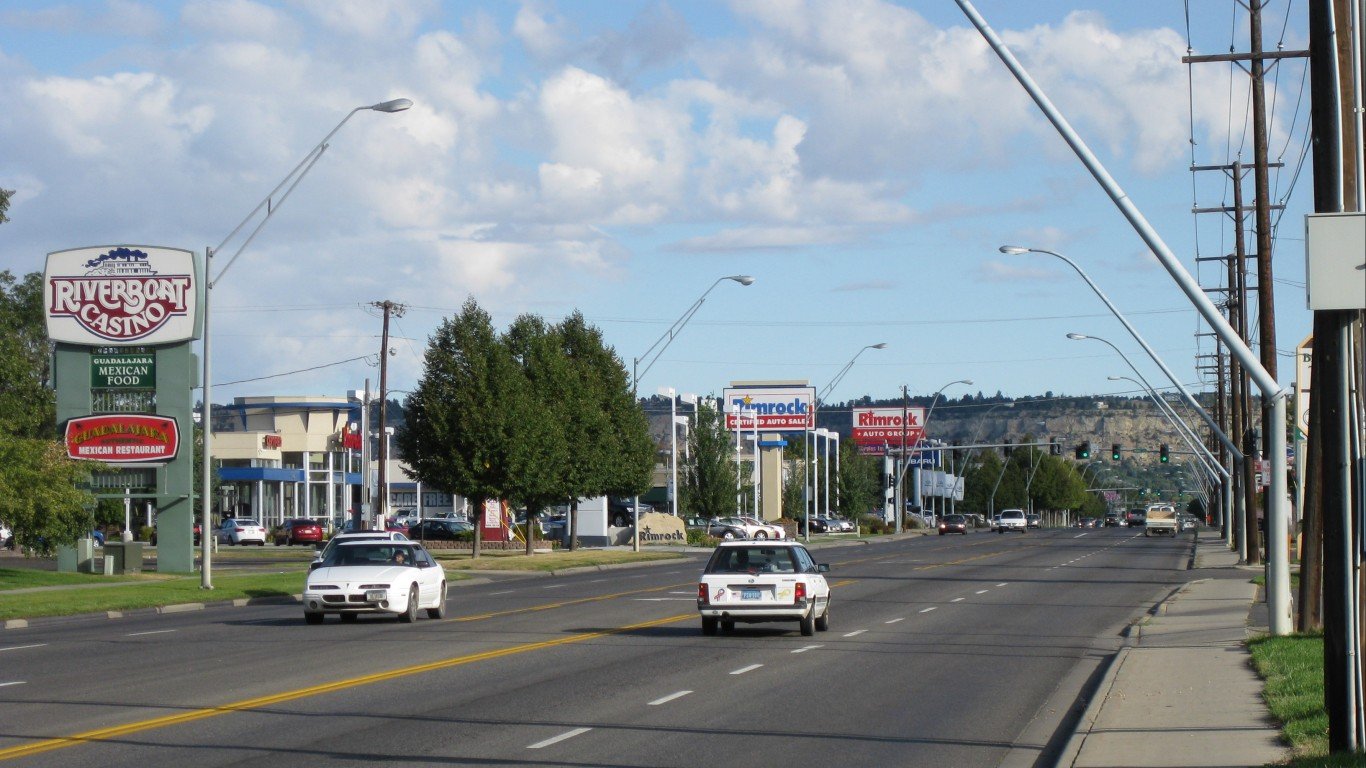
26. Montana: Billings
> 2018 traffic fatalities per 100,000 people 17.6 per 100,000 (31 total)
> Avg. commute: 20.1 minutes
> Annual hours of delay per commuter: 17
> Avg. annual state auto insurance rate: $1,224
> Most dangerous road: US-310
[in-text-ad]

27. Nebraska: Omaha-Council Bluffs
> 2018 traffic fatalities per 100,000 people 9.5 per 100,000 (85 total)
> Avg. commute: 20.3 minutes
> Annual hours of delay per commuter: N/A
> Avg. annual state auto insurance rate: $1,113
> Most dangerous road: US-75
[recirclink id=599259]
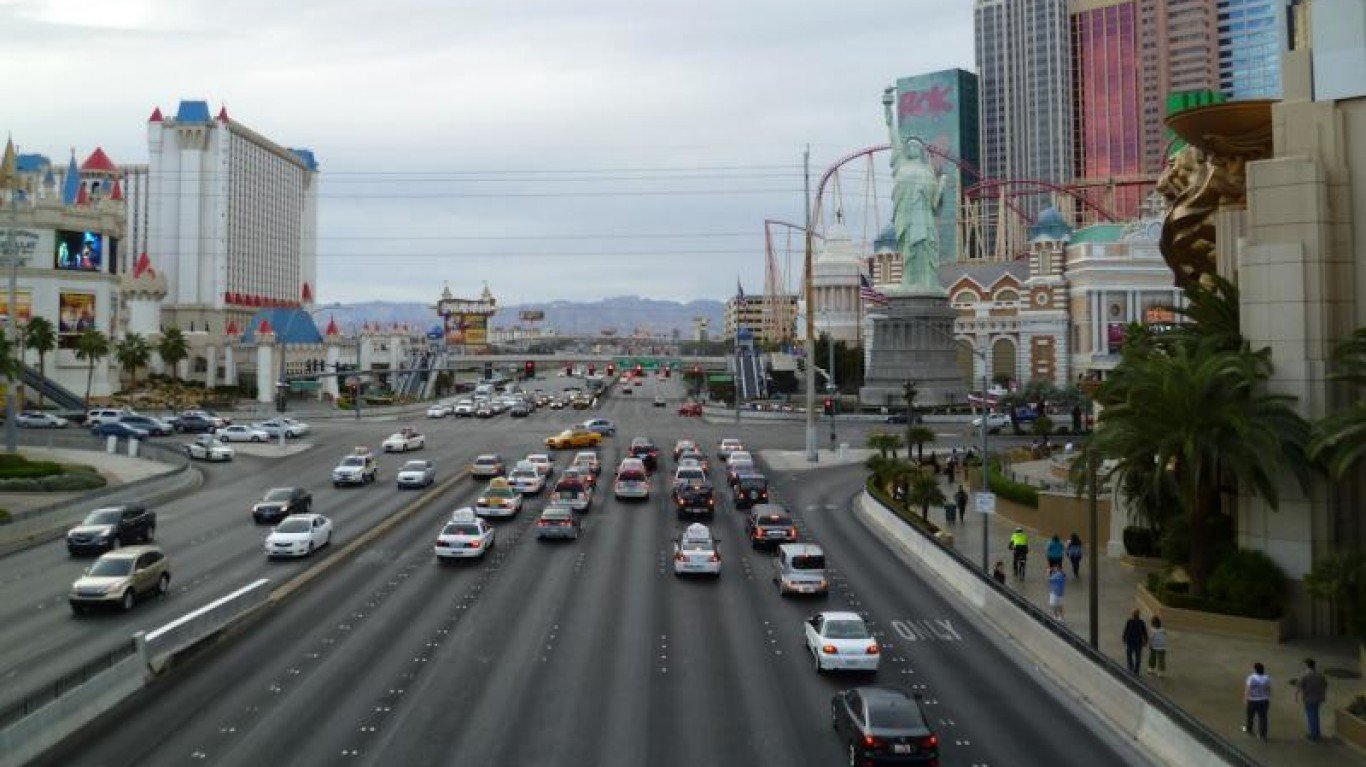
28. Nevada: Las Vegas-Henderson-Paradise
> 2018 traffic fatalities per 100,000 people 10.4 per 100,000 (220 total)
> Avg. commute: 25.4 minutes
> Annual hours of delay per commuter: N/A
> Avg. annual state auto insurance rate: $1,746
> Most dangerous road: US-95
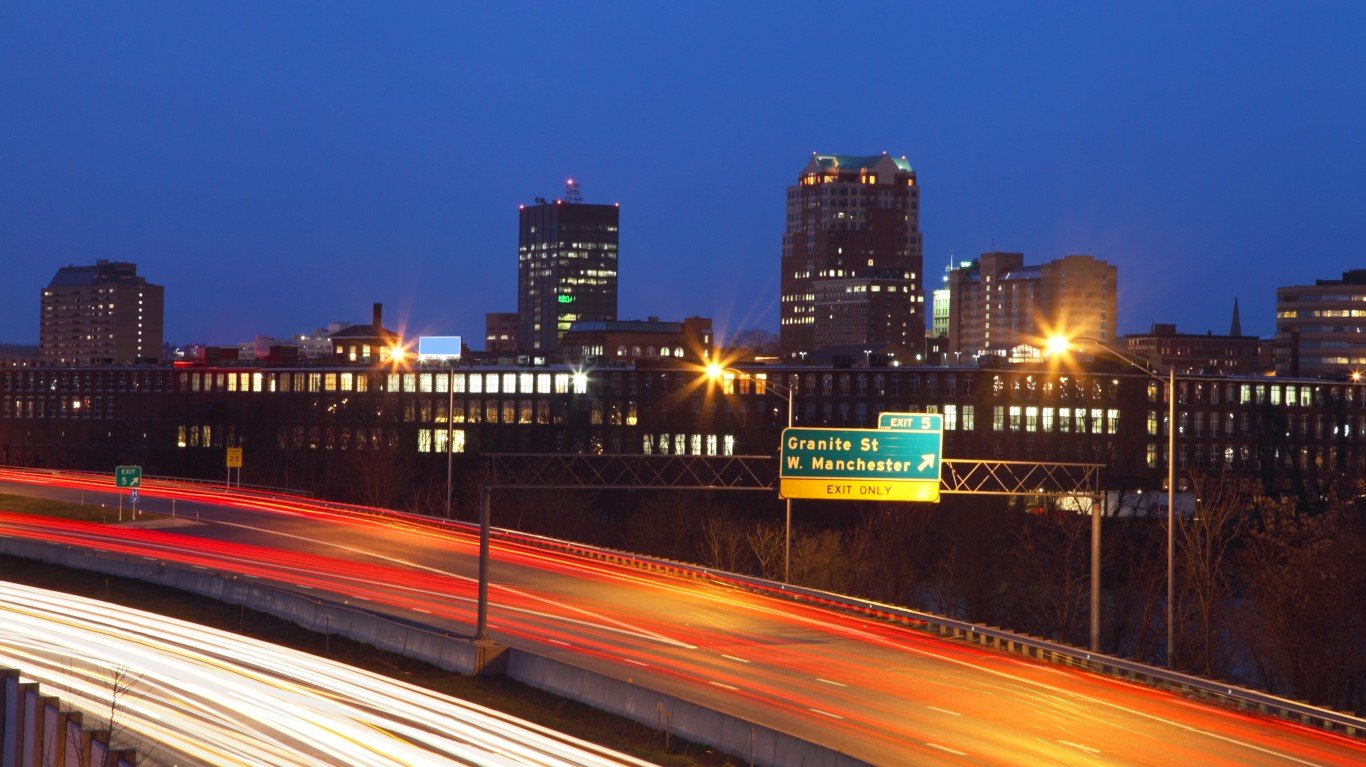
29. New Hampshire: Manchester-Nashua
> 2018 traffic fatalities per 100,000 people 6.6 per 100,000 (27 total)
> Avg. commute: 28.7 minutes
> Annual hours of delay per commuter: 22
> Avg. annual state auto insurance rate: $1,101
> Most dangerous road: Everett Turnpike
[in-text-ad-2]
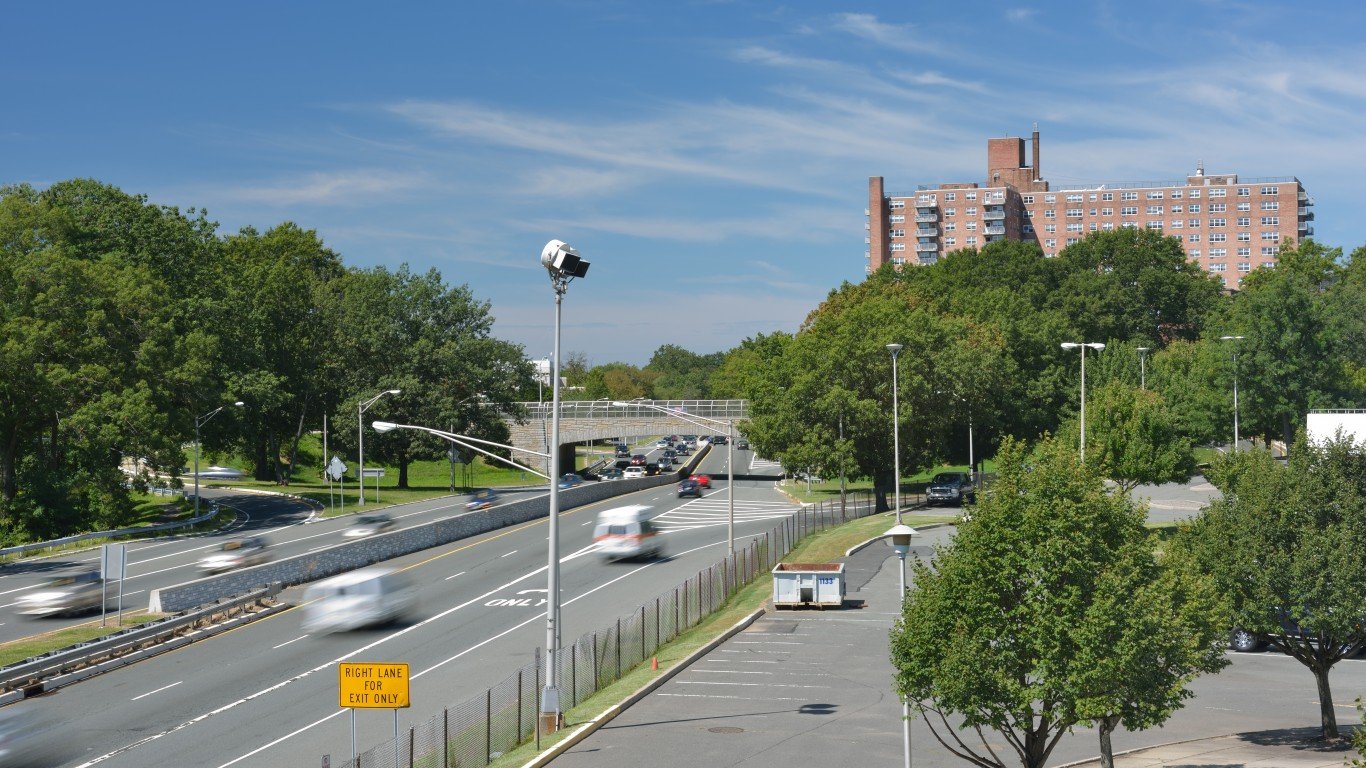
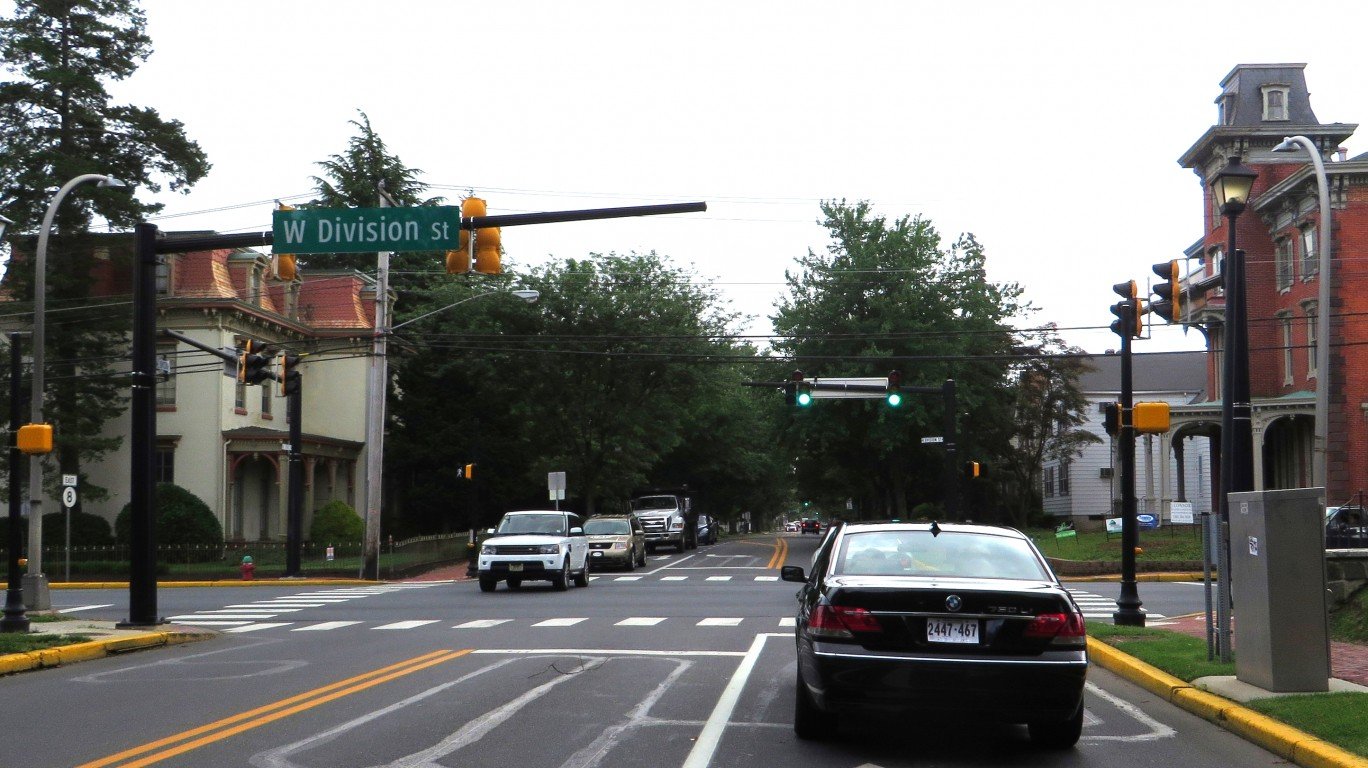
30. New Jersey: Trenton
> 2018 traffic fatalities per 100,000 people 7.8 per 100,000 (29 total)
> Avg. commute: 26.6 minutes
> Annual hours of delay per commuter: 28
> Avg. annual state auto insurance rate: $1,346
> Most dangerous road: SR-29
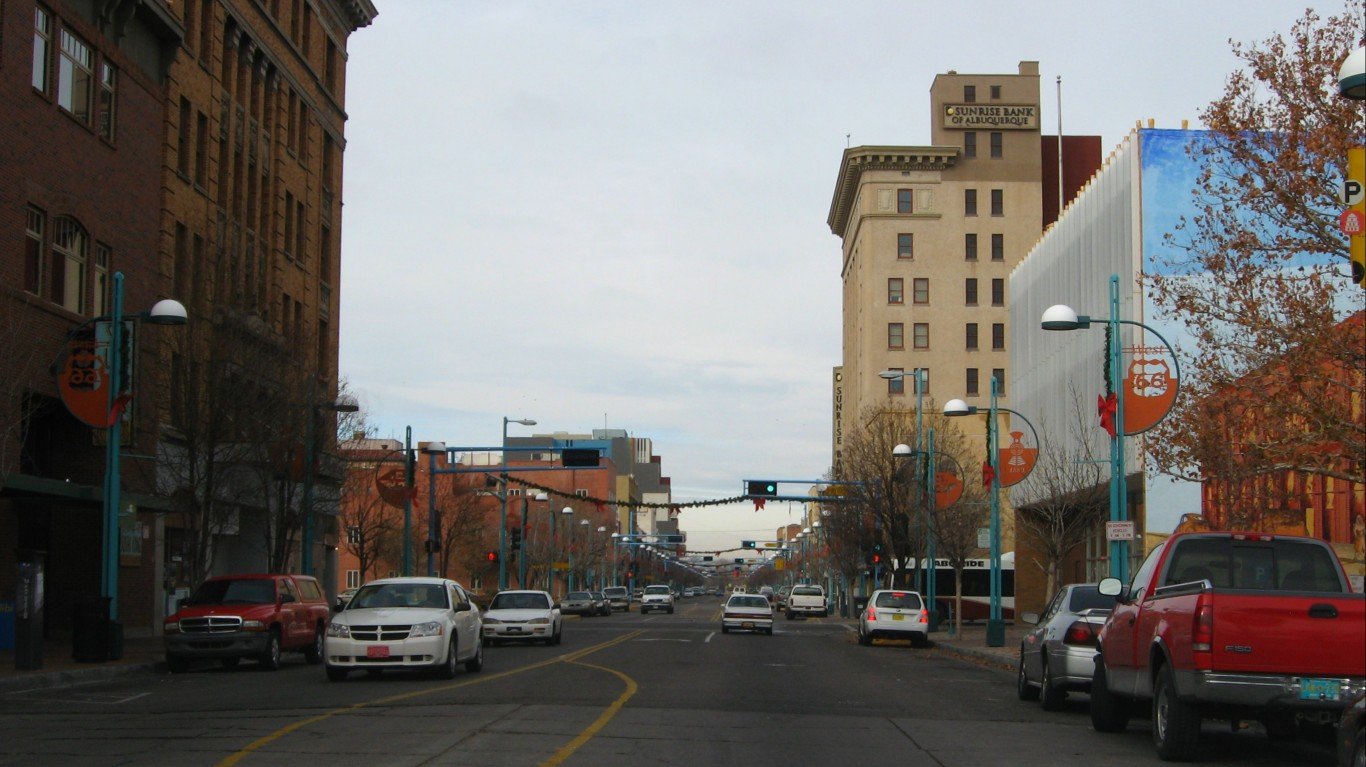
31. New Mexico: Albuquerque
> 2018 traffic fatalities per 100,000 people 15.1 per 100,000 (137 total)
> Avg. commute: 24.2 minutes
> Annual hours of delay per commuter: 41
> Avg. annual state auto insurance rate: $1,253
> Most dangerous road: I-25
[in-text-ad]

32. New York: New York-Newark-Jersey City
> 2018 traffic fatalities per 100,000 people 3.9 per 100,000 (768 total)
> Avg. commute: 37.6 minutes
> Annual hours of delay per commuter: N/A
> Avg. annual state auto insurance rate: $1,759
> Most dangerous road: SR-27
[recirclink id=599278]
33. North Carolina: Rocky Mount
> 2018 traffic fatalities per 100,000 people 27.7 per 100,000 (41 total)
> Avg. commute: 23.0 minutes
> Annual hours of delay per commuter: 18
> Avg. annual state auto insurance rate: $960
> Most dangerous road: US-64
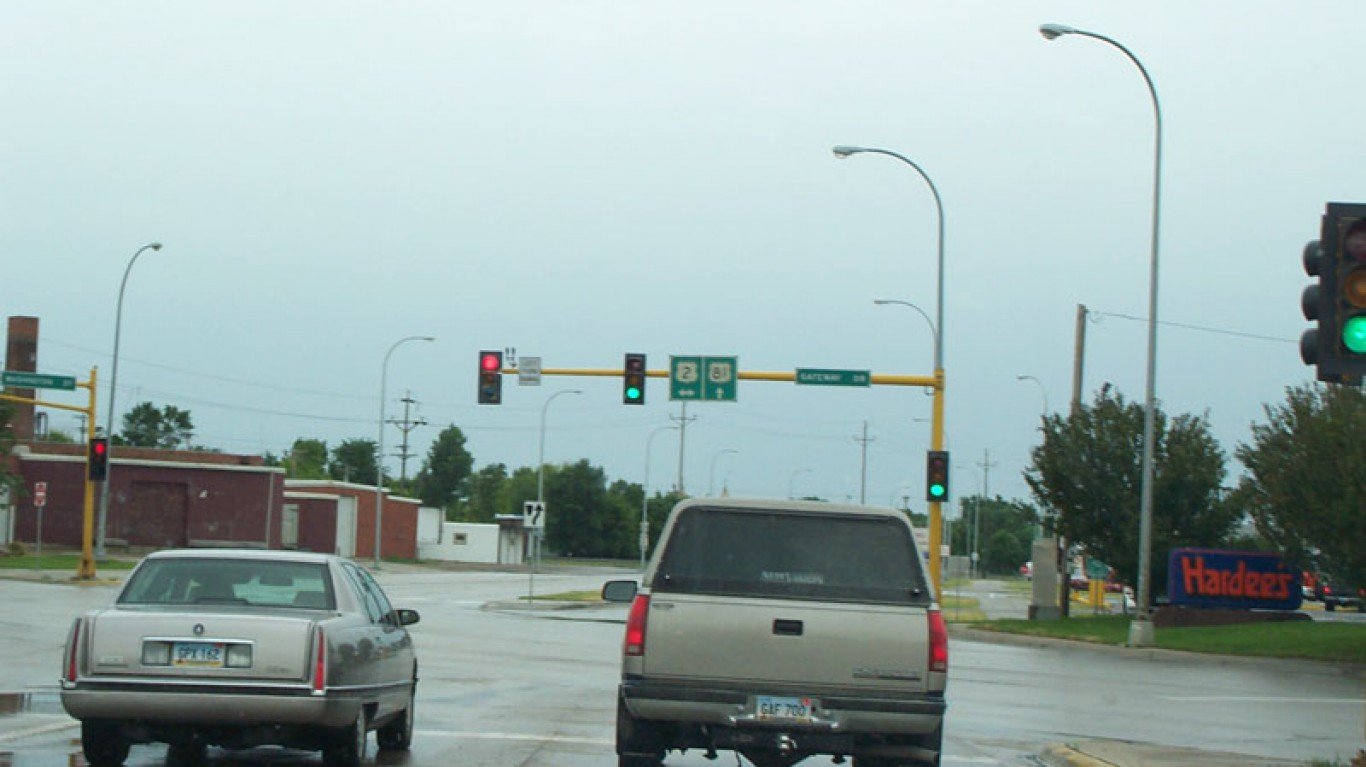
34. North Dakota: Grand Forks
> 2018 traffic fatalities per 100,000 people 16.7 per 100,000 (17 total)
> Avg. commute: 15.9 minutes
> Annual hours of delay per commuter: N/A
> Avg. annual state auto insurance rate: $1,315
> Most dangerous road: I-29
[in-text-ad-2]
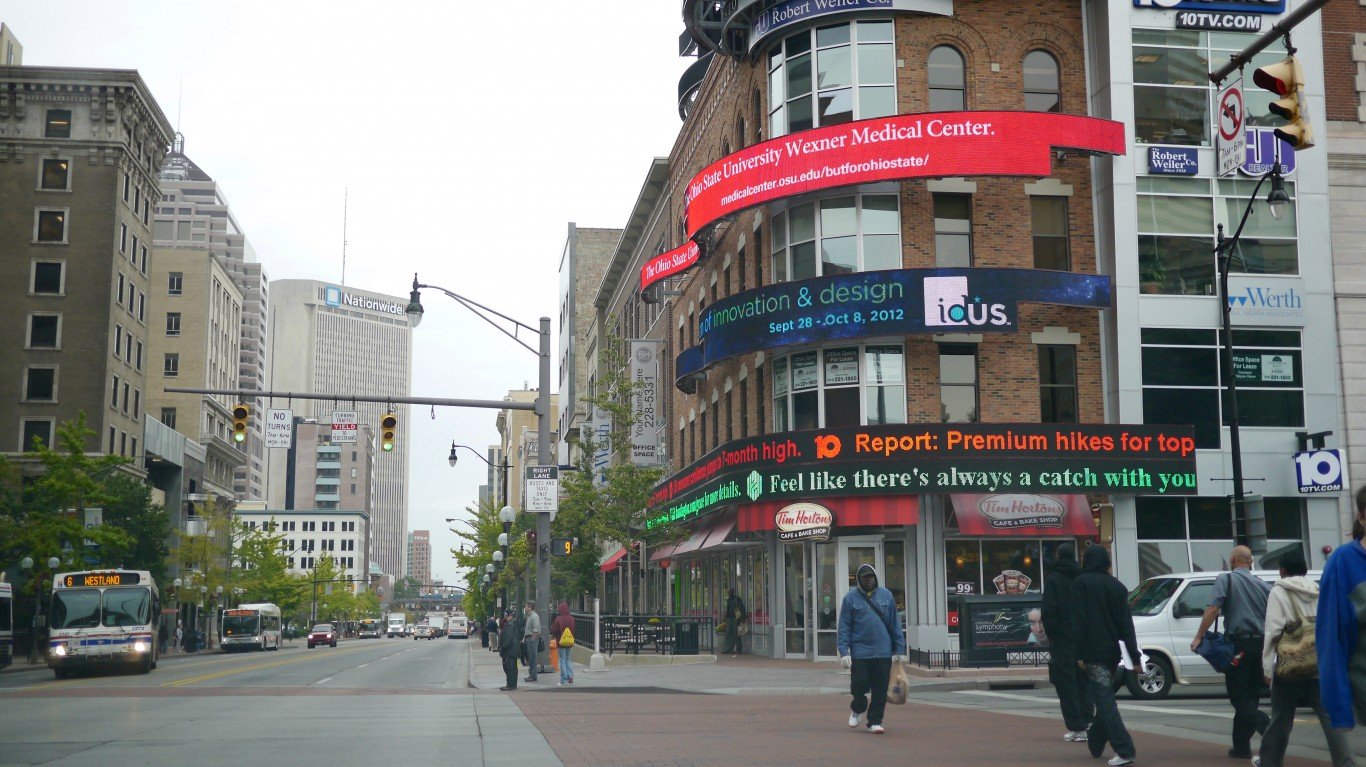
35. Ohio: Columbus
> 2018 traffic fatalities per 100,000 people 9.0 per 100,000 (182 total)
> Avg. commute: 23.8 minutes
> Annual hours of delay per commuter: 48
> Avg. annual state auto insurance rate: $952
> Most dangerous road: I-71
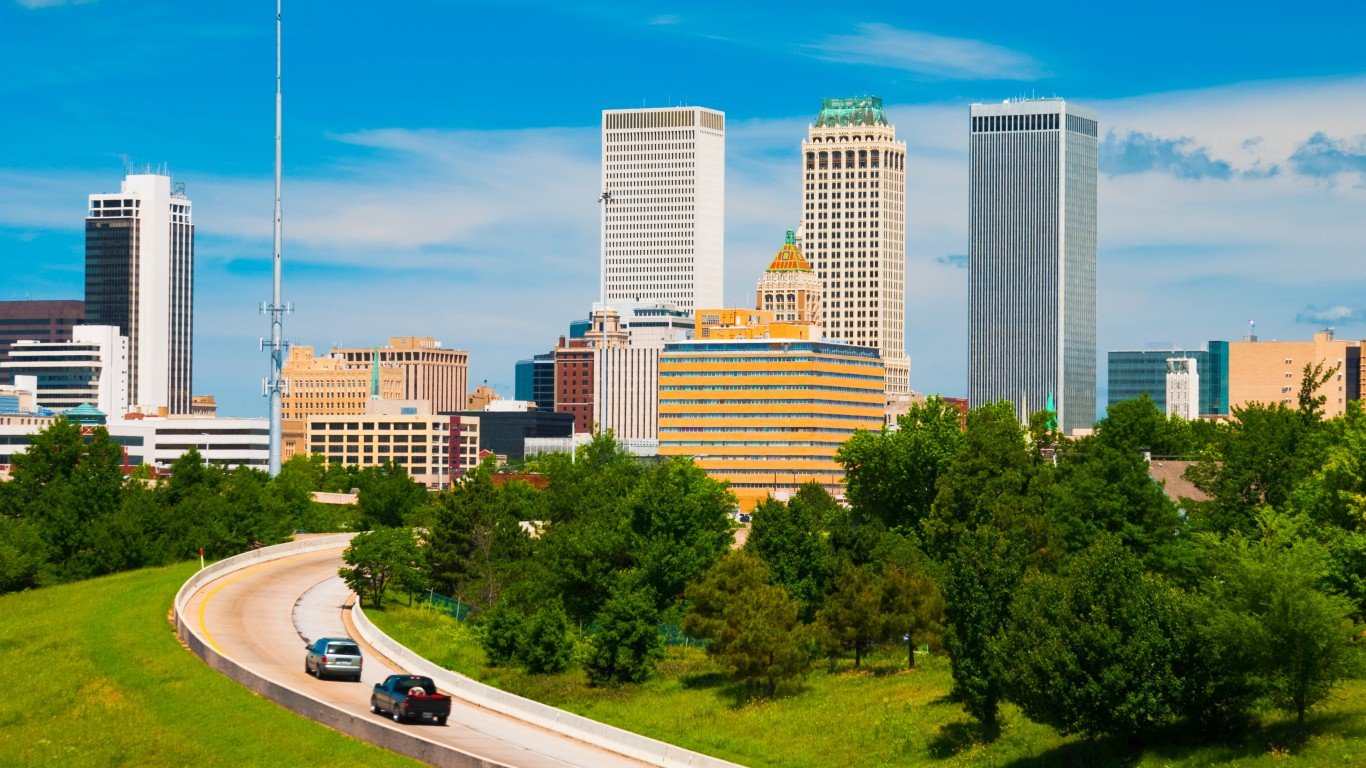
36. Oklahoma: Tulsa
> 2018 traffic fatalities per 100,000 people 14.6 per 100,000 (143 total)
> Avg. commute: 22.1 minutes
> Annual hours of delay per commuter: 46
> Avg. annual state auto insurance rate: $1,643
> Most dangerous road: I-44
[in-text-ad]
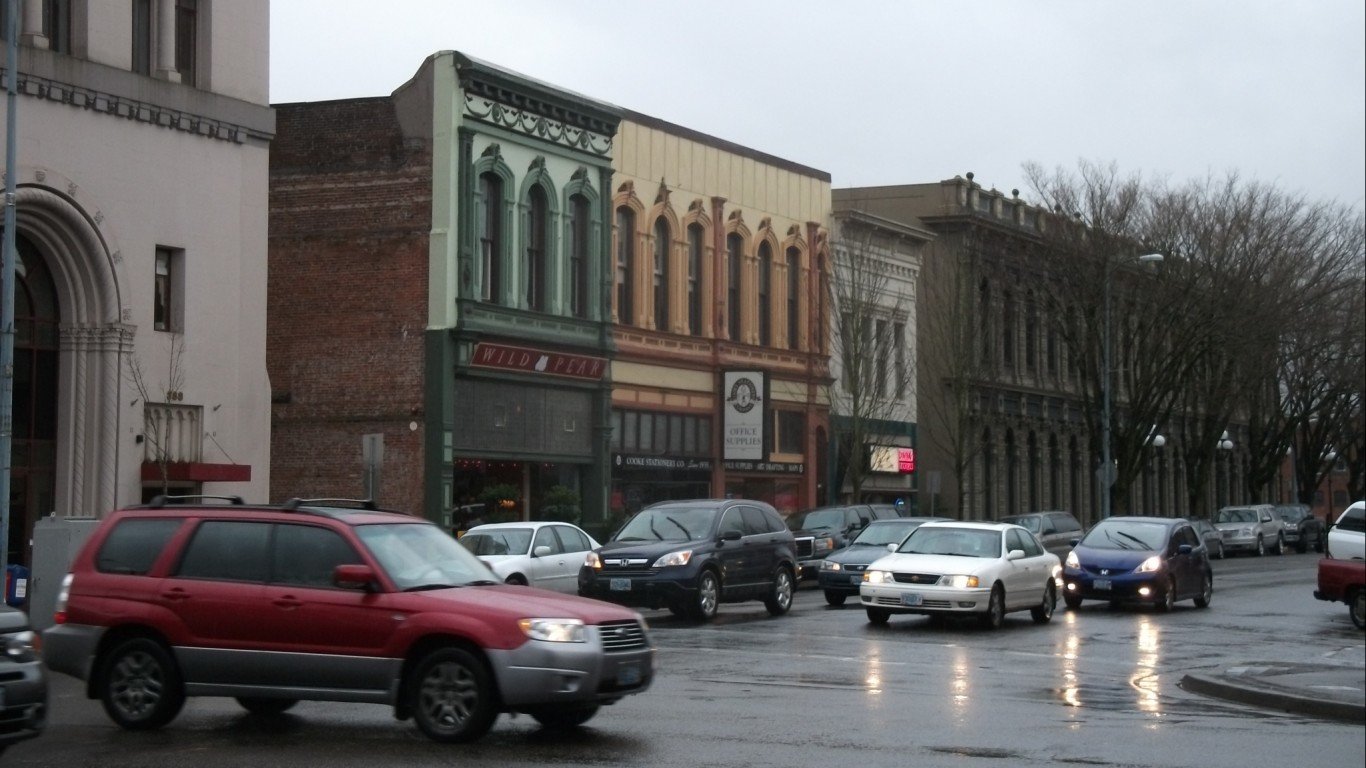
37. Oregon: Salem
> 2018 traffic fatalities per 100,000 people 12.4 per 100,000 (51 total)
> Avg. commute: 24.3 minutes
> Annual hours of delay per commuter: 41
> Avg. annual state auto insurance rate: $1,264
> Most dangerous road: SR-22 ODOT 162
[recirclink id=598092]
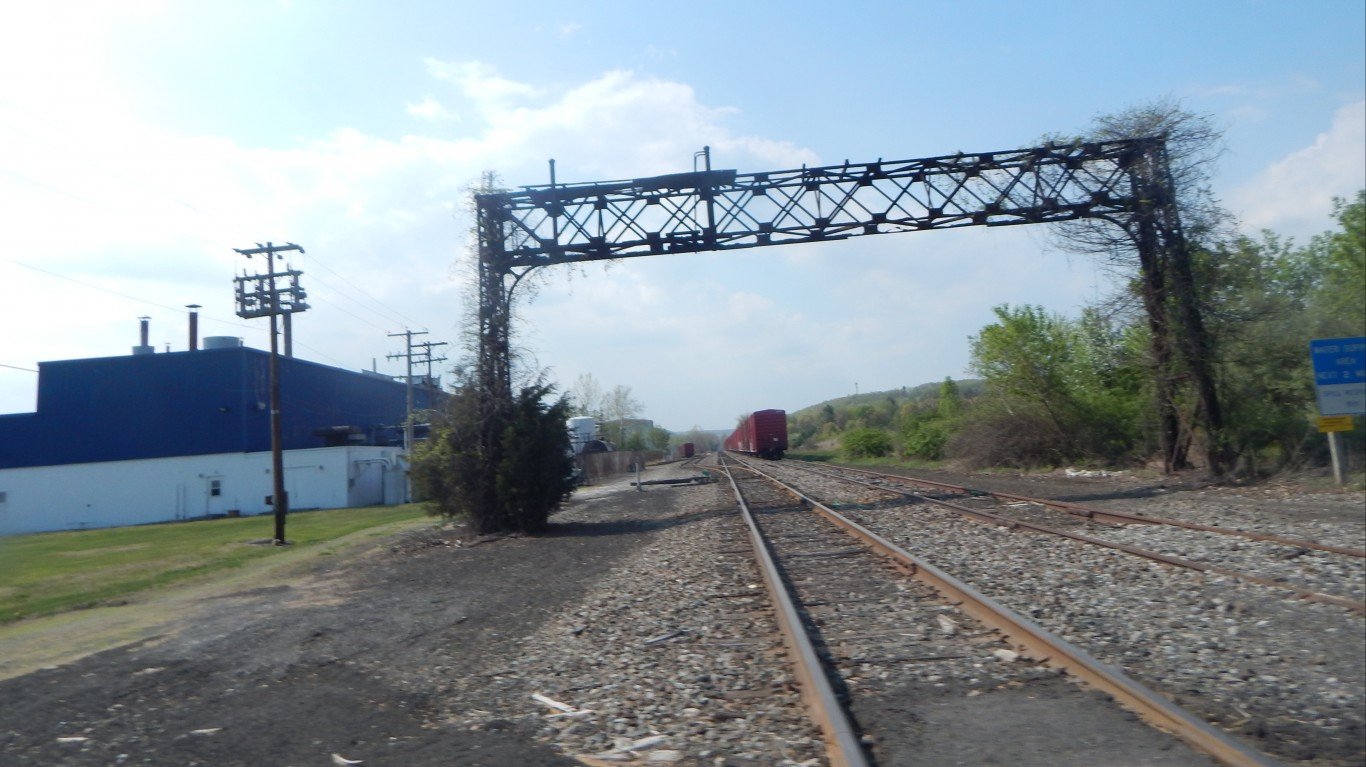
38. Pennsylvania: East Stroudsburg
> 2018 traffic fatalities per 100,000 people 12.6 per 100,000 (21 total)
> Avg. commute: 38.5 minutes
> Annual hours of delay per commuter: N/A
> Avg. annual state auto insurance rate: $1,522
> Most dangerous road: US-209 Hamilton West Rd
39. Rhode Island: Providence-Warwick
> 2018 traffic fatalities per 100,000 people 5.5 per 100,000 (89 total)
> Avg. commute: 26.0 minutes
> Annual hours of delay per commuter: 22
> Avg. annual state auto insurance rate: $1,688
> Most dangerous road: I-95 S
[in-text-ad-2]
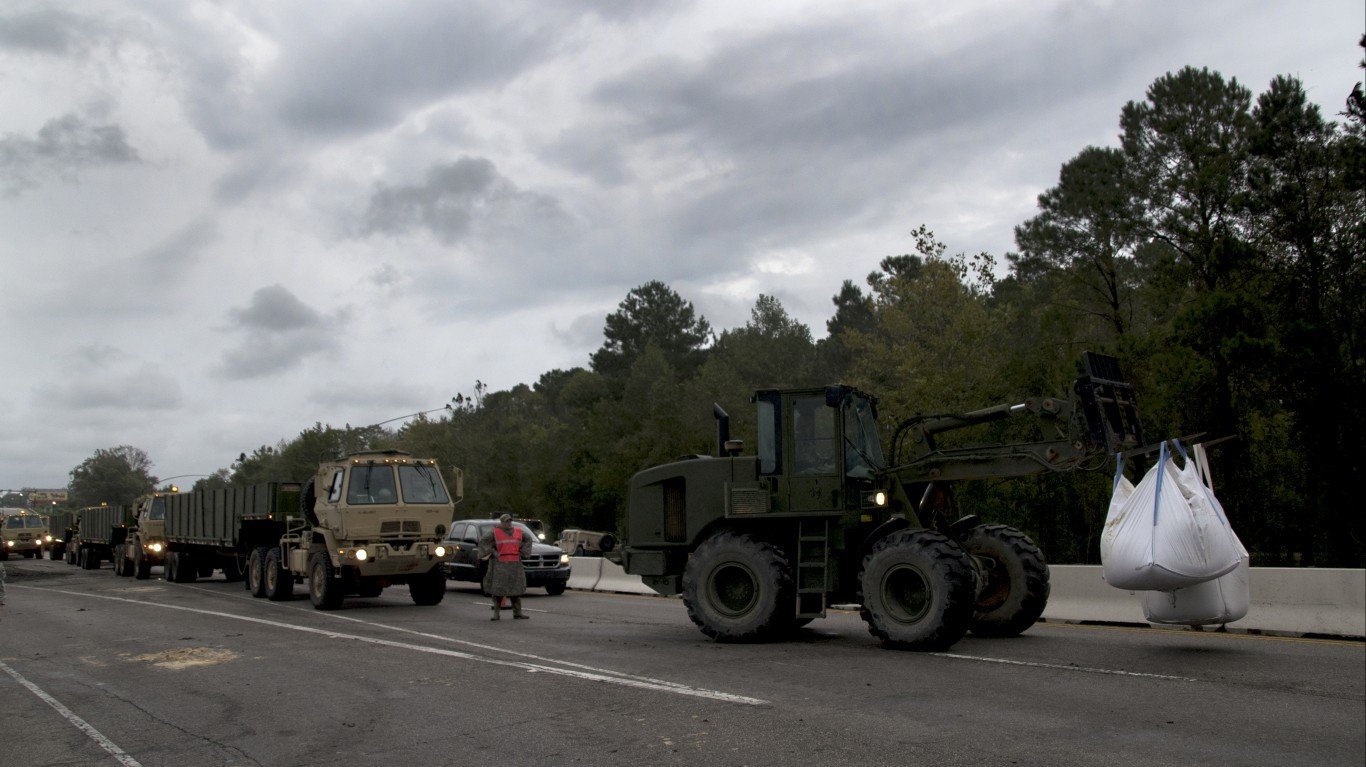
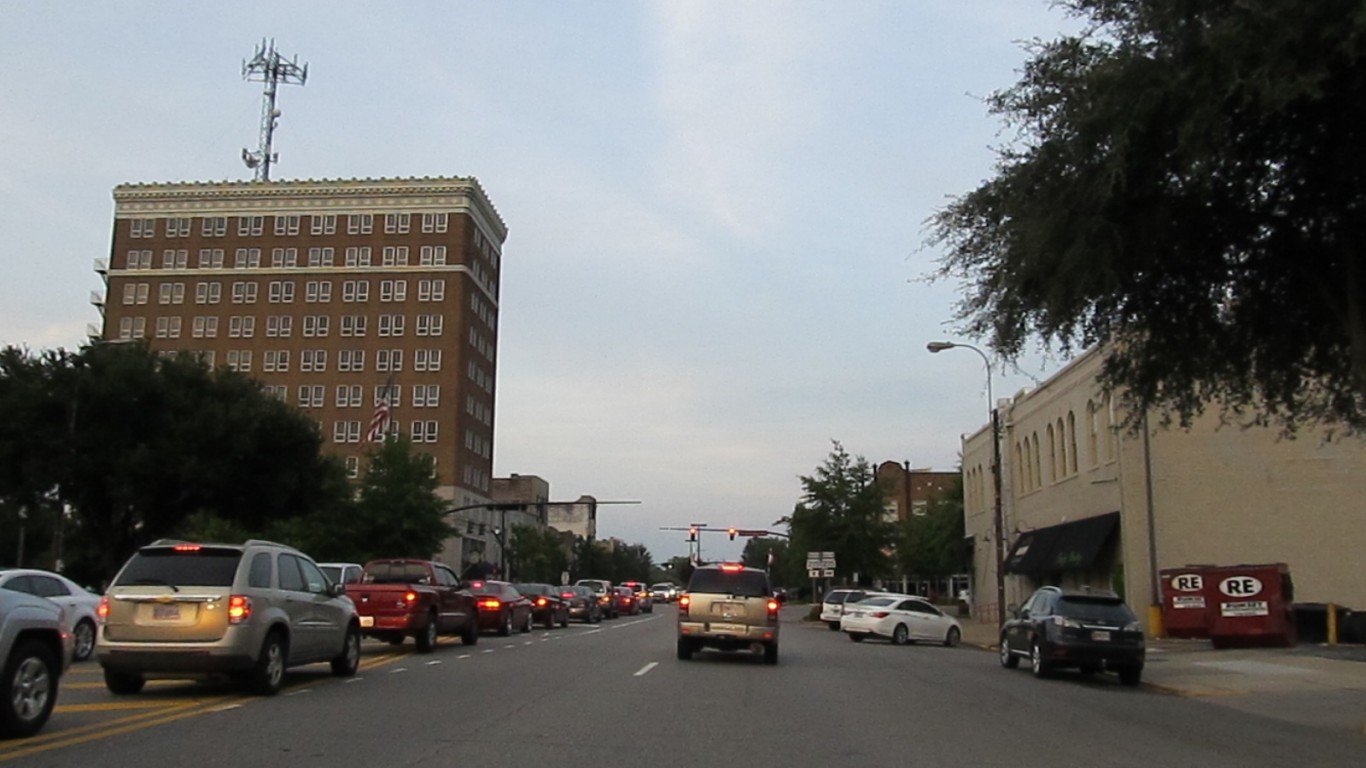
40. South Carolina: Florence
> 2018 traffic fatalities per 100,000 people 30.6 per 100,000 (63 total)
> Avg. commute: 22.1 minutes
> Annual hours of delay per commuter: 27
> Avg. annual state auto insurance rate: $1,260
> Most dangerous road: US-52
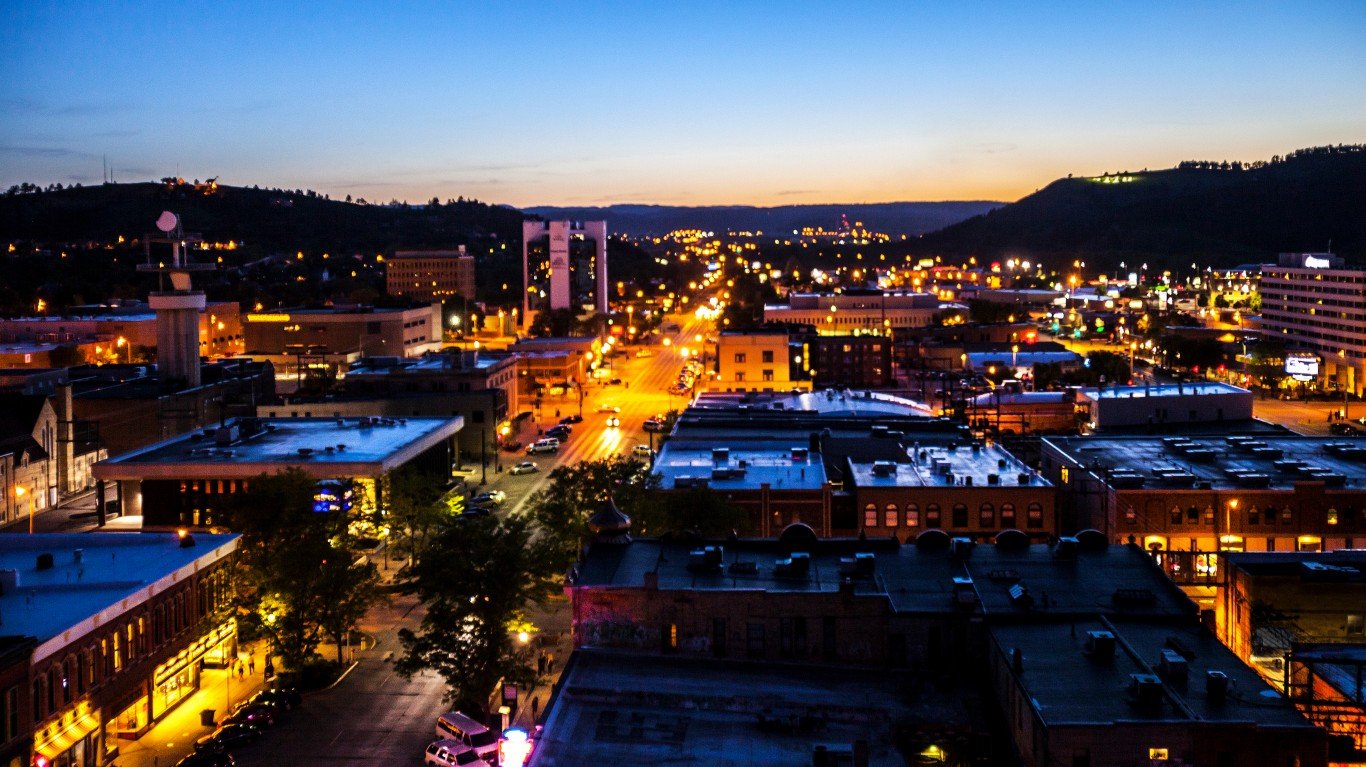
41. South Dakota: Rapid City
> 2018 traffic fatalities per 100,000 people 11.8 per 100,000 (16 total)
> Avg. commute: 19.2 minutes
> Annual hours of delay per commuter: 20
> Avg. annual state auto insurance rate: $1,059
> Most dangerous road: US-385
[in-text-ad]
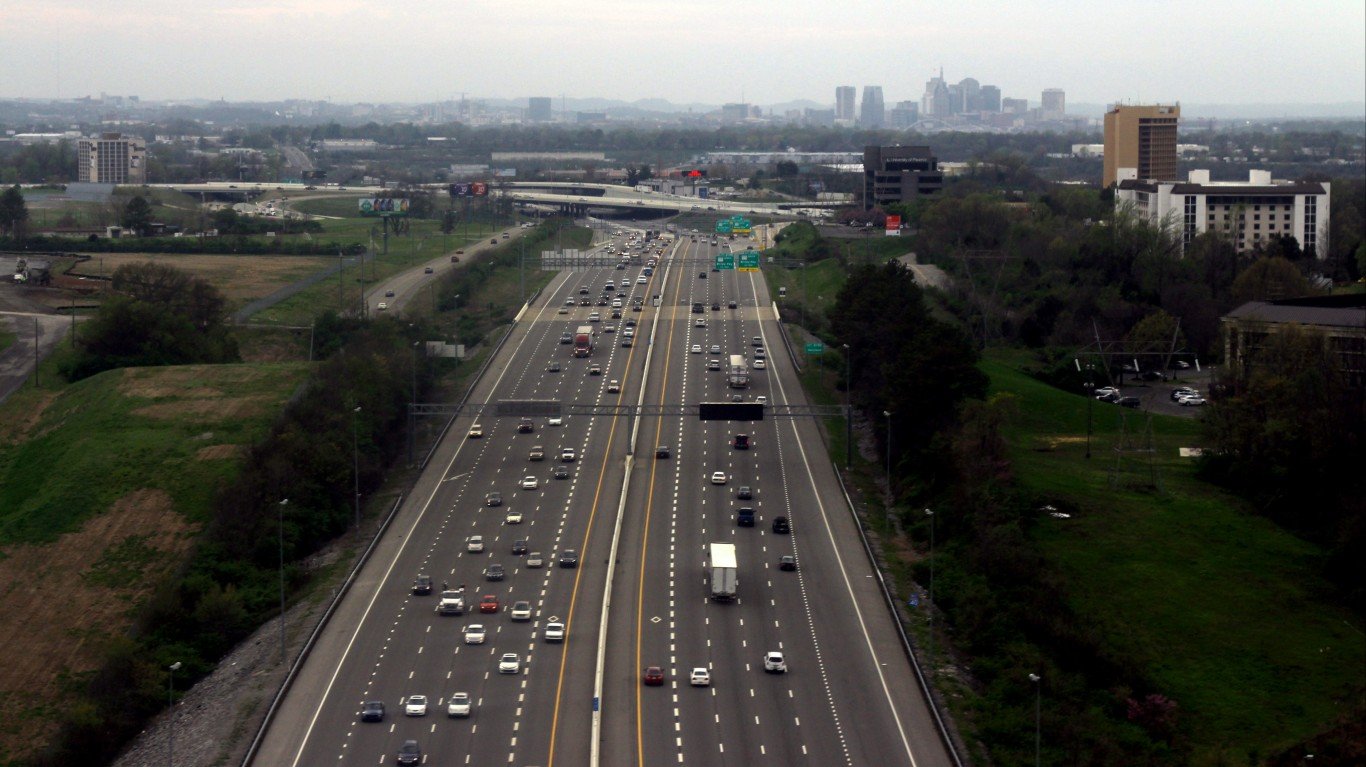
42. Tennessee: Nashville-Davidson–Murfreesboro–Franklin
> 2018 traffic fatalities per 100,000 people 12.3 per 100,000 (222 total)
> Avg. commute: 28.1 minutes
> Annual hours of delay per commuter: 58
> Avg. annual state auto insurance rate: $1,214
> Most dangerous road: I-24
[recirclink id=598077]
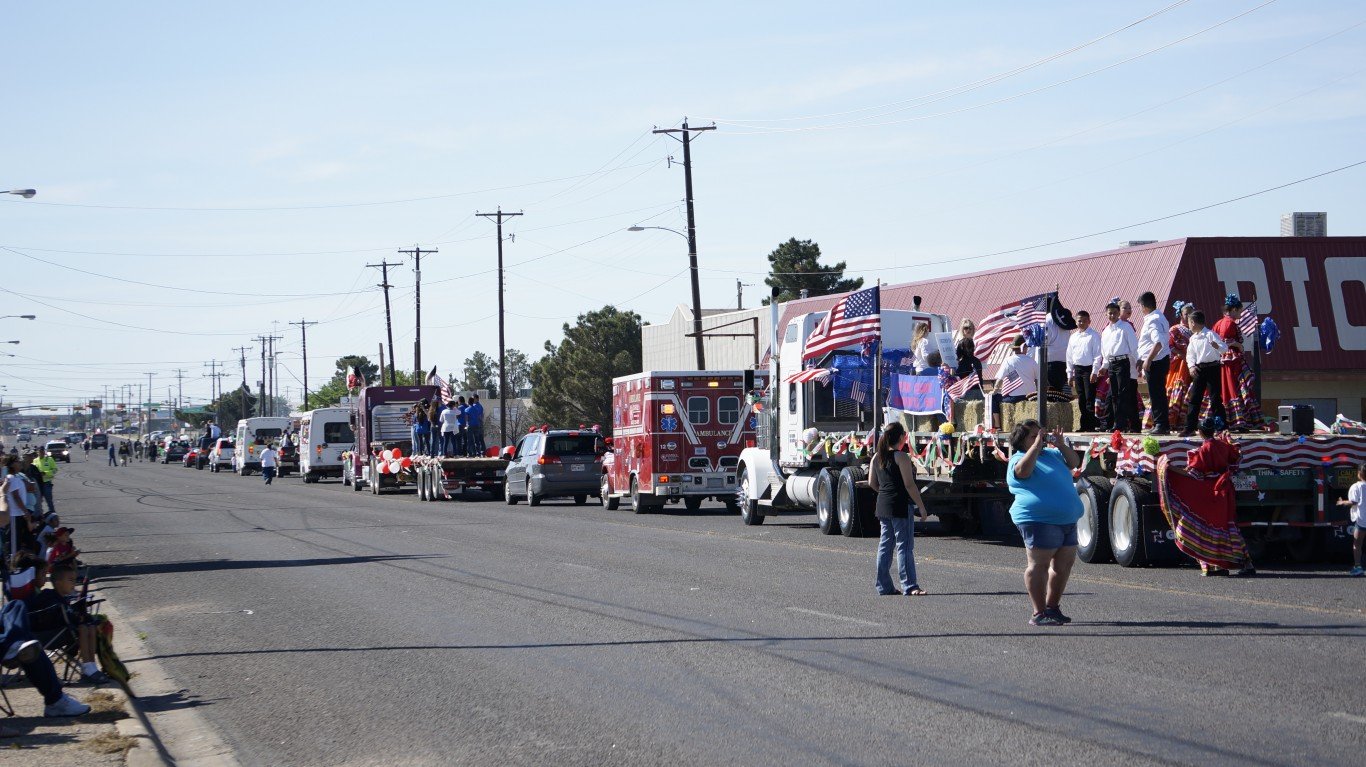
43. Texas: Odessa
> 2018 traffic fatalities per 100,000 people 36.0 per 100,000 (56 total)
> Avg. commute: 26.1 minutes
> Annual hours of delay per commuter: 31
> Avg. annual state auto insurance rate: $1,300
> Most dangerous road: I-20

44. Utah: Salt Lake City
> 2018 traffic fatalities per 100,000 people 6.5 per 100,000 (76 total)
> Avg. commute: 22.9 minutes
> Annual hours of delay per commuter: N/A
> Avg. annual state auto insurance rate: $1,199
> Most dangerous road: SR-154
[in-text-ad-2]
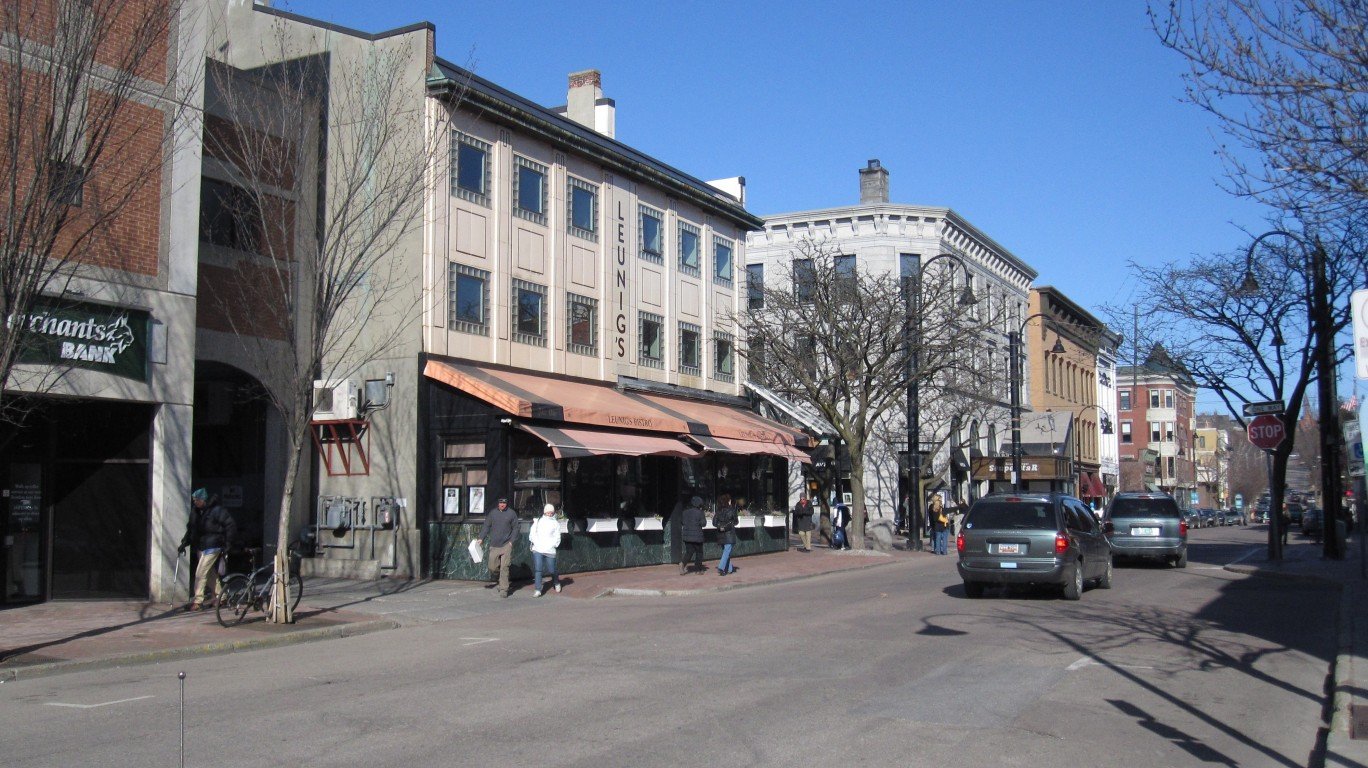
45. Vermont: Burlington-South Burlington
> 2018 traffic fatalities per 100,000 people 6.2 per 100,000 (13 total)
> Avg. commute: 22.1 minutes
> Annual hours of delay per commuter: 28
> Avg. annual state auto insurance rate: $1,199
> Most dangerous road: SR-104
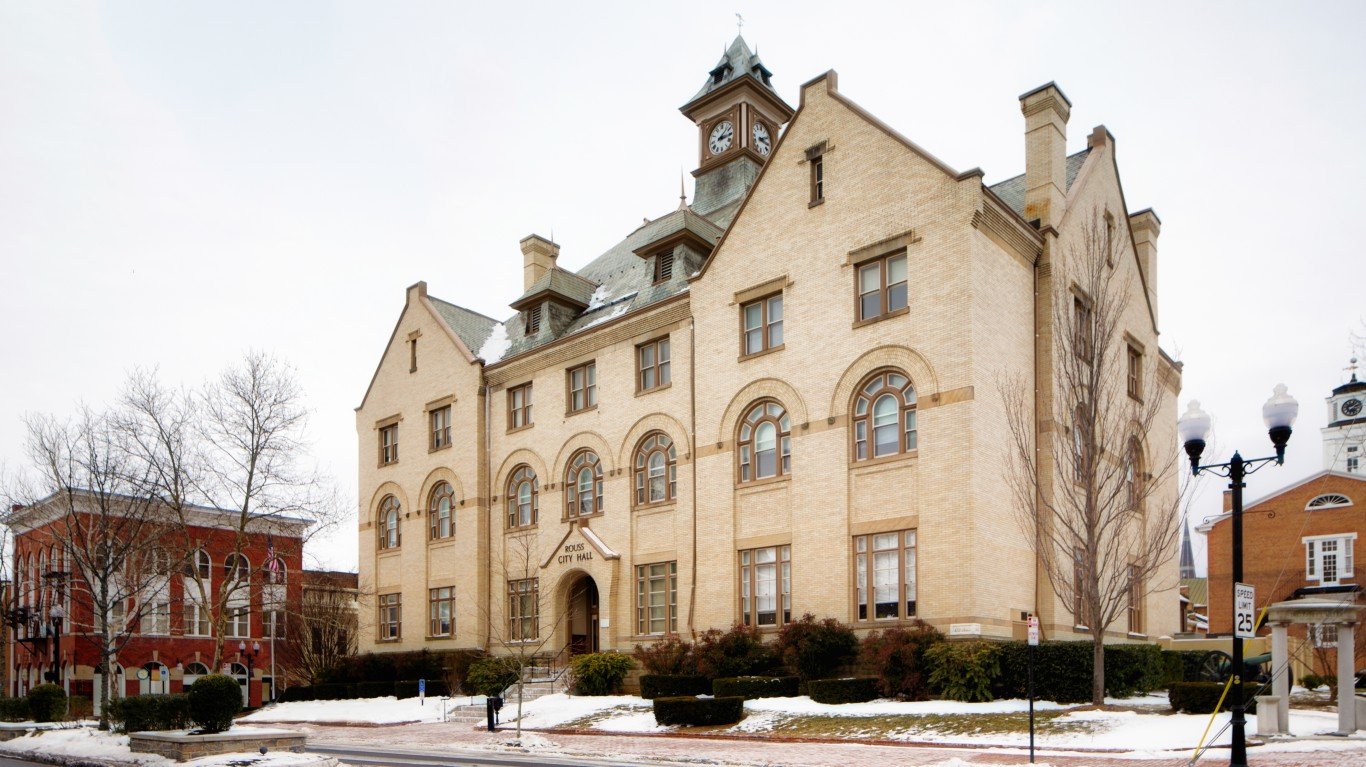
46. Virginia: Winchester
> 2018 traffic fatalities per 100,000 people 14.1 per 100,000 (19 total)
> Avg. commute: 31.6 minutes
> Annual hours of delay per commuter: 32
> Avg. annual state auto insurance rate: $972
> Most dangerous road: I-81
[in-text-ad]
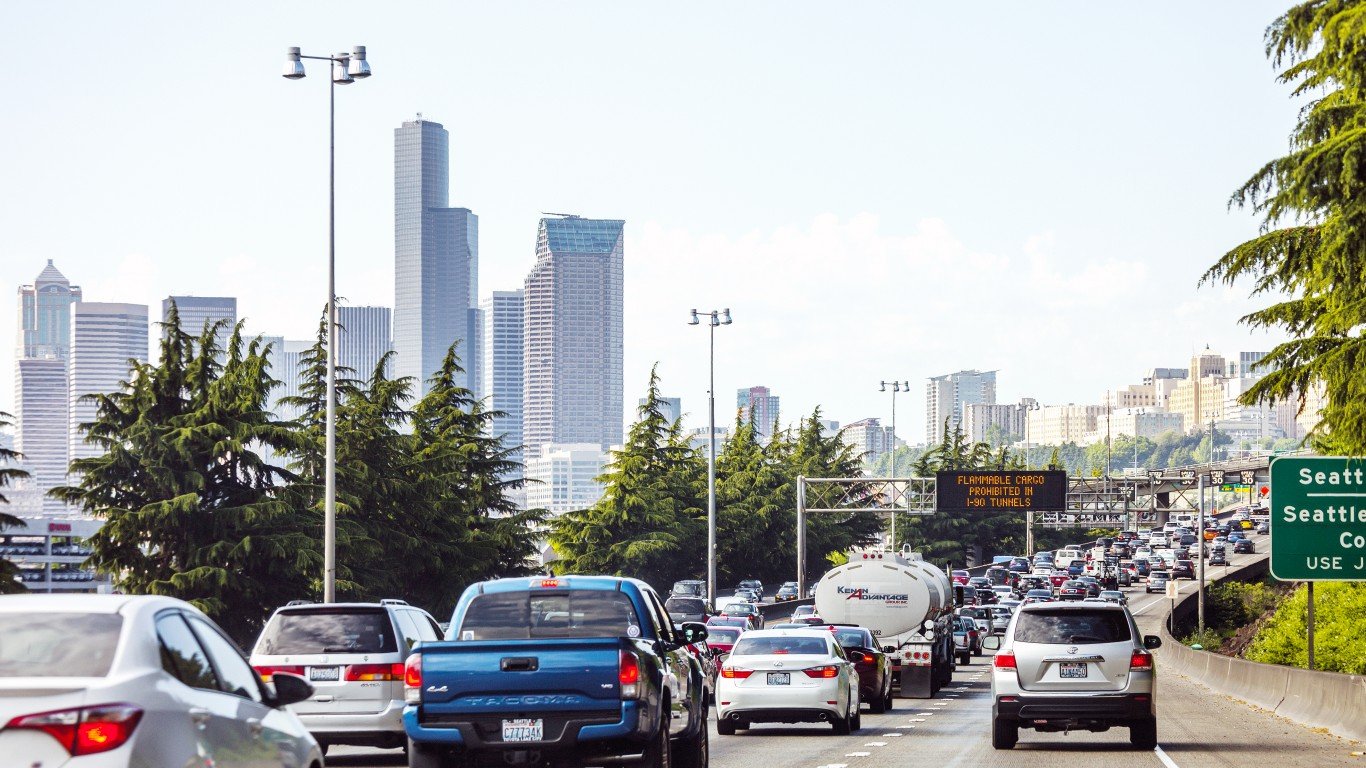
47. Washington: Seattle-Tacoma-Bellevue
> 2018 traffic fatalities per 100,000 people 5.9 per 100,000 (221 total)
> Avg. commute: 31.6 minutes
> Annual hours of delay per commuter: 76
> Avg. annual state auto insurance rate: $1,191
> Most dangerous road: I-5
[recirclink id=596831]
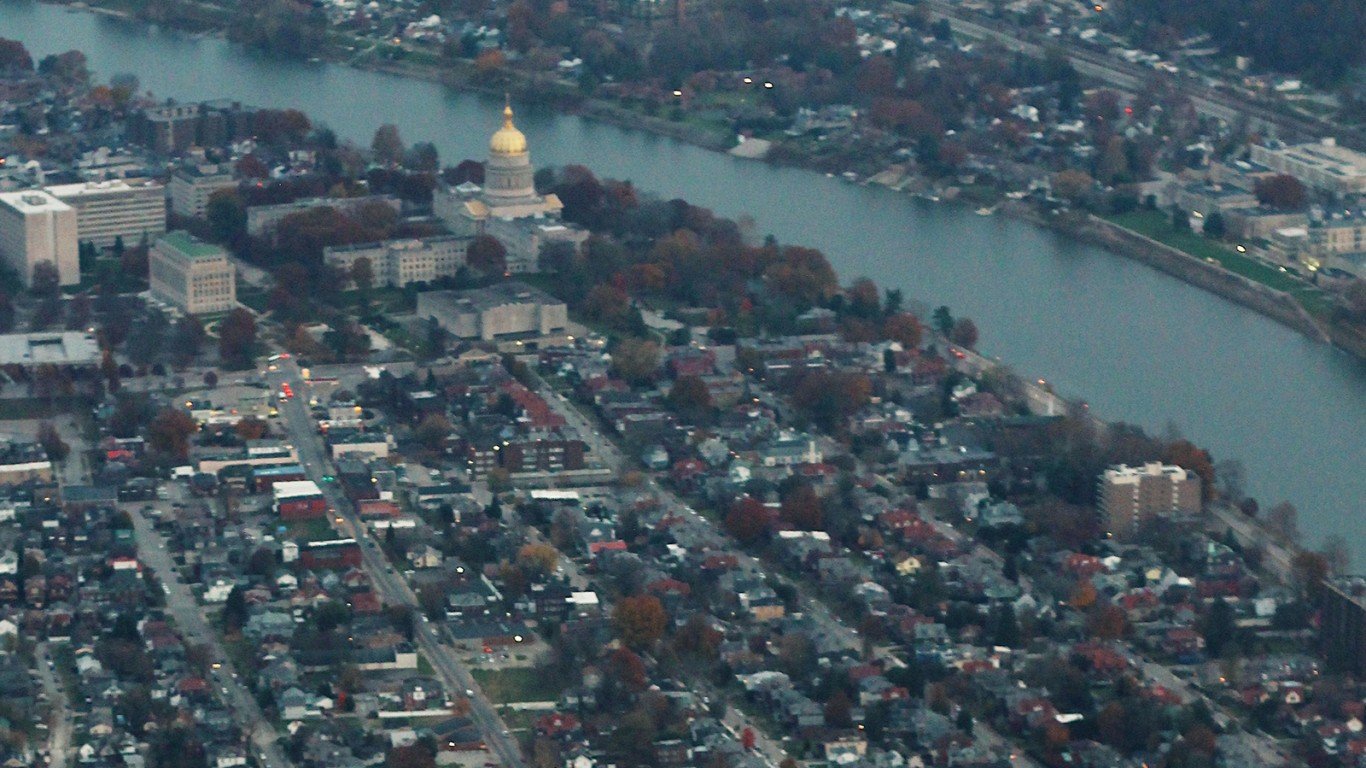
48. West Virginia: Charleston
> 2018 traffic fatalities per 100,000 people 23.3 per 100,000 (63 total)
> Avg. commute: 22.7 minutes
> Annual hours of delay per commuter: 14
> Avg. annual state auto insurance rate: $1,375
> Most dangerous road: US-60
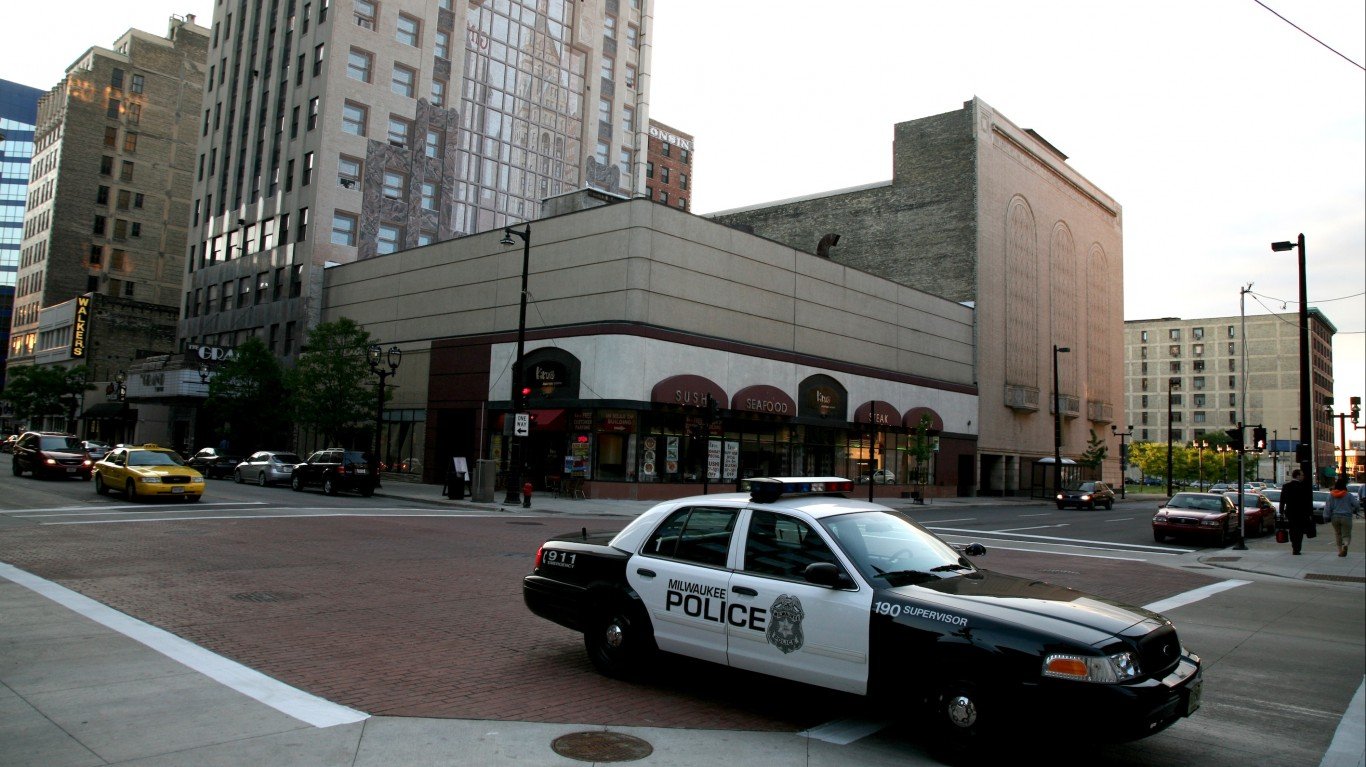
49. Wisconsin: Milwaukee-Waukesha-West Allis
> 2018 traffic fatalities per 100,000 people 6.9 per 100,000 (108 total)
> Avg. commute: 23.0 minutes
> Annual hours of delay per commuter: 44
> Avg. annual state auto insurance rate: $1,351
> Most dangerous road: I-41
[in-text-ad-2]
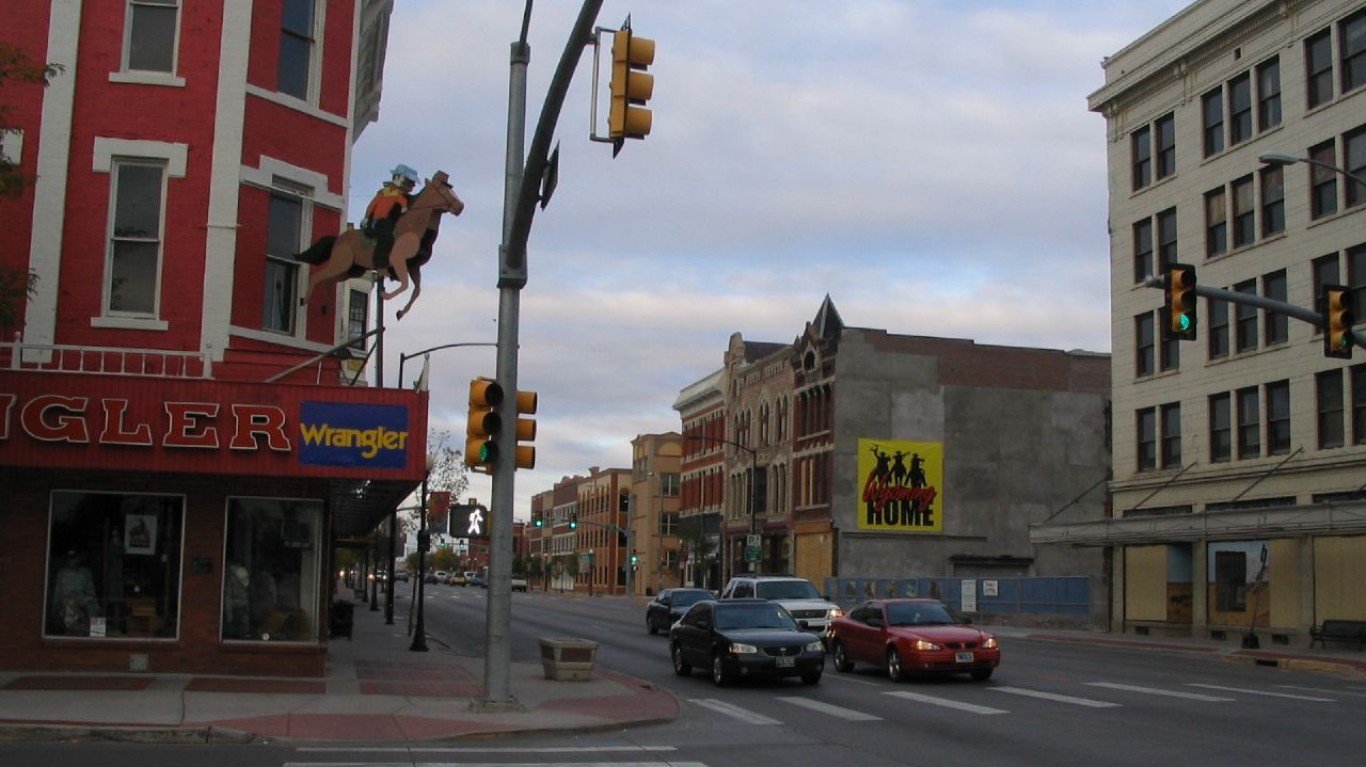
50. Wyoming: Cheyenne
> 2018 traffic fatalities per 100,000 people 13.4 per 100,000 (13 total)
> Avg. commute: 14.8 minutes
> Annual hours of delay per commuter: 12
> Avg. annual state auto insurance rate: $1,494
> Most dangerous road: I-80
Methodology
To determine the worst cities to drive in, 24/7 Wall St. created an index assessing the safety, cost, and convenience of driving in America’s metropolitan statistical areas. Data on the number of traffic fatalities in 2018 from the Fatality Analysis Reporting System were adjusted for population using data from the U.S. Census Bureau’s 2018 American Community Survey. Data on the number of traffic fatalities involving drunk drivers, also from FARS, were adjusted for population using 2018 ACS data. Data on the mean travel time to work for the population 16 years and over came from the 2018 ACS.
Data on the number of car thefts per 100,000 people came from the National Insurance Crime Bureau’s 2018 “Hot Spots” report.
Data on the average cost of fuel per auto commuter accrued while sitting in traffic in 2017, as well as the average number of hours of delay spent in traffic per auto commuter in 2017, came from the Texas A&M Transportation Institute’s 2019 Urban Mobility Report and were aggregated from the urban area level to the metropolitan statistical area level using geographic definitions from the Census Bureau.
Data on the average annual state auto insurance rate came from personal finance company Bankrate. This data was not included in the index.
Contact [email protected] for any questions or corrections.