[cnxvideo id=”704394″ placement=”ros”]
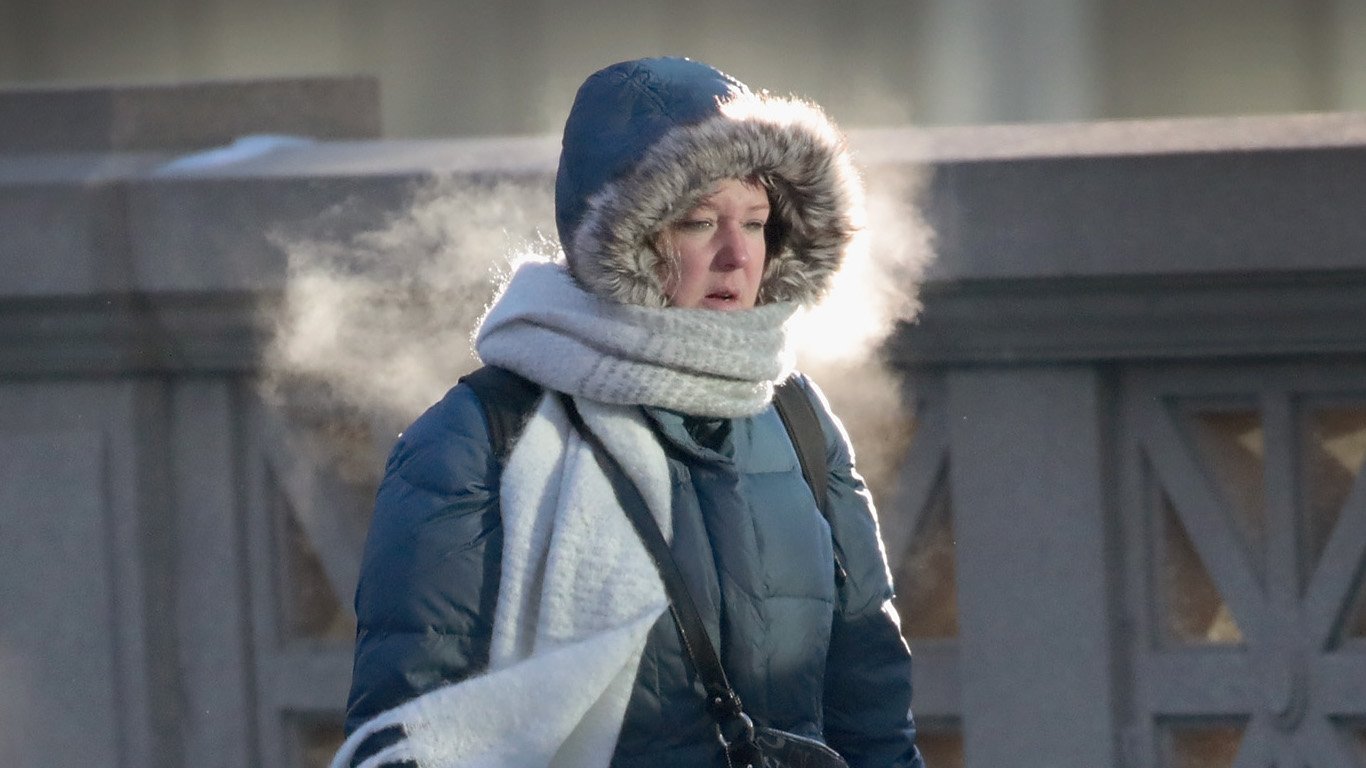
January 2020 was the world’s warmest January on record, according to scientists at NOAA’s National Centers for Environmental Information, which maintains a 141 year climate history. This January was the fifth warmest on record in the United States, with the vast majority of weather stations reporting above average temperatures for November, December, and January.
The departure from normal is based on the difference between historical and recent temperature averages. So while the climate crisis has had real impacts on every part of the world, not all places have experienced similarly mild winter weather this year. (Here are America’s coldest cities.)
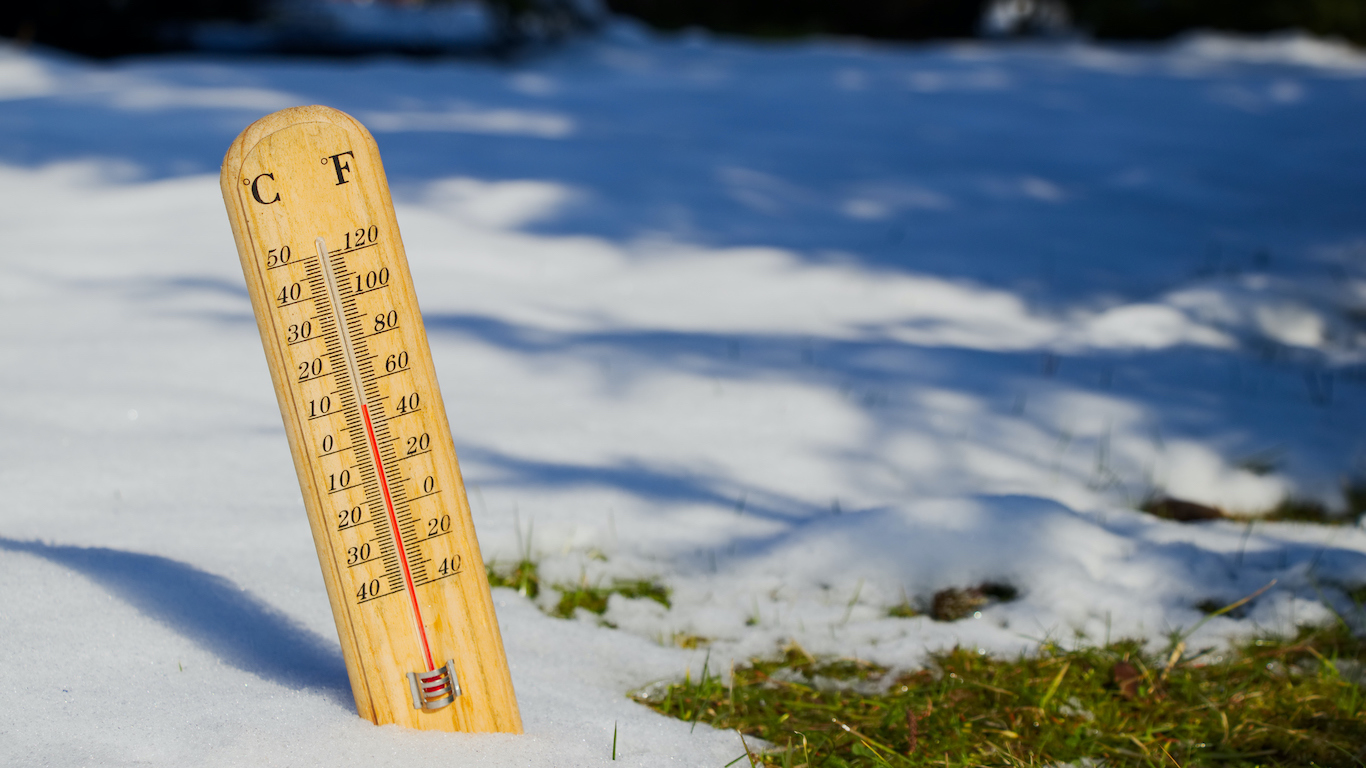
To capture some of these geographical differences and identify the cities having the most unusually mild winters this year, 24/7 Wall St. compared average temperature data from NOAA’s U.S. Historical Climatology Network. We analyzed data for over 1,200 weather stations.
The average temperature this winter through January was lower than the respective historical averages in just 15 of 1,218 U.S. weather stations. However, climate change effects are nothing if not erratic, and despite an overall mild winter, in many areas of the U.S. winter is far from over. The 2020 Farmer’s Almanac predicted in early January severe winter storms in February and March and a late Spring. (Here are the 25 worst holiday storms of all time.)
Click here to see the places having the most unusually mild winters this year.
Click here to see our methodology.
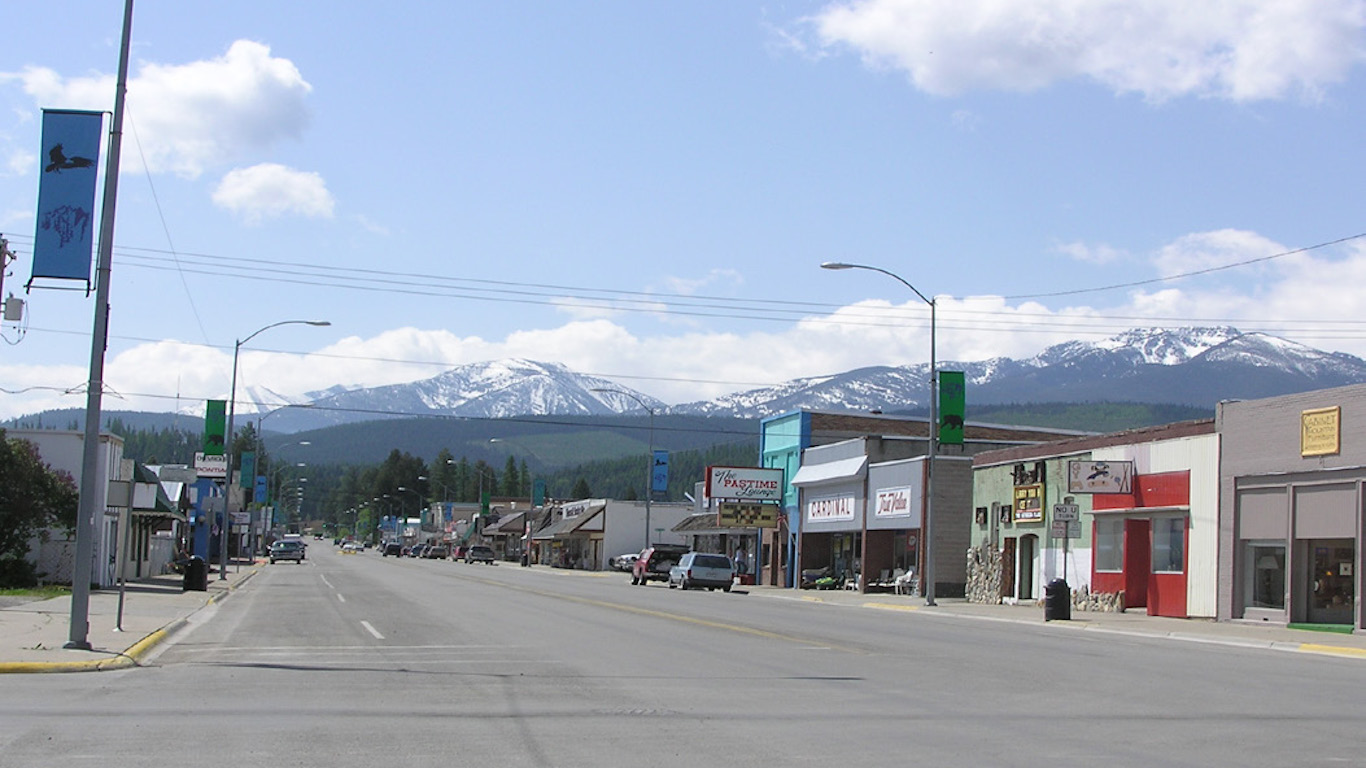
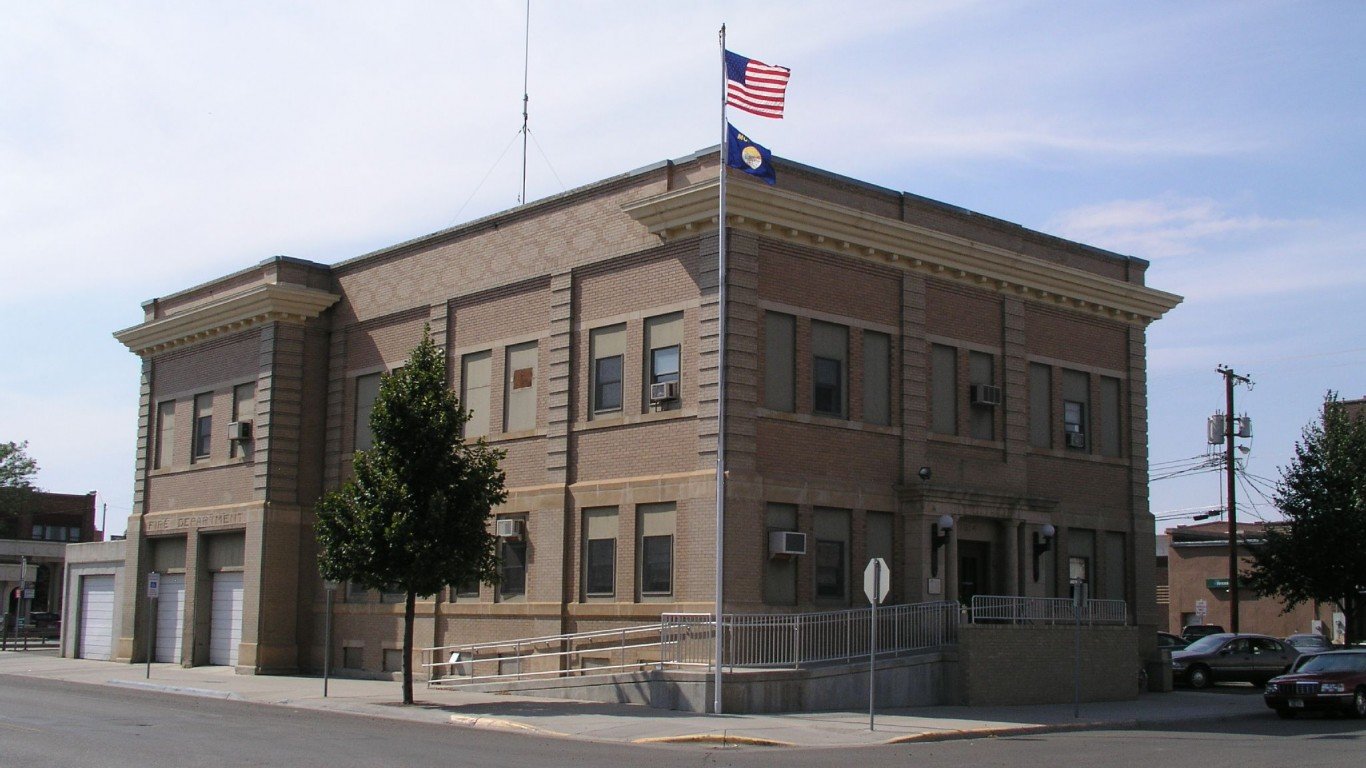
50. Libby, Montana
> Temp difference this winter compared to historical avg.: 4.2 °F
> Avg. temp this winter through Jan. 2020: 31.0 °F
> Avg. temp on record Nov-Jan 2019 (123 years through 2019): 26.8 °F
> Avg. precipitation this winter through Jan. 2020: 43.5 mm
> Avg. precipitation on record Nov-Jan 2019 (125 years through 2019): 57.9 mm
> Population: 2,663

49. Fort Myers, Florida
> Temp difference this winter compared to historical avg.: 4.2 °F
> Avg. temp this winter through Jan. 2020: 70.7 °F
> Avg. temp on record Nov-Jan (128 years through 2019): 66.5 °F
> Avg. precipitation this winter through Jan. 2020: 62.5 mm
> Avg. precipitation on record Nov-Jan (129 years through 2019): 42.3 mm
> Population: 76,591
[in-text-ad]

48. Charleston, South Carolina
> Temp difference this winter compared to historical avg.: 4.2 °F
> Avg. temp this winter through Jan. 2020: 56.5 °F
> Avg. temp on record Nov-Jan (133 years through 2019): 52.4 °F
> Avg. precipitation this winter through Jan. 2020: 67.4 mm
> Avg. precipitation on record Nov-Jan (193 years through 2019): 70.0 mm
> Population: 133,762
[recirclink id=542281]

49. Glendive, Montana
> Temp difference this winter compared to historical avg.: 4.2 °F
> Avg. temp this winter through Jan. 2020: 25.8 °F
> Avg. temp on record Nov-Jan (127 years through 2019): 21.5 °F
> Avg. precipitation this winter through Jan. 2020: 8.3 mm
> Avg. precipitation on record Nov-Jan (131 years through 2019): 11.2 mm
> Population: 5,232

46. Kellogg, Idaho
> Temp difference this winter compared to historical avg.: 4.2 °F
> Avg. temp this winter through Jan. 2020: 34.4 °F
> Avg. temp on record Nov-Jan (127 years through 2019): 30.1 °F
> Avg. precipitation this winter through Jan. 2020: 83.6 mm
> Avg. precipitation on record Nov-Jan (127 years through 2019): 97.9 mm
> Population: 2,442
[in-text-ad-2]

45. Hiram, Ohio
> Temp difference this winter compared to historical avg.: 4.3 °F
> Avg. temp this winter through Jan. 2020: 33.3 °F
> Avg. temp on record Nov-Jan (126 years through 2019): 29.1 °F
> Avg. precipitation this winter through Jan. 2020: 79.4 mm
> Avg. precipitation on record Nov-Jan (136 years through 2019): 77.4 mm
> Population: 1,272

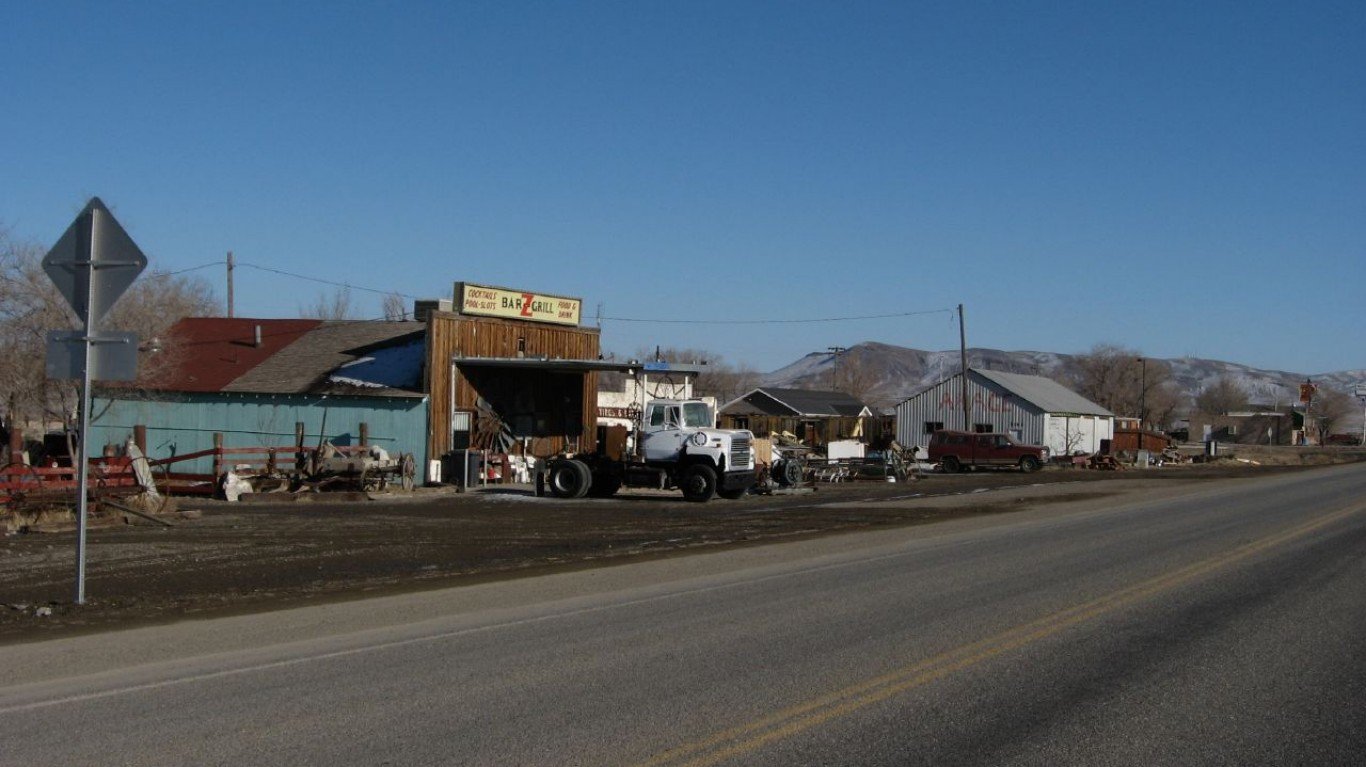
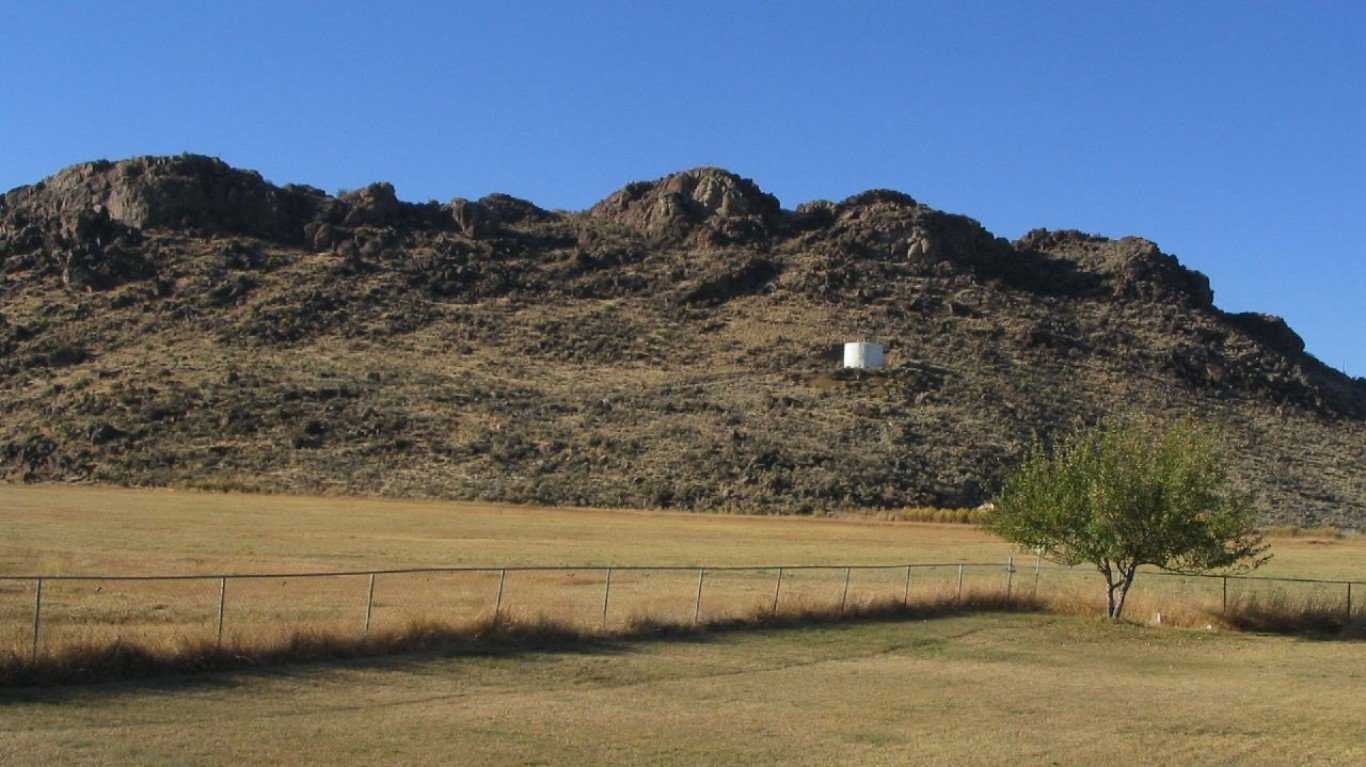
44. Battle Mountain, Nevada
> Temp difference this winter compared to historical avg.: 4.3 °F
> Avg. temp this winter through Jan. 2020: 37.4 °F
> Avg. temp on record Nov-Jan (129 years through 2019): 33.2 °F
> Avg. precipitation this winter through Jan. 2020: 15.7 mm
> Avg. precipitation on record Nov-Jan (150 years through 2019): 18.6 mm
> Population: 3,317
[in-text-ad]

43. Odessa, Washington
> Temp difference this winter compared to historical avg.: 4.3 °F
> Avg. temp this winter through Jan. 2020: 33.7 °F
> Avg. temp on record Nov-Jan (127 years through 2019): 29.5 °F
> Avg. precipitation this winter through Jan. 2020: 26.5 mm
> Avg. precipitation on record Nov-Jan (127 years through 2019): 34.8 mm
> Population: 946
[recirclink id=605979]
42. Roseau, Minnesota
> Temp difference this winter compared to historical avg.: 4.3 °F
> Avg. temp this winter through Jan. 2020: 15.0 °F
> Avg. temp on record Nov-Jan (130 years through 2019): 10.7 °F
> Avg. precipitation this winter through Jan. 2020: 16.7 mm
> Avg. precipitation on record Nov-Jan (134 years through 2019): 17.1 mm
> Population: 2,679
[in-text-ad-2]
41. Golconda, Nevada
> Temp difference this winter compared to historical avg.: 4.3 °F
> Avg. temp this winter through Jan. 2020: 36.4 °F
> Avg. temp on record Nov-Jan (129 years through 2019): 32.0 °F
> Avg. precipitation this winter through Jan. 2020: 21.4 mm
> Avg. precipitation on record Nov-Jan (142 years through 2019): 17.3 mm
> Population: 112
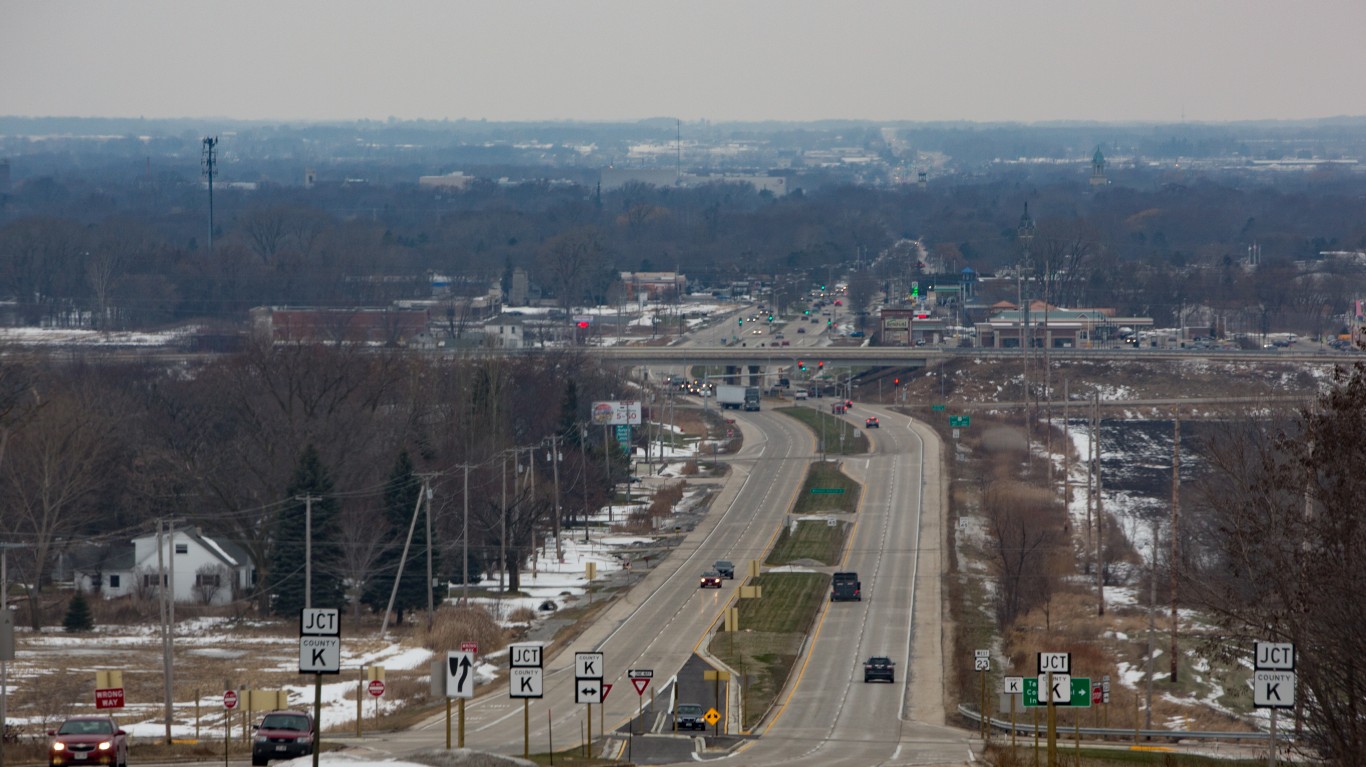
40. Fond du Lac, Wisconsin
> Temp difference this winter compared to historical avg.: 4.4 °F
> Avg. temp this winter through Jan. 2020: 27.1 °F
> Avg. temp on record Nov-Jan (146 years through 2019): 22.7 °F
> Avg. precipitation this winter through Jan. 2020: 40.6 mm
> Avg. precipitation on record Nov-Jan (134 years through 2019): 39.0 mm
> Population: 42,858
[in-text-ad]

39. Hancock, Wisconsin
> Temp difference this winter compared to historical avg.: 4.4 °F
> Avg. temp this winter through Jan. 2020: 25.8 °F
> Avg. temp on record Nov-Jan (132 years through 2019): 21.4 °F
> Avg. precipitation this winter through Jan. 2020: 50.4 mm
> Avg. precipitation on record Nov-Jan (129 years through 2019): 33.6 mm
> Population: 385
[recirclink id=595971]

38. Ritzville, Washington
> Temp difference this winter compared to historical avg.: 4.4 °F
> Avg. temp this winter through Jan. 2020: 34.8 °F
> Avg. temp on record Nov-Jan (127 years through 2019): 30.4 °F
> Avg. precipitation this winter through Jan. 2020: 35.2 mm
> Avg. precipitation on record Nov-Jan (127 years through 2019): 38.7 mm
> Population: 1,628
37. Jordan Valley, Oregon
> Temp difference this winter compared to historical avg.: 4.4 °F
> Avg. temp this winter through Jan. 2020: 31.4 °F
> Avg. temp on record Nov-Jan (113 years through 2019): 27.0 °F
> Avg. precipitation this winter through Jan. 2020: 28.4 mm
> Avg. precipitation on record Nov-Jan (124 years through 2019): 30.8 mm
> Population: 155
[in-text-ad-2]
36. Wells, Nevada
> Temp difference this winter compared to historical avg.: 4.4 °F
> Avg. temp this winter through Jan. 2020: 30.2 °F
> Avg. temp on record Nov-Jan (115 years through 2019): 25.8 °F
> Avg. precipitation this winter through Jan. 2020: 21.0 mm
> Avg. precipitation on record Nov-Jan (150 years through 2019): 25.5 mm
> Population: 1,150
35. Del Norte, Colorado
> Temp difference this winter compared to historical avg.: 4.4 °F
> Avg. temp this winter through Jan. 2020: 21.1 °F
> Avg. temp on record Nov-Jan (120 years through 2019): 25.5 °F
> Avg. precipitation this winter through Jan. 2020: 11.1 mm
> Avg. precipitation on record Nov-Jan (126 years through 2019): 10.1 mm
> Population: 1,539
[in-text-ad]
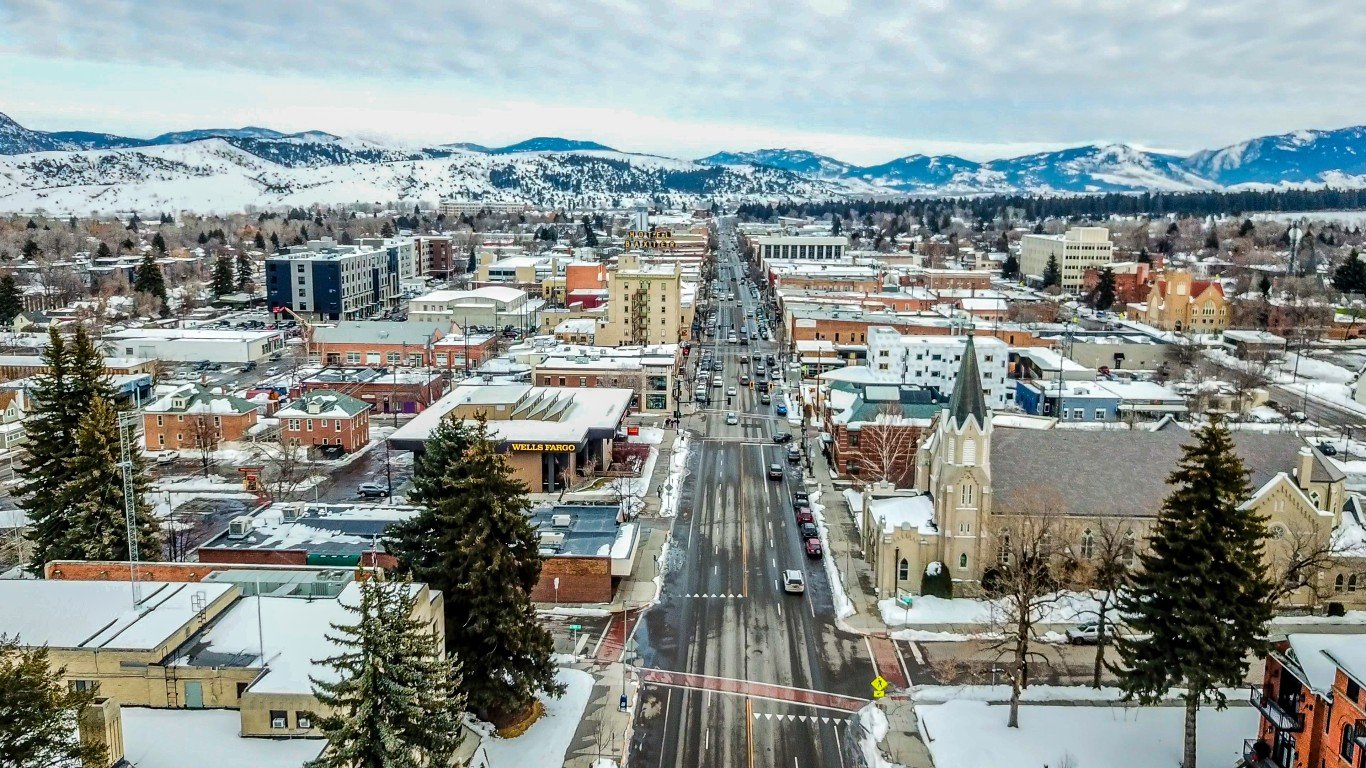
34. Bozeman, Montana
> Temp difference this winter compared to historical avg.: 4.4 °F
> Avg. temp this winter through Jan. 2020: 27.6 °F
> Avg. temp on record Nov-Jan (125 years through 2019): 23.2 °F
> Avg. precipitation this winter through Jan. 2020: 16.3 mm
> Avg. precipitation on record Nov-Jan (141 years through 2019): 25.2 mm
> Population: 45,121
[recirclink id=542281]
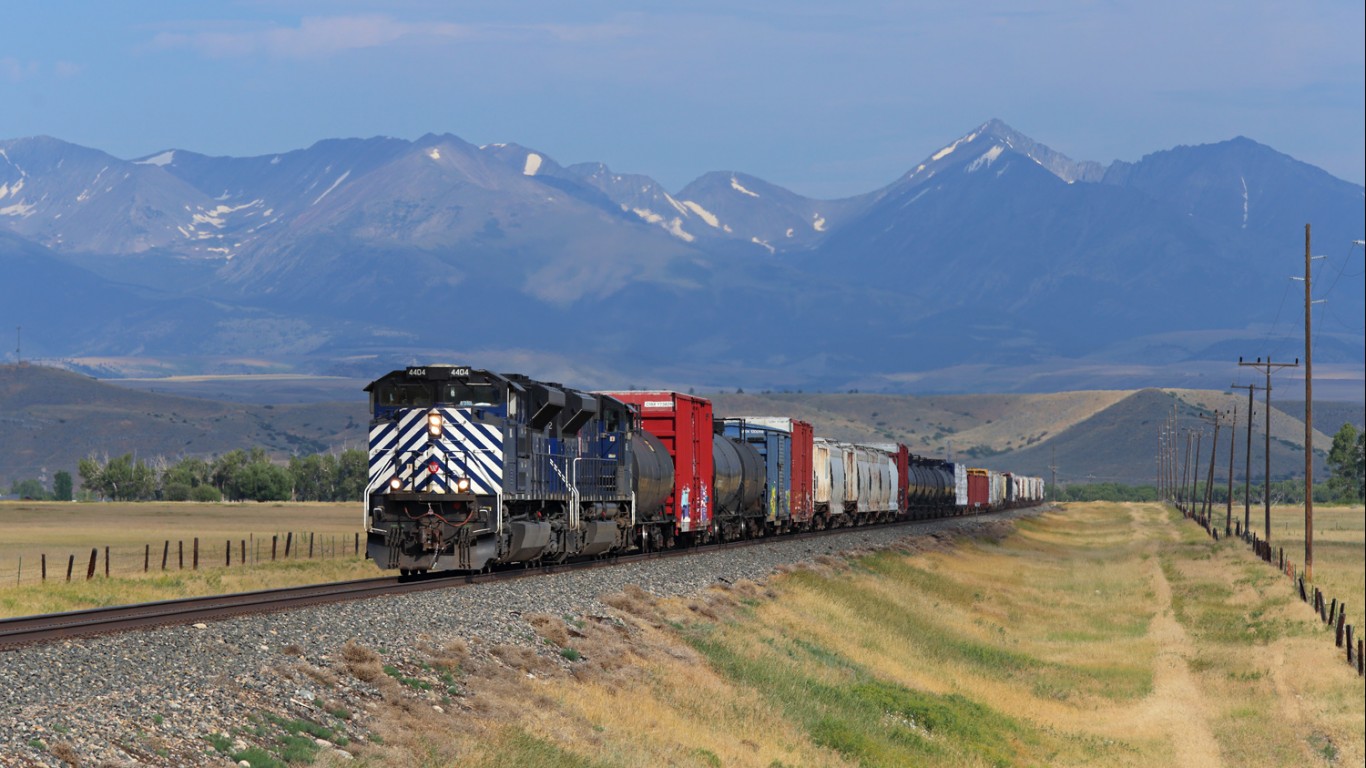
33. Big Timber, Montana
> Temp difference this winter compared to historical avg.: 4.4 °F
> Avg. temp this winter through Jan. 2020: 32.7 °F
> Avg. temp on record Nov-Jan (123 years through 2019): 28.3 °F
> Avg. precipitation this winter through Jan. 2020: 7.7 mm
> Avg. precipitation on record Nov-Jan (123 years through 2019): 16.2 mm
> Population: 1,739

32. Coeur d’Alene, Idaho
> Temp difference this winter compared to historical avg.: 4.4 °F
> Avg. temp this winter through Jan. 2020: 36.4 °F
> Avg. temp on record Nov-Jan (127 years through 2019): 32.0 °F
> Avg. precipitation this winter through Jan. 2020: 72.1 mm
> Avg. precipitation on record Nov-Jan (135 years through 2019): 83.1 mm
> Population: 49,609
[in-text-ad-2]

31. Milwaukee, Wisconsin
> Temp difference this winter compared to historical avg.: 4.4 °F
> Avg. temp this winter through Jan. 2020: 31.5 °F
> Avg. temp on record Nov-Jan (145 years through 2019): 27.1 °F
> Avg. precipitation this winter through Jan. 2020: 43.1 mm
> Avg. precipitation on record Nov-Jan (128 years through 2019): 45.2 mm
> Population: 596,886
30. Miles City, Montana
> Temp difference this winter compared to historical avg.: 4.4 °F
> Avg. temp this winter through Jan. 2020: 27.2 °F
> Avg. temp on record Nov-Jan (127 years through 2019): 22.8 °F
> Avg. precipitation this winter through Jan. 2020: 3.6 mm
> Avg. precipitation on record Nov-Jan (142 years through 2019): 12.2 mm
> Population: 8,576
[in-text-ad]

29. Gaastra, Michigan
> Temp difference this winter compared to historical avg.: 4.4 °F
> Avg. temp this winter through Jan. 2020: 21.0 °F
> Avg. temp on record Nov-Jan (126 years through 2019): 16.5 °F
> Avg. precipitation this winter through Jan. 2020: 60.5 mm
> Avg. precipitation on record Nov-Jan (125 years through 2019): 40.2 mm
> Population: 331
[recirclink id=599149]

28. Helena, Montana
> Temp difference this winter compared to historical avg.: 4.4 °F
> Avg. temp this winter through Jan. 2020: 30.4 °F
> Avg. temp on record Nov-Jan (126 years through 2019): 25.9 °F
> Avg. precipitation this winter through Jan. 2020: 8.1 mm
> Avg. precipitation on record Nov-Jan (139 years through 2019): 15.9 mm
> Population: 31,212

27. Moberly, Missouri
> Temp difference this winter compared to historical avg.: 4.6 °F
> Avg. temp this winter through Jan. 2020: 37.9 °F
> Avg. temp on record Nov-Jan (126 years through 2019): 33.3 °F
> Avg. precipitation this winter through Jan. 2020: 56.9 mm
> Avg. precipitation on record Nov-Jan (127 years through 2019): 50.7 mm
> Population: 13,762
[in-text-ad-2]
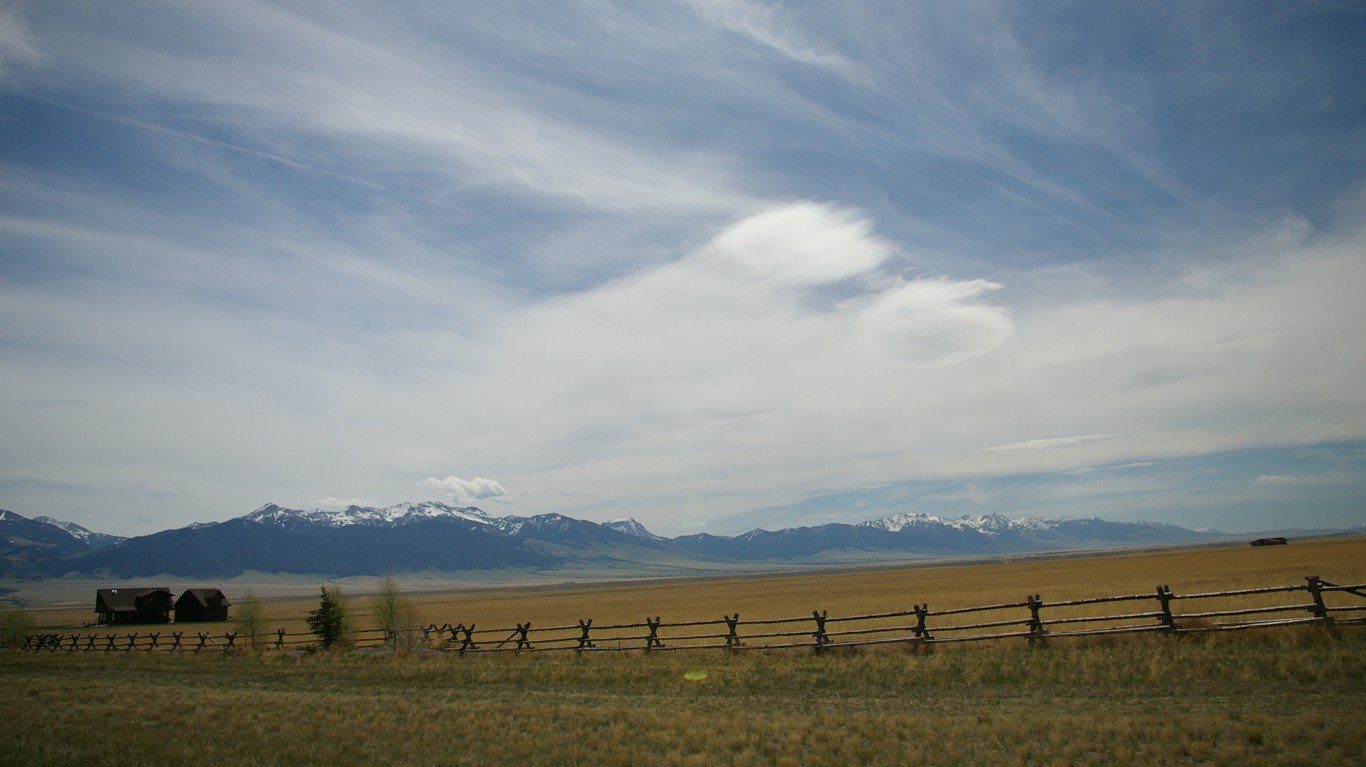
26. Ennis, Montana
> Temp difference this winter compared to historical avg.: 4.6 °F
> Avg. temp this winter through Jan. 2020: 34.4 °F
> Avg. temp on record Nov-Jan (123 years through 2019): 29.9 °F
> Avg. precipitation this winter through Jan. 2020: 11.7 mm
> Avg. precipitation on record Nov-Jan (126 years through 2019): 18.5 mm
> Population: 925

25. Jordan, Montana
> Temp difference this winter compared to historical avg.: 4.6 °F
> Avg. temp this winter through Jan. 2020: 25.2 °F
> Avg. temp on record Nov-Jan (126 years through 2019): 20.6 °F
> Avg. precipitation this winter through Jan. 2020: 8.9 mm
> Avg. precipitation on record Nov-Jan (127 years through 2019): 10.1 mm
> Population: 473
[in-text-ad]
24. Winnemucca, Nevada
> Temp difference this winter compared to historical avg.: 4.6 °F
> Avg. temp this winter through Jan. 2020: 36.9 °F
> Avg. temp on record Nov-Jan (131 years through 2019): 32.4 °F
> Avg. precipitation this winter through Jan. 2020: 20.6 mm
> Avg. precipitation on record Nov-Jan (149 years through 2019): 23.3 mm
> Population: 7,798
[recirclink id=542281]
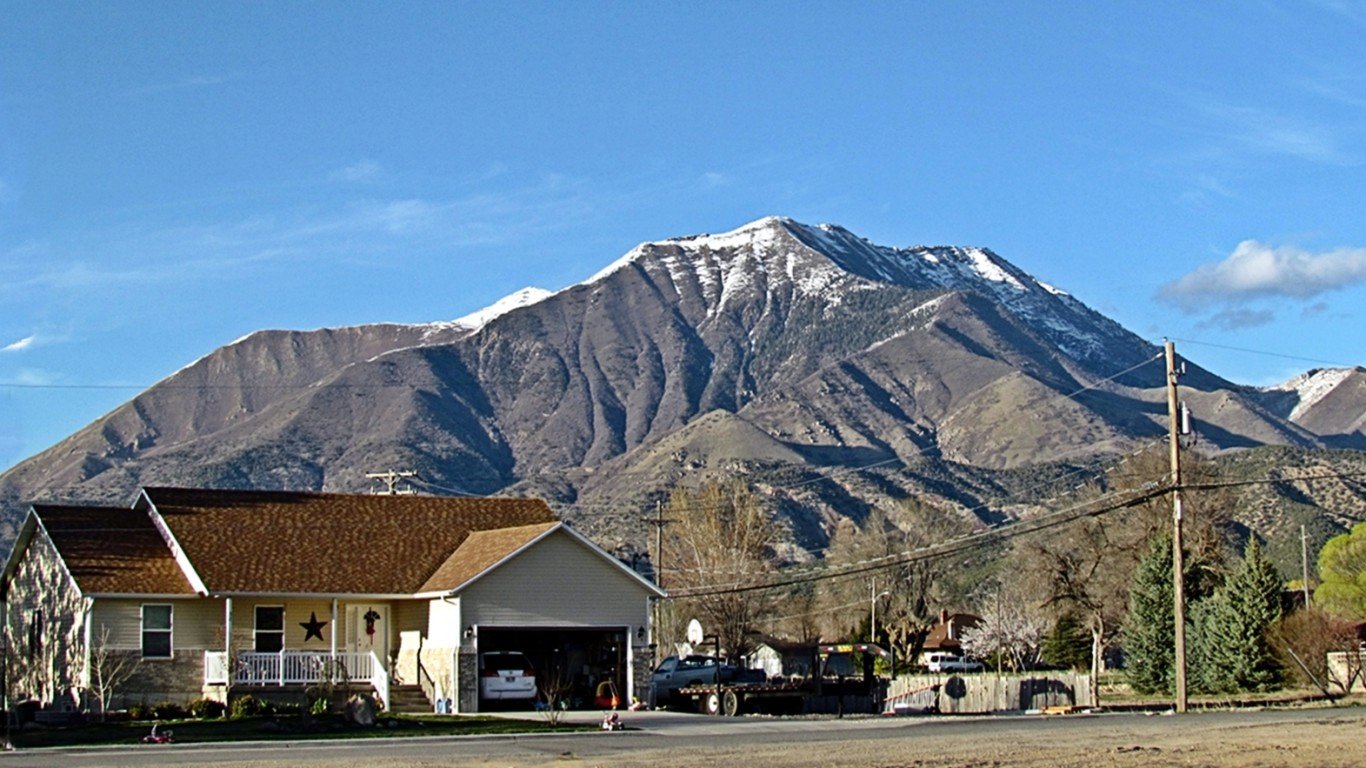
23. Nephi, Utah
> Temp difference this winter compared to historical avg.: 4.6 °F
> Avg. temp this winter through Jan. 2020: 34.9 °F
> Avg. temp on record Nov-Jan (126 years through 2019): 30.3 °F
> Avg. precipitation this winter through Jan. 2020: 40.0 mm
> Avg. precipitation on record Nov-Jan (125 years through 2019): 23.0 mm
> Population: 5,761

22. Colville, Washington
> Temp difference this winter compared to historical avg.: 4.6 °F
> Avg. temp this winter through Jan. 2020: 31.5 °F
> Avg. temp on record Nov-Jan (123 years through 2019): 26.9 °F
> Avg. precipitation this winter through Jan. 2020: 64.7 mm
> Avg. precipitation on record Nov-Jan (137 years through 2019): 54.9 mm
> Population: 4,777
[in-text-ad-2]
21. Colstrip, Montana
> Temp difference this winter compared to historical avg.: 4.6 °F
> Avg. temp this winter through Jan. 2020: 28.7 °F
> Avg. temp on record Nov-Jan (126 years through 2019): 24.1 °F
> Avg. precipitation this winter through Jan. 2020: 7.0 mm
> Avg. precipitation on record Nov-Jan (139 years through 2019): 19.2 mm
> Population: 2,446

20. Darlington, Wisconsin
> Temp difference this winter compared to historical avg.: 4.6 °F
> Avg. temp this winter through Jan. 2020: 29.2 °F
> Avg. temp on record Nov-Jan (126 years through 2019): 24.6 °F
> Avg. precipitation this winter through Jan. 2020: 37.7 mm
> Avg. precipitation on record Nov-Jan (127 years through 2019): 39.4 mm
> Population: 2,330
[in-text-ad]

19. Dunn Center, North Dakota
> Temp difference this winter compared to historical avg.: 4.6 °F
> Avg. temp this winter through Jan. 2020: 21.4 °F
> Avg. temp on record Nov-Jan (126 years through 2019): 16.8 °F
> Avg. precipitation this winter through Jan. 2020: 7.1 mm
> Avg. precipitation on record Nov-Jan (127 years through 2019): 11.0 mm
> Population: 258
[recirclink id=605979]

18. Glasgow, Montana
> Temp difference this winter compared to historical avg.: 4.6 °F
> Avg. temp this winter through Jan. 2020: 22.3 °F
> Avg. temp on record Nov-Jan (117 years through 2019): 17.6 °F
> Avg. precipitation this winter through Jan. 2020: 12.9 mm
> Avg. precipitation on record Nov-Jan (125 years through 2019): 11.4 mm
> Population: 3,348

17. St. Regis, Montana
> Temp difference this winter compared to historical avg.: 4.7 °F
> Avg. temp this winter through Jan. 2020: 32.2 °F
> Avg. temp on record Nov-Jan (121 years through 2019): 27.6 °F
> Avg. precipitation this winter through Jan. 2020: 52.0 mm
> Avg. precipitation on record Nov-Jan (124 years through 2019): 87.7 mm
> Population: 305
[in-text-ad-2]
16. Hamilton, Montana
> Temp difference this winter compared to historical avg.: 4.7 °F
> Avg. temp this winter through Jan. 2020: 32.1 °F
> Avg. temp on record Nov-Jan (118 years through 2019): 27.4 °F
> Avg. precipitation this winter through Jan. 2020: 28.4 mm
> Avg. precipitation on record Nov-Jan (126 years through 2019): 25.2 mm
> Population: 4,628

15. Oconto, Wisconsin
> Temp difference this winter compared to historical avg.: 4.7 °F
> Avg. temp this winter through Jan. 2020: 28.4 °F
> Avg. temp on record Nov-Jan (129 years through 2019): 23.7 °F
> Avg. precipitation this winter through Jan. 2020: 65.8 mm
> Avg. precipitation on record Nov-Jan (129 years through 2019): 44.8 mm
> Population: 4,469
[in-text-ad]

14. Nampa, Idaho
> Temp difference this winter compared to historical avg.: 4.8 °F
> Avg. temp this winter through Jan. 2020: 37.6 °F
> Avg. temp on record Nov-Jan (120 years through 2019): 32.8 °F
> Avg. precipitation this winter through Jan. 2020: 28.0 mm
> Avg. precipitation on record Nov-Jan (127 years through 2019): 32.8 mm
> Population: 91,663
[recirclink id=595971]

13. Tooele, Utah
> Temp difference this winter compared to historical avg.: 4.8 °F
> Avg. temp this winter through Jan. 2020: 33.6 °F
> Avg. temp on record Nov-Jan (123 years through 2019): 28.8 °F
> Avg. precipitation this winter through Jan. 2020: 34.2 mm
> Avg. precipitation on record Nov-Jan (123 years through 2019): 36.9 mm
> Population: 33,805

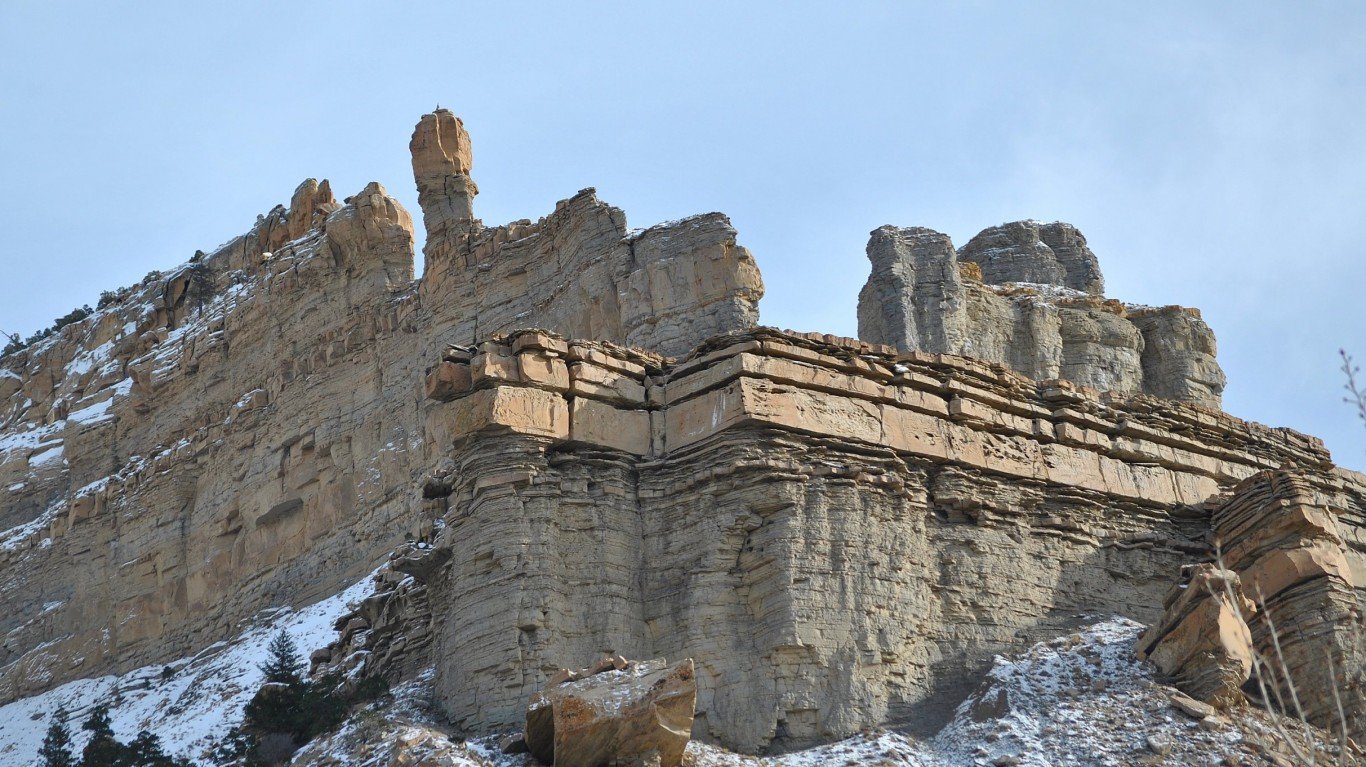
12. Powell, Wyoming
> Temp difference this winter compared to historical avg.: 4.9 °F
> Avg. temp this winter through Jan. 2020: 27.4 °F
> Avg. temp on record Nov-Jan (120 years through 2019): 22.5 °F
> Avg. precipitation this winter through Jan. 2020: 1.0 mm
> Avg. precipitation on record Nov-Jan (120 years through 2019): 4.4 mm
> Population: 6,349
[in-text-ad-2]

11. Savage, Montana
> Temp difference this winter compared to historical avg.: 4.9 °F
> Avg. temp this winter through Jan. 2020: 24.4 °F
> Avg. temp on record Nov-Jan (126 years through 2019): 19.4 °F
> Avg. precipitation this winter through Jan. 2020: 6.6 mm
> Avg. precipitation on record Nov-Jan (127 years through 2019): 10.3 mm
> Population: 283
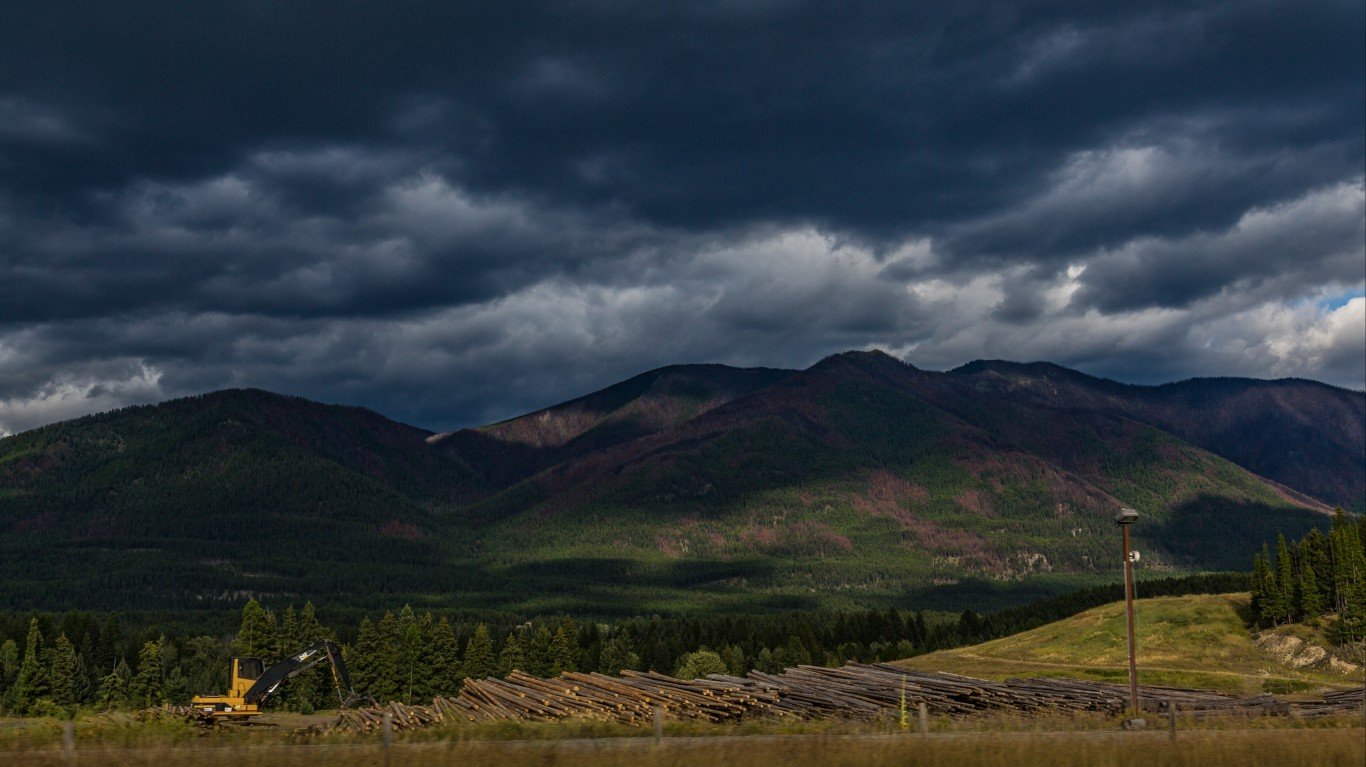
10. Fortine, Montana
> Temp difference this winter compared to historical avg.: 4.9 °F
> Avg. temp this winter through Jan. 2020: 28.6 °F
> Avg. temp on record Nov-Jan (122 years through 2019): 23.7 °F
> Avg. precipitation this winter through Jan. 2020: 21.1 mm
> Avg. precipitation on record Nov-Jan (124 years through 2019): 34.9 mm
> Population: 321
[in-text-ad]

9. New London, Wisconsin
> Temp difference this winter compared to historical avg.: 5.1 °F
> Avg. temp this winter through Jan. 2020: 28.0 °F
> Avg. temp on record Nov-Jan (126 years through 2019): 23.0 °F
> Avg. precipitation this winter through Jan. 2020: 56.1 mm
> Avg. precipitation on record Nov-Jan (129 years through 2019): 41.8 mm
> Population: 6,772
[recirclink id=542281]
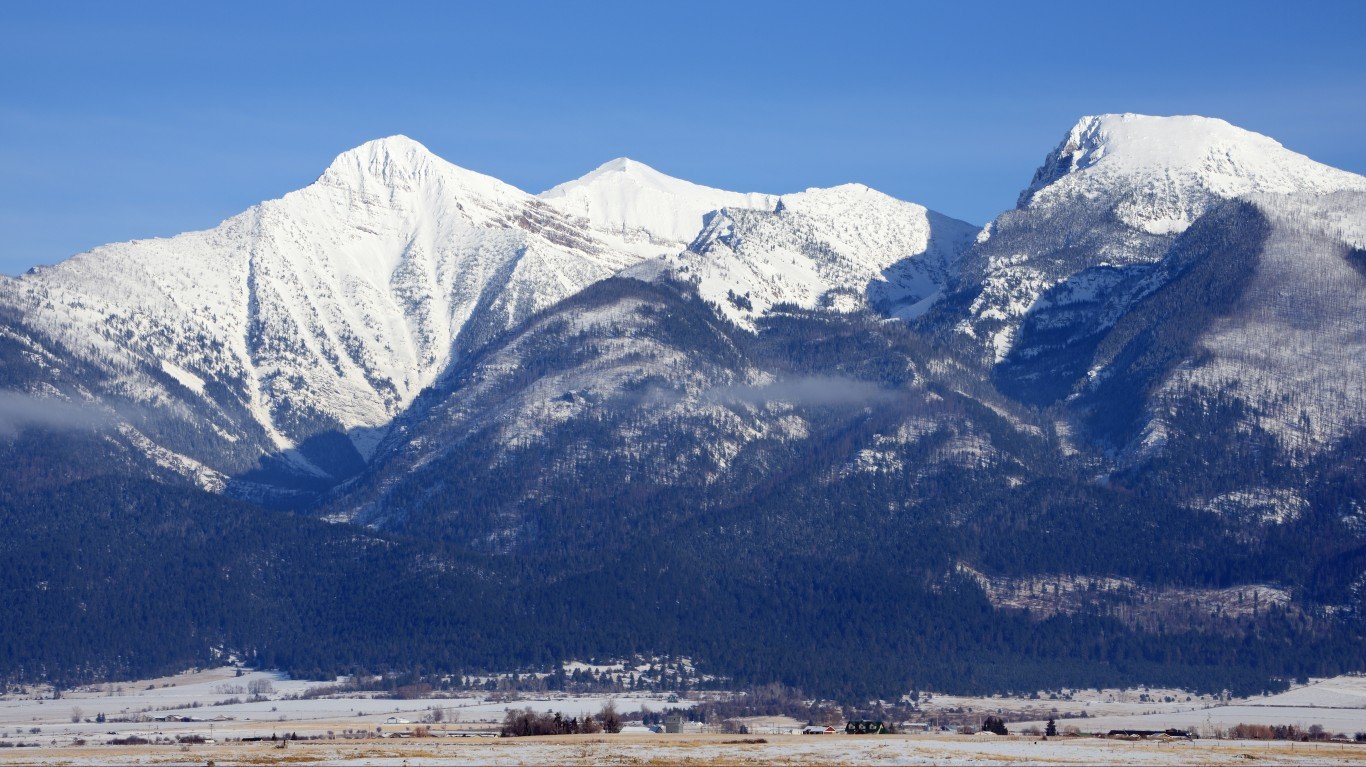
8. Saint Ignatius, Montana
> Temp difference this winter compared to historical avg.: 5.1 °F
> Avg. temp this winter through Jan. 2020: 33.5 °F
> Avg. temp on record Nov-Jan (122 years through 2019): 28.4 °F
> Avg. precipitation this winter through Jan. 2020: 14.1 mm
> Avg. precipitation on record Nov-Jan (125 years through 2019): 24.6 mm
> Population: 746
7. Elk City, Idaho
> Temp difference this winter compared to historical avg.: 5.1 °F
> Avg. temp this winter through Jan. 2020: 37.3 °F
> Avg. temp on record Nov-Jan (116 years through 2019): 32.2 °F
> Avg. precipitation this winter through Jan. 2020: 92.3 mm
> Avg. precipitation on record Nov-Jan (125 years through 2019): 71.0 mm
> Population: 83
[in-text-ad-2]

6. Pembina, North Dakota
> Temp difference this winter compared to historical avg.: 5.1 °F
> Avg. temp this winter through Jan. 2020: 15.6 °F
> Avg. temp on record Nov-Jan (136 years through 2019): 10.5 °F
> Avg. precipitation this winter through Jan. 2020: 10.8 mm
> Avg. precipitation on record Nov-Jan (148 years through 2019): 16.0 mm
> Population: 504

5. Elko, Nevada
> Temp difference this winter compared to historical avg.: 5.2 °F
> Avg. temp this winter through Jan. 2020: 34.3 °F
> Avg. temp on record Nov-Jan (121 years through 2019): 29.1 °F
> Avg. precipitation this winter through Jan. 2020: 28.2 mm
> Avg. precipitation on record Nov-Jan (150 years through 2019): 26.4 mm
> Population: 20,247
[in-text-ad]
4. Evergreen, Montana
> Temp difference this winter compared to historical avg.: 5.4 °F
> Avg. temp this winter through Jan. 2020: 30.0 °F
> Avg. temp on record Nov-Jan (125 years through 2019): 24.6 °F
> Avg. precipitation this winter through Jan. 2020: 31.5 mm
> Avg. precipitation on record Nov-Jan (125 years through 2019): 36.1 mm
> Population: 7,907
[recirclink id=599149]
3. Basin, Wyoming
> Temp difference this winter compared to historical avg.: 5.6 °F
> Avg. temp this winter through Jan. 2020: 29.5 °F
> Avg. temp on record Nov-Jan (121 years through 2019): 23.8 °F
> Avg. precipitation this winter through Jan. 2020: 5.6 mm
> Avg. precipitation on record Nov-Jan (121 years through 2019): 8.1 mm
> Population: 1,596

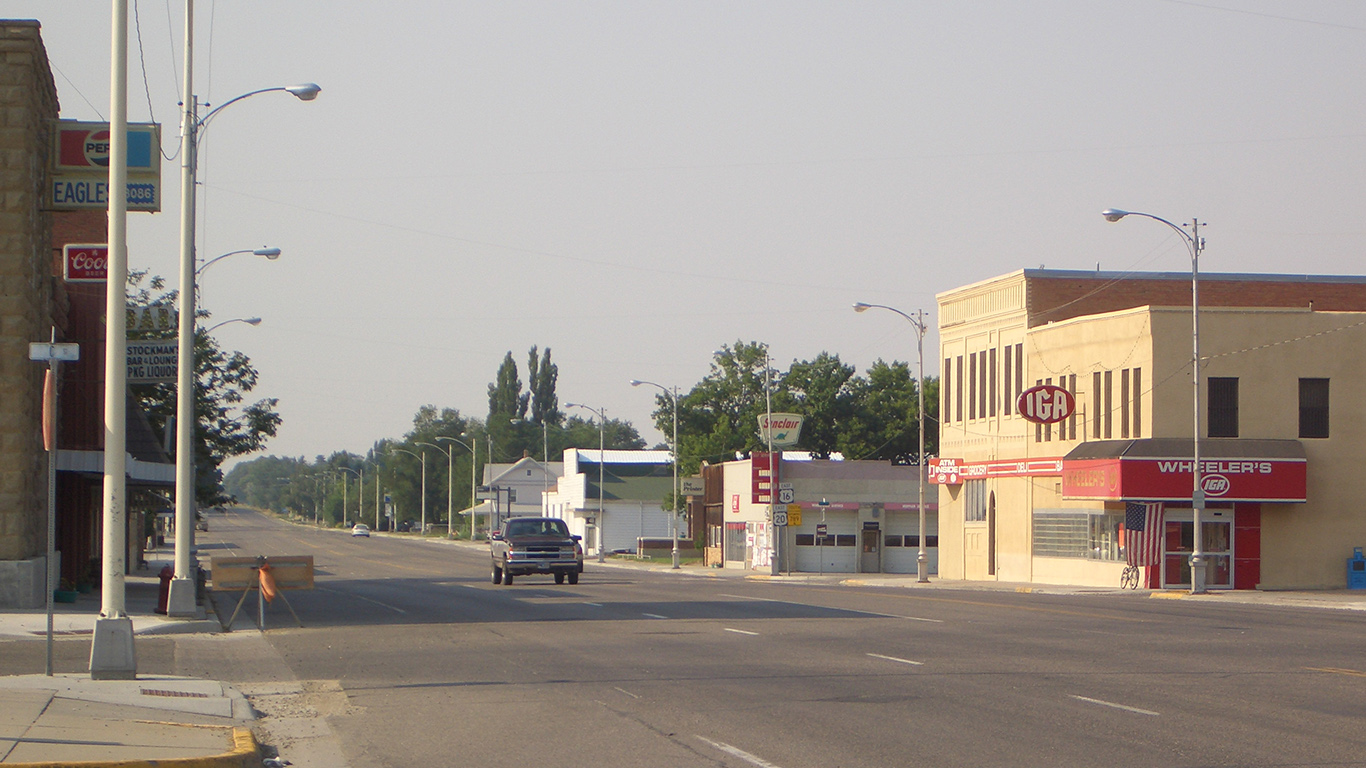
2. Imperial, Nebraska
> Temp difference this winter compared to historical avg.: 5.7 °F
> Avg. temp this winter through Jan. 2020: 35.2 °F
> Avg. temp on record Nov-Jan (126 years through 2019): 29.6 °F
> Avg. precipitation this winter through Jan. 2020: 6.6 mm
> Avg. precipitation on record Nov-Jan (127 years through 2019): 13.2 mm
> Population: 1,857
[in-text-ad-2]
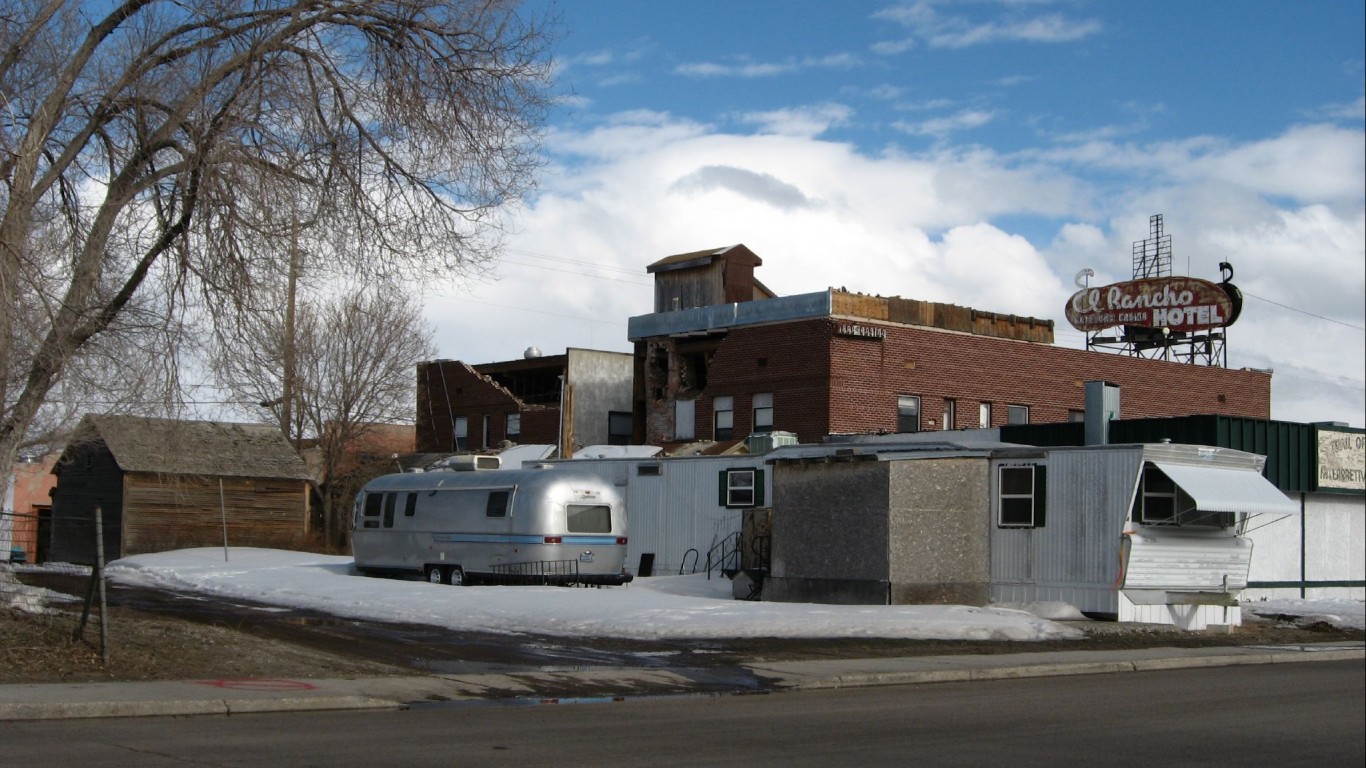
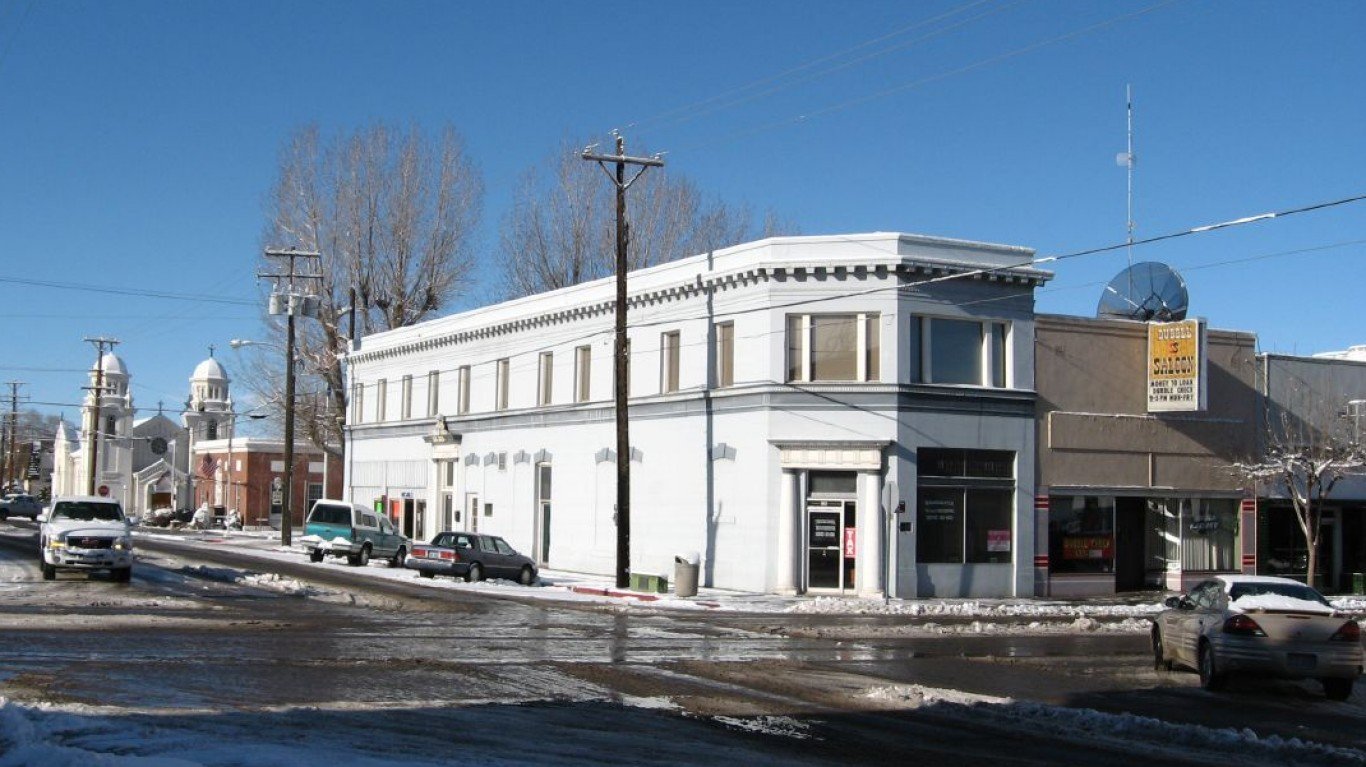
1. Helper, Utah
> Temp difference this winter compared to historical avg.: 5.7 °F
> Avg. temp this winter through Jan. 2020: 24.7 °F
> Avg. temp on record Nov-Jan (120 years through 2019): 19.0 °F
> Avg. precipitation this winter through Jan. 2020: 66.8 mm
> Avg. precipitation on record Nov-Jan (123 years through 2019): 32.4 mm
> Population: 2,051
Methodology
To determine which cities are having milder-than-average winters this year, 24/7 Wall St. reviewed monthly temperature and precipitation data from the U.S. Historical Climatology Network Monthly (USHCN) Version 2.5.0 for the months of November, December, and January for 1,218 stations across the United States. Only years for which all 12 months of data were available were included in the historical winter average calculations.
Average weather for those months for each city was created using historical monthly data for the number of years available for each weather station associated with the city.
Total population, median household income, and educational attainment in cities for which data was available came from the American Community Survey 2018 and are 5-Year Estimates.
Contact [email protected] for any questions or corrections.